On May 21, 2026, SRE NL and Coralogix joined forces for “Who’s Watching the Agents?” — a community event hosted at Miro’s Amsterdam office exploring what happens when AI becomes your engineering partner, and who is responsible for observing the observers.
Observability for Engineers: When AI Becomes Your Partner
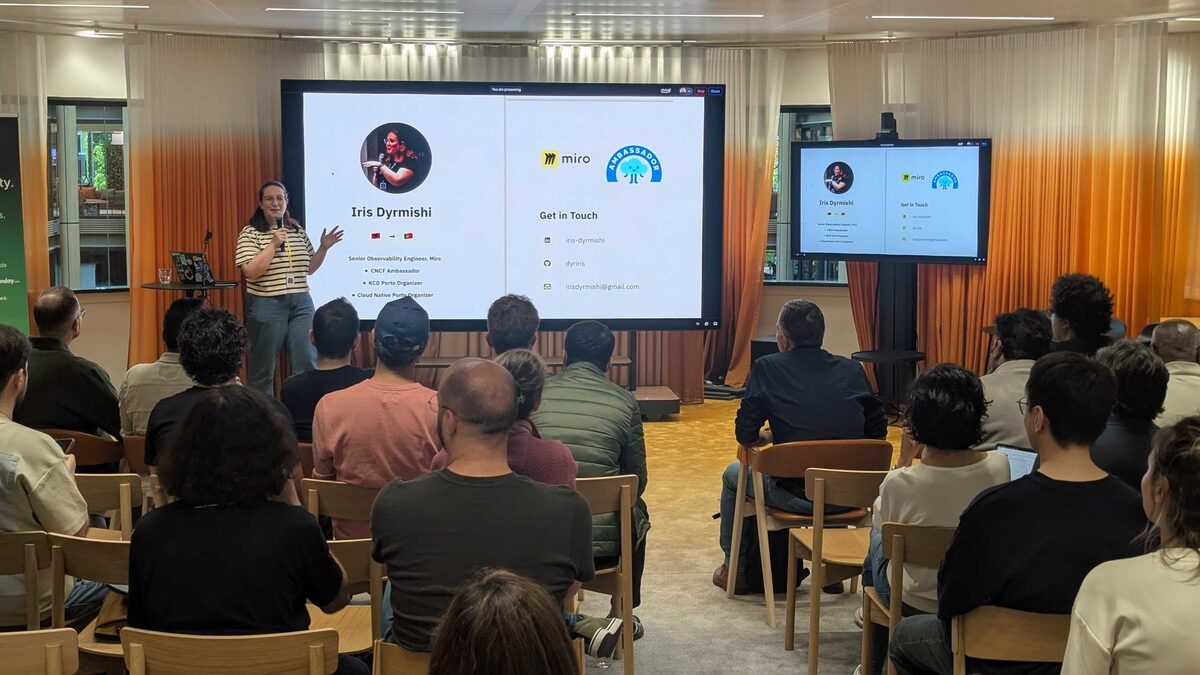
Iris Dyrmishi — Senior Observability Engineer at Miro, CNCF Ambassador, KCD Porto Organizer, and Cloud Native Porto Organizer — kicked off the evening with a talk that reframed the entire AI-in-observability narrative.
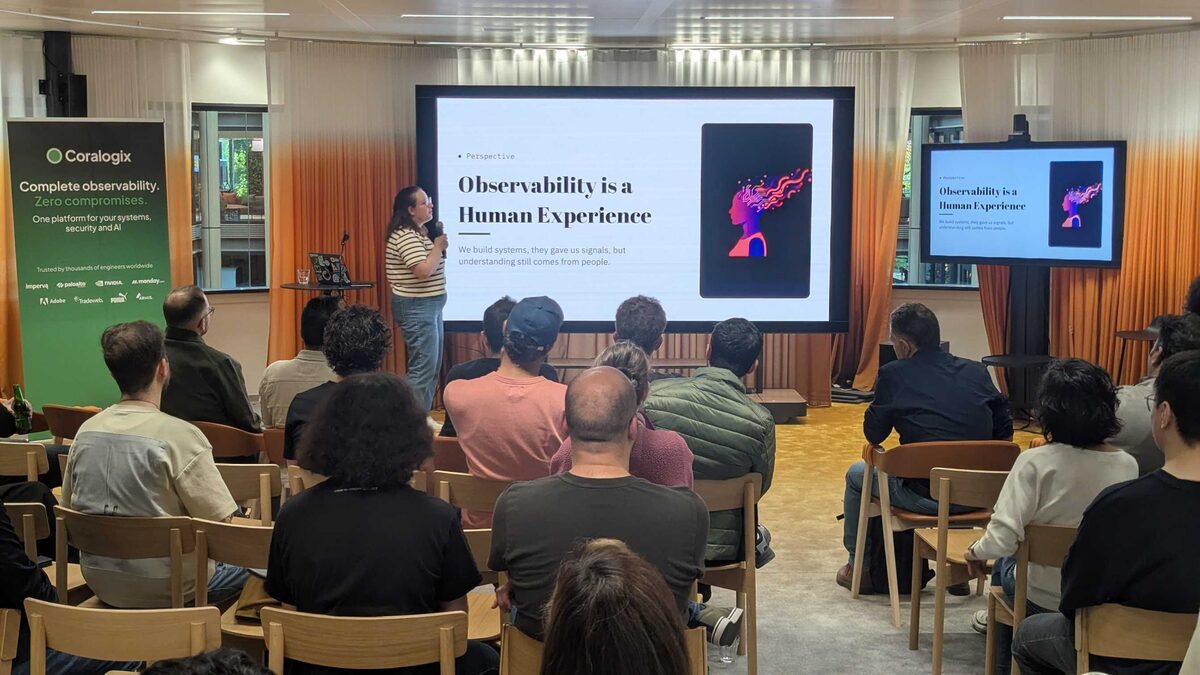
Observability is a Human Experience
Iris opened with a powerful perspective: “We build systems, they gave us signals, but understanding still comes from people.”

This is the core tension. With tools like OpenTelemetry, collecting logs, metrics, and traces is no longer the hard part. In practice, this is where things get messy: telemetry keeps growing, dashboards get stale, costs go up, and alerts do not really help you understand what is going on. The problem is not more data — it is making sense of it.
In most cases, understanding what is happening still takes too much effort: jumping between tools, writing queries (often in different languages), and manually connecting the dots.
LLMs Are Good, But We Are Better
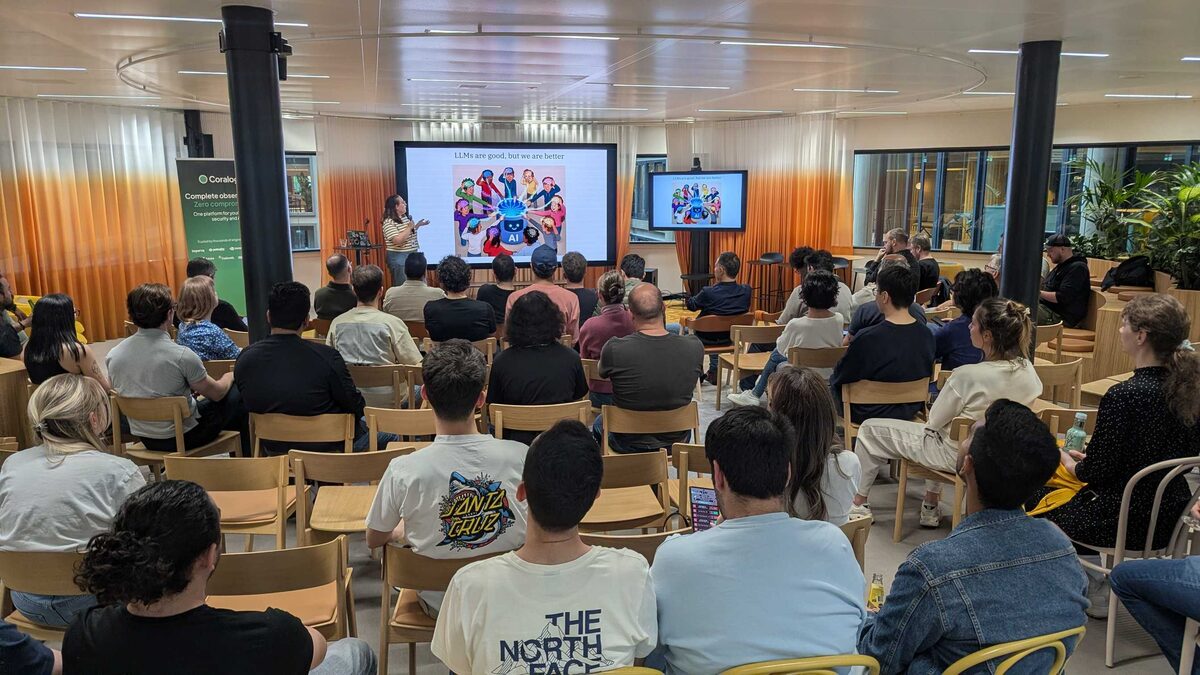
Iris made a clear distinction: AI is a partner for engineers working with observability, helping navigate telemetry data, correlate signals, and get to answers faster. Not magic — just something practical that fits into day-to-day work.
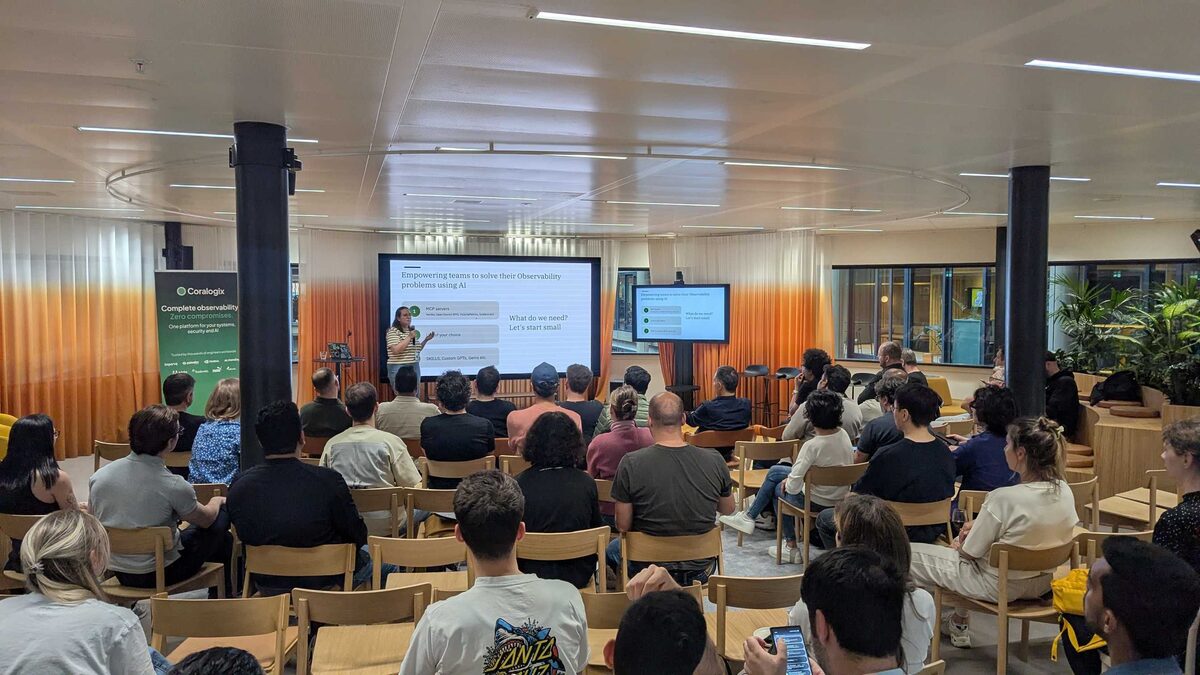
Empowering Teams to Solve Observability Problems Using AI
The practical framework Iris presented is refreshingly simple — “What do we need? Let’s start small”:
- MCP servers — Vendor, Open Source (BYO), VictoriaMetrics, Grafana, etc.
- LLM of your choice — bring whatever model works for your organization
- SKILLS, Custom GPTs, Gems, etc. — tailored AI capabilities for your specific problems
This layered approach means teams can start with existing infrastructure (their MCP-compatible observability backends), connect any LLM, and build domain-specific skills on top — no rip-and-replace required.
Creating Custom Skills for Every Problem
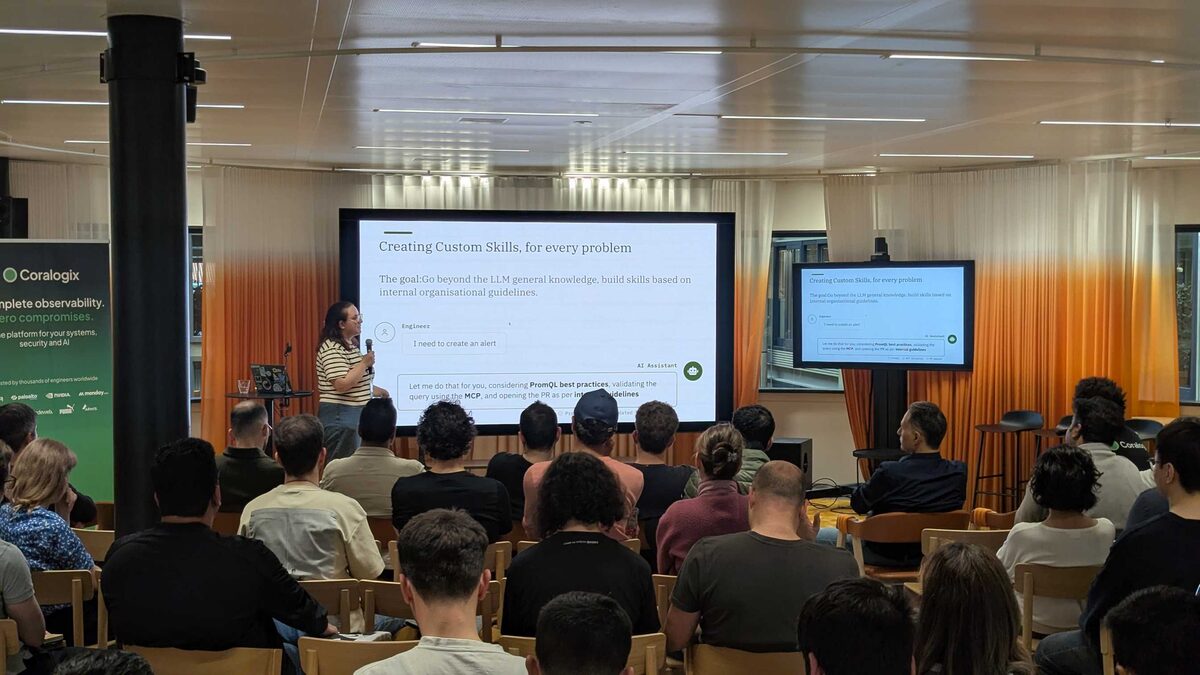
The goal: go beyond the LLM general knowledge, build skills based on internal organizational guidelines.
The example was perfect — an engineer says “I need to create an alert” and the AI Assistant responds: “Let me do that for you, considering PromQL best practices, validating the query using the MCP, and opening the PR as per internal guidelines.”
This is the difference between a generic chatbot and an AI that actually knows your stack: it validates queries against your MCP server, applies your team’s PromQL conventions, and follows your PR workflow — all in one interaction.
Repeat for Every Challenge
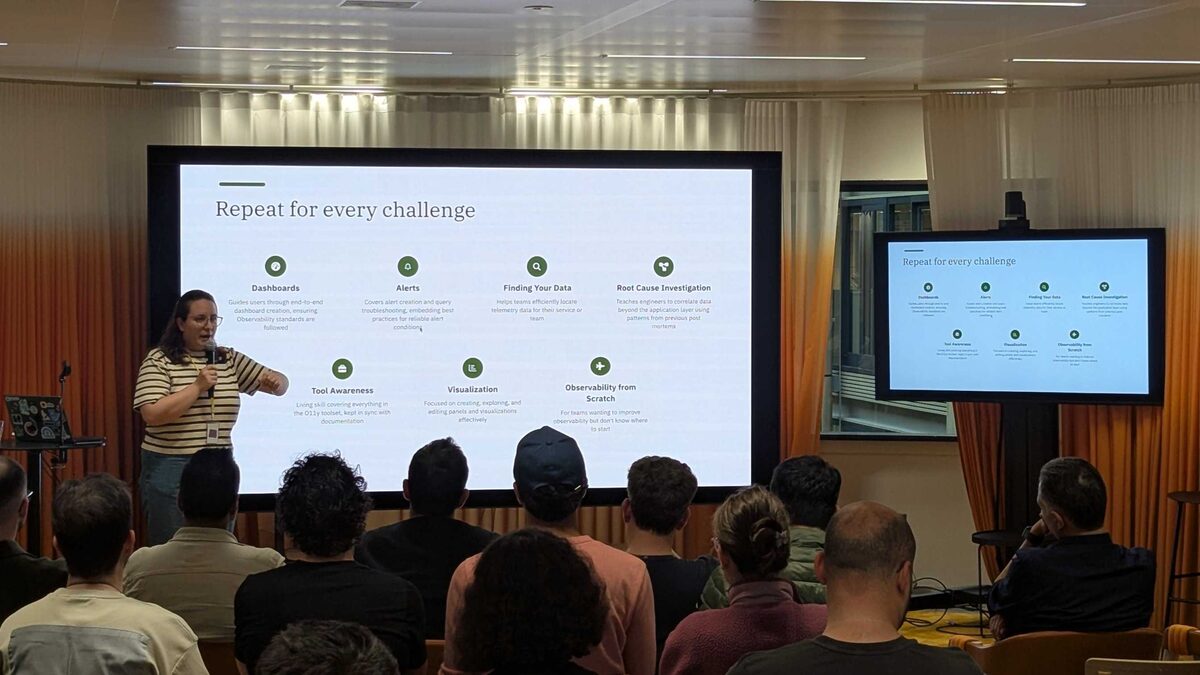
The framework scales across the entire observability lifecycle. Iris showed 7 skill categories that teams can build once and reuse:
- Dashboards — guides users through end-to-end dashboard creation, ensuring observability standards are followed
- Alerts — covers alert creation and query troubleshooting, embedding best practices for reliable alert conditions
- Finding Your Data — helps teams efficiently locate telemetry data for their service or team
- Root Cause Investigation — teaches engineers to correlate data beyond the application layer using patterns from previous post-mortems
- Tool Awareness — a living skill covering everything in the O11y toolset, kept in sync with documentation
- Visualization — focused on creating, exploring, and editing panels and visualizations effectively
- Observability from Scratch — for teams wanting to improve observability but do not know where to start
Each skill encodes organizational knowledge that would otherwise live in wikis nobody reads or in the heads of senior engineers who leave.
Headless Observability
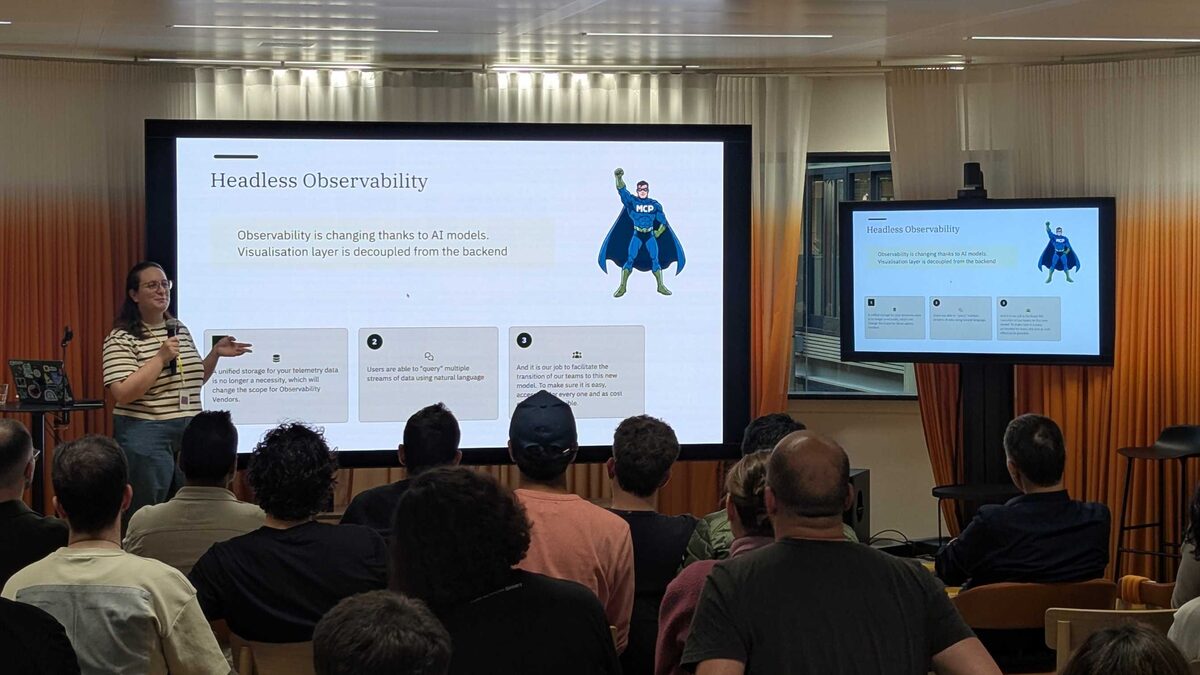
Iris introduced the concept of Headless Observability — the idea that observability is changing thanks to AI models, and the visualization layer is now decoupled from the backend:
- Unified storage for telemetry data is no longer a necessity — which will change the scope for observability vendors
- Users are able to “query” multiple streams of data using natural language — no more PromQL expertise required for every team member
- It is our job to facilitate the transition of our teams to this new model — to make sure it is easy, accessible for every one, and as cost-effective as possible
The MCP (Model Context Protocol) superhero illustration drove the point home: MCP servers become the bridge between your observability backends and AI models, enabling natural language access to telemetry without requiring a single unified data store.
The Basics Still Matter
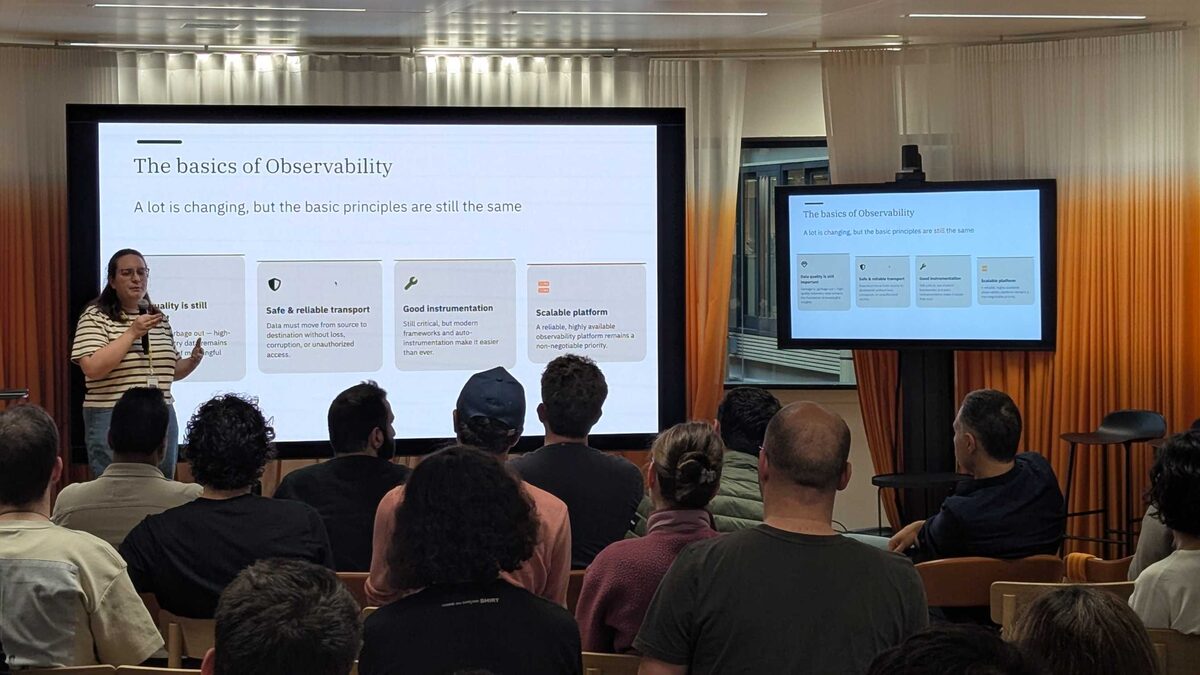
Even with AI transforming observability, Iris grounded the talk with a reminder: “A lot is changing, but the basic principles are still the same”:
- Data quality is still important — garbage out means high-quality telemetry data remains essential for meaningful insights
- Safe and reliable transport — data must move from source to destination without loss, corruption, or unauthorized access
- Good instrumentation — still critical, but modern frameworks and auto-instrumentation make it easier than ever
- Scalable platform — a reliable, highly available observability platform remains a non-negotiable priority
The message: AI augments observability, it does not replace its foundations.
A Useful Framework: Observability Team vs Developers
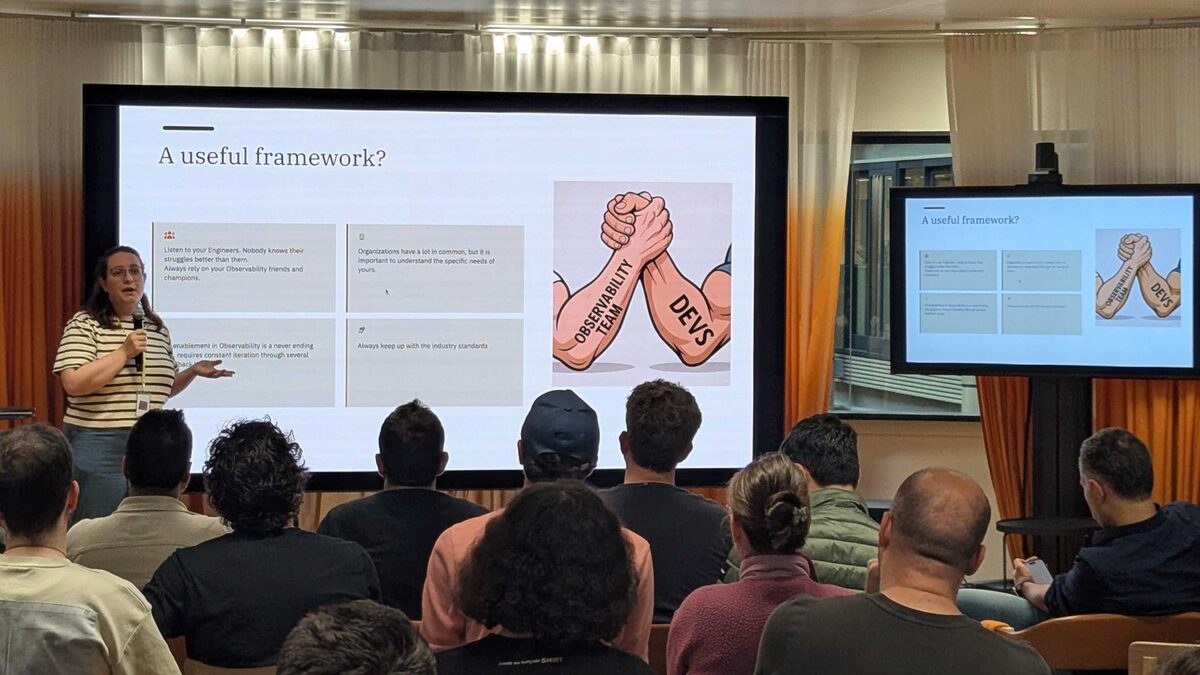
Iris closed with a framework for making observability enablement work in practice:
- Listen to your engineers — nobody knows their struggles better than them; always rely on your observability friends and champions
- Understand the specific needs of your organization — organizations have a lot in common, but the details matter
- Enablement is a never-ending process — requires constant iteration through several cycles
- Always keep up with the industry standards — the ecosystem moves fast
The arm-wrestling illustration between “Observability Team” and “Devs” perfectly captured the dynamic: the goal is not for one side to win, but for both to work together toward better outcomes.
Who’s Watching the Agents? Observability for AI-Assisted Development
Lewis Isaac — Developer Advocate at Coralogix (previously NS&I, IBM, BP) — presented the second talk, addressing a critical blind spot: code agents are reshaping how engineering teams write, review, and ship software, but most organizations adopting these tools are flying blind.
Chapter One: My First PR Review
Lewis opened with a story every engineer knows — the first pull request review. The rule his mentor taught him: “Never submit code you cannot explain.”
The example showed a session retry helper function — simple, readable, explainable. But what happens when AI generates code for you? Can you still explain every line? This sets up the central tension of the talk.
A Familiar Story: Observability Always Follows Complexity
Lewis drew a historical parallel:
- The moment systems became distributed → we needed distributed tracing
- The moment infrastructure became dynamic → we needed better metrics and logs
- The moment user experience became critical → we needed RUM
The pattern is clear: every time complexity increases, observability must follow. AI agents are the next complexity frontier.
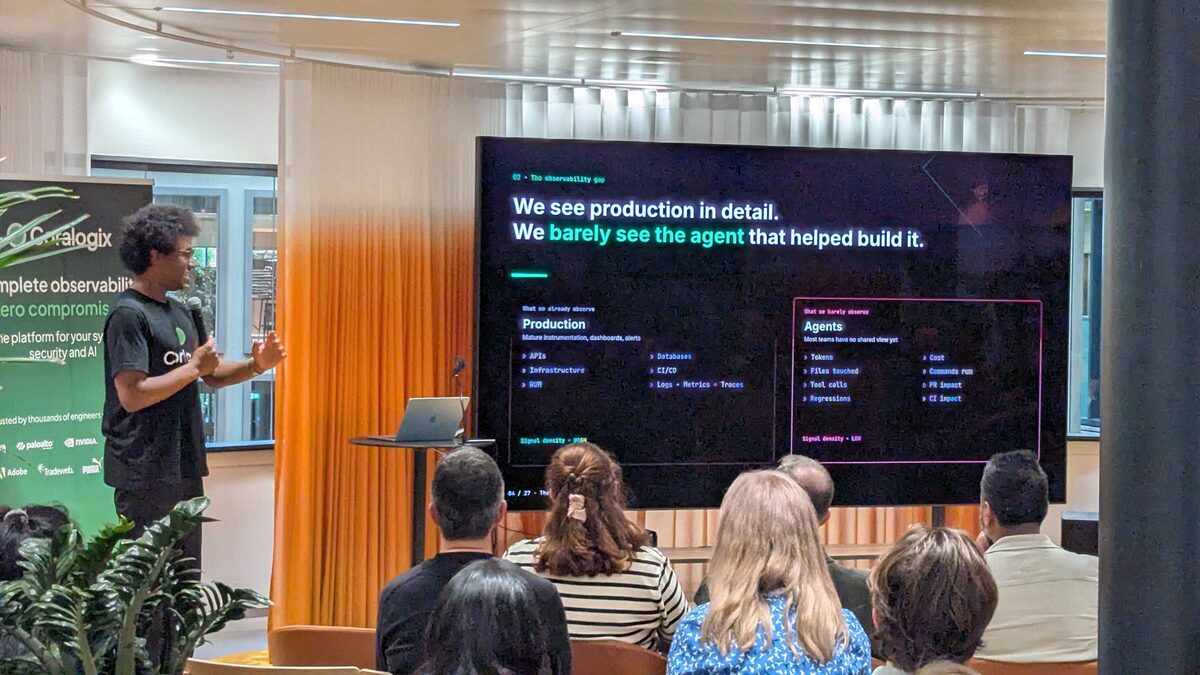
The Observability Gap
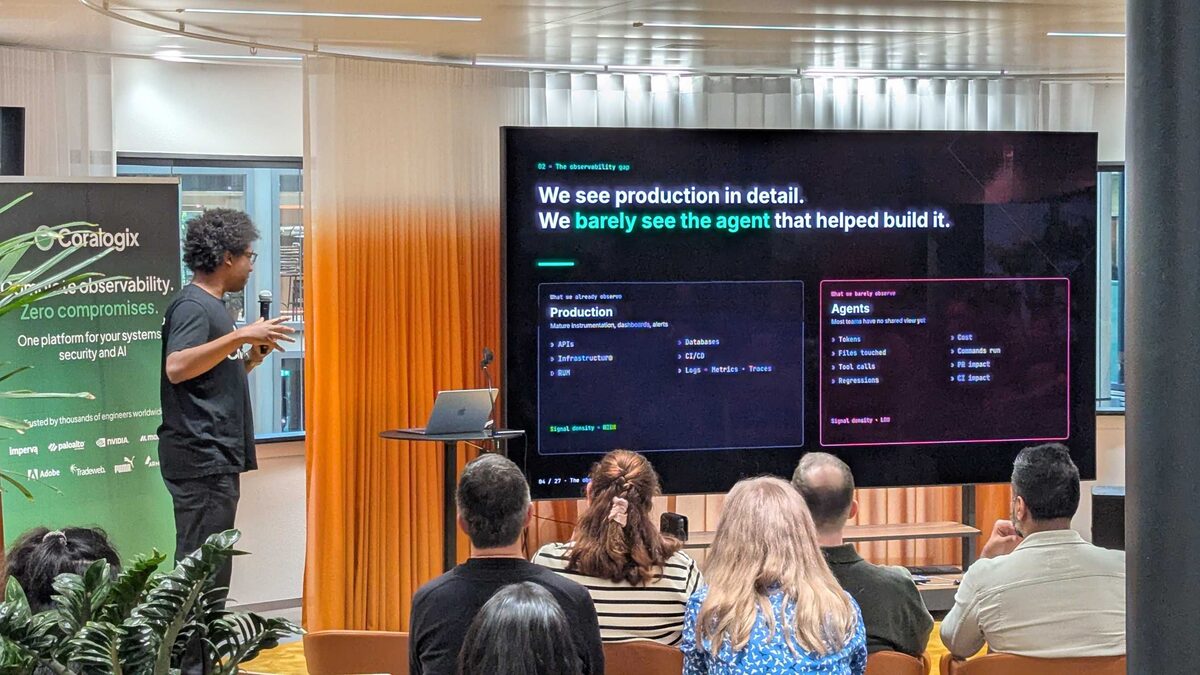
The core insight: “We see production in detail. We barely see the agent that helped build it.”
What we already observe in Production (signal density: HIGH):
- APIs, Infrastructure, RUM
- Databases, CI/CD
- Logs + Metrics + Traces
What we barely observe about Agents (signal density: LOW):
- Tokens, Files touched, Tool calls, Regressions
- Cost, Commands run, PR Impact, CI Impact
Most teams have no shared view yet of what their AI agents are actually doing.
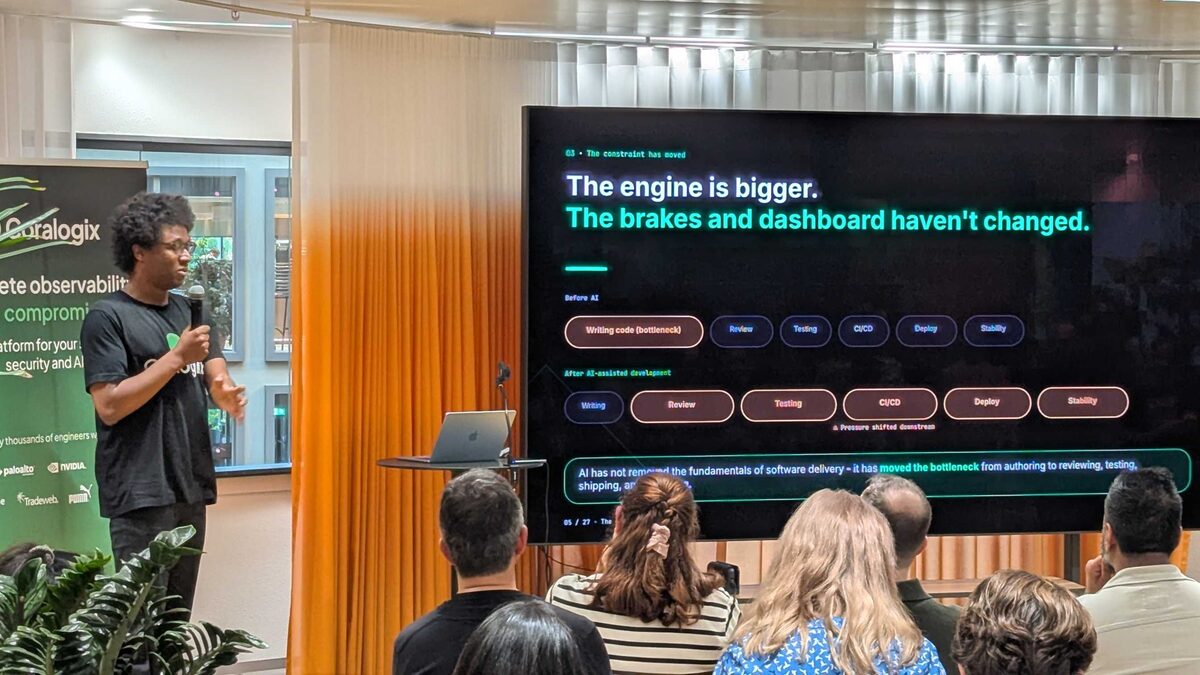
The Constraint Has Moved
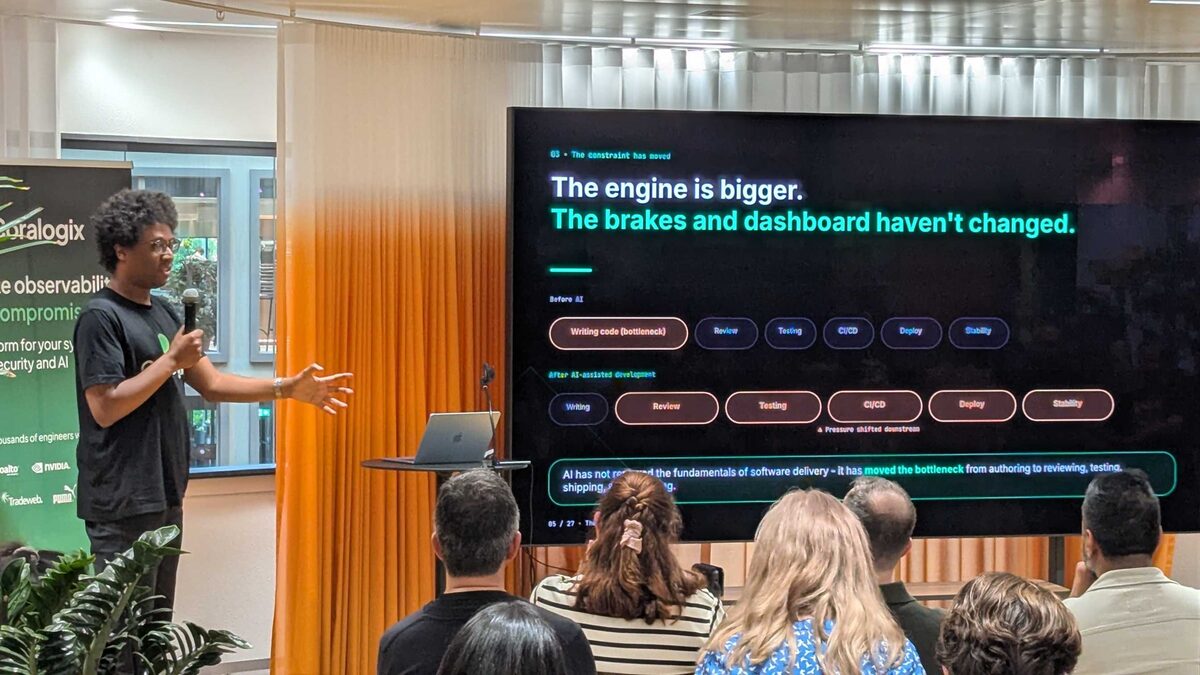
Lewis’s most powerful slide: “The engine is bigger. The brakes and dashboard haven’t changed.”
Before AI: Writing code was the bottleneck → Review → Testing → CI/CD → Deploy → Stability
After AI-assisted development: Writing shrinks dramatically, but the pressure shifts downstream to Review, Testing, CI/CD, Deploy, and Stability.
“AI has not removed the fundamentals of software delivery — it has moved the bottleneck from authoring to reviewing, testing, shipping, and stability.”
Five Questions Every Team Needs to Answer
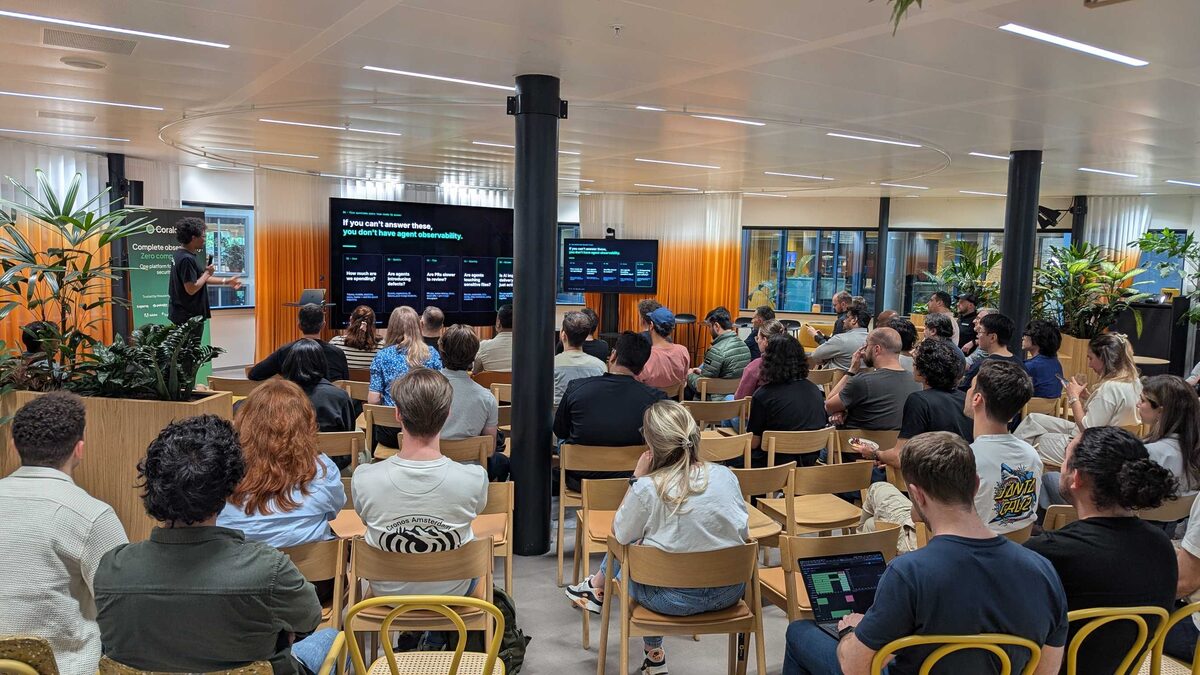
Lewis distilled agent observability into five essential questions: “If you can’t answer these, you don’t have agent observability.”
- Cost — How much are we spending? (Tokens, models, sessions, repos, teams — and the spend trajectory)
- Quality — Are agents introducing defects? (Reverts, regressions, CI failures, post-merge incidents)
- Flow — Are PRs slower to review? (PR size, review latency, churn, hand-offs — pre-merge throughput)
- Security — Are agents touching sensitive files? (Secrets, credentials, infra config, risky commands, policy violations)
- Outcome — Is AI improving delivery — or just activity? (The one question that ties cost, quality, flow, and security together)
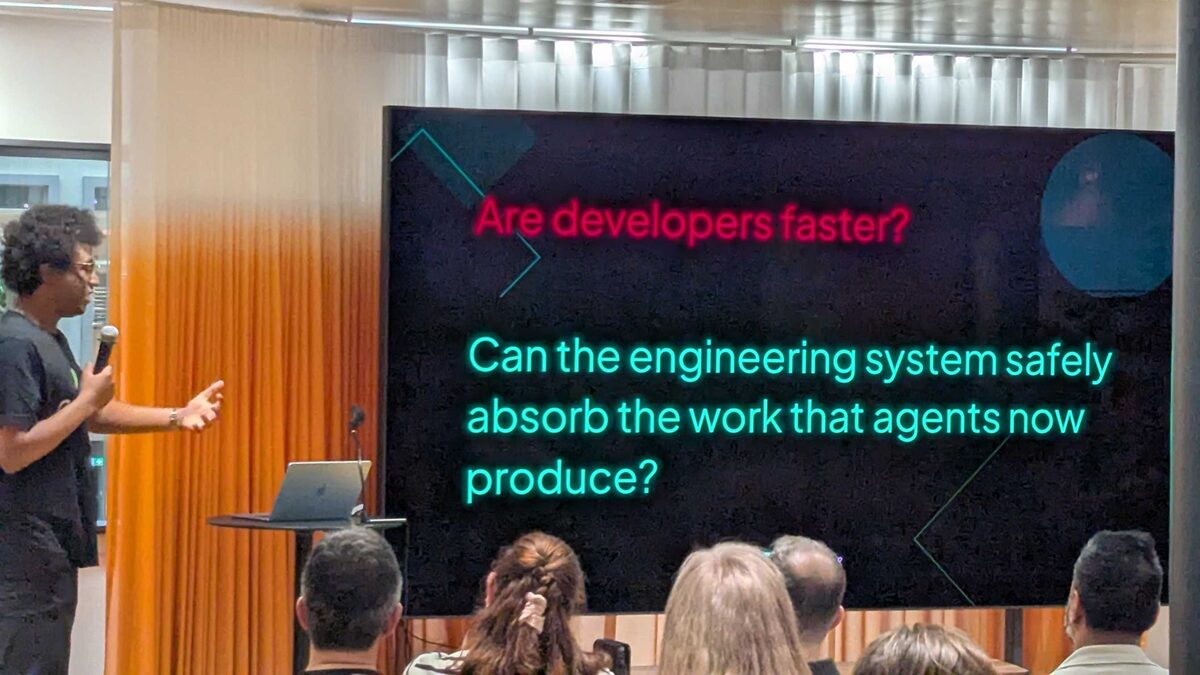
The Real Question
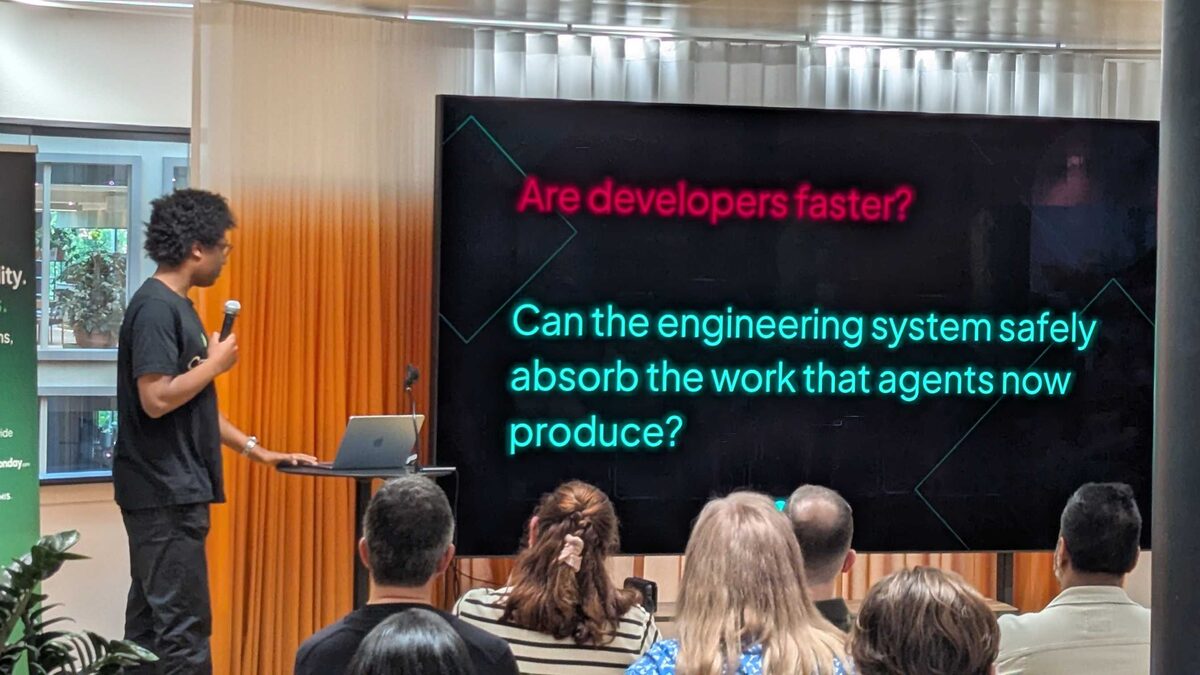
Lewis reframed the productivity debate: the question is not “Are developers faster?” — it is “Can the engineering system safely absorb the work that agents now produce?”
This shift from individual speed to system capacity is what separates teams that successfully adopt AI from those that accumulate technical debt faster than before.
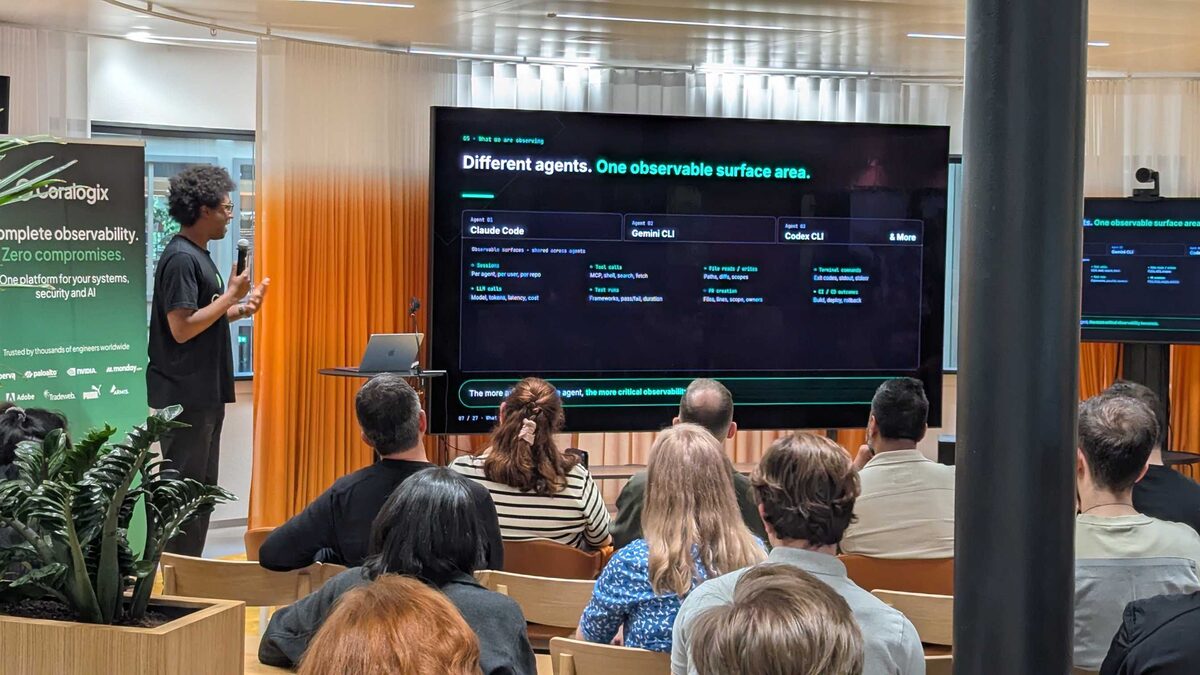
Different Agents, One Observable Surface Area
Lewis showed that regardless of which agent you use — Claude Code, Gemini CLI, Codex CLI, or custom agents — the observable surfaces are shared: sessions, LLM calls (model, tokens, latency, cost), tool calls (framework, pass/fail, duration), file reads/writes (paths, diffs, scopes), PR creation (files, lines, scope, owners), terminal commands (exit codes, stderr, stdin), and CI/CD outcomes (build, deploy, rollback).
“The more autonomous the agent, the more critical observability becomes.”
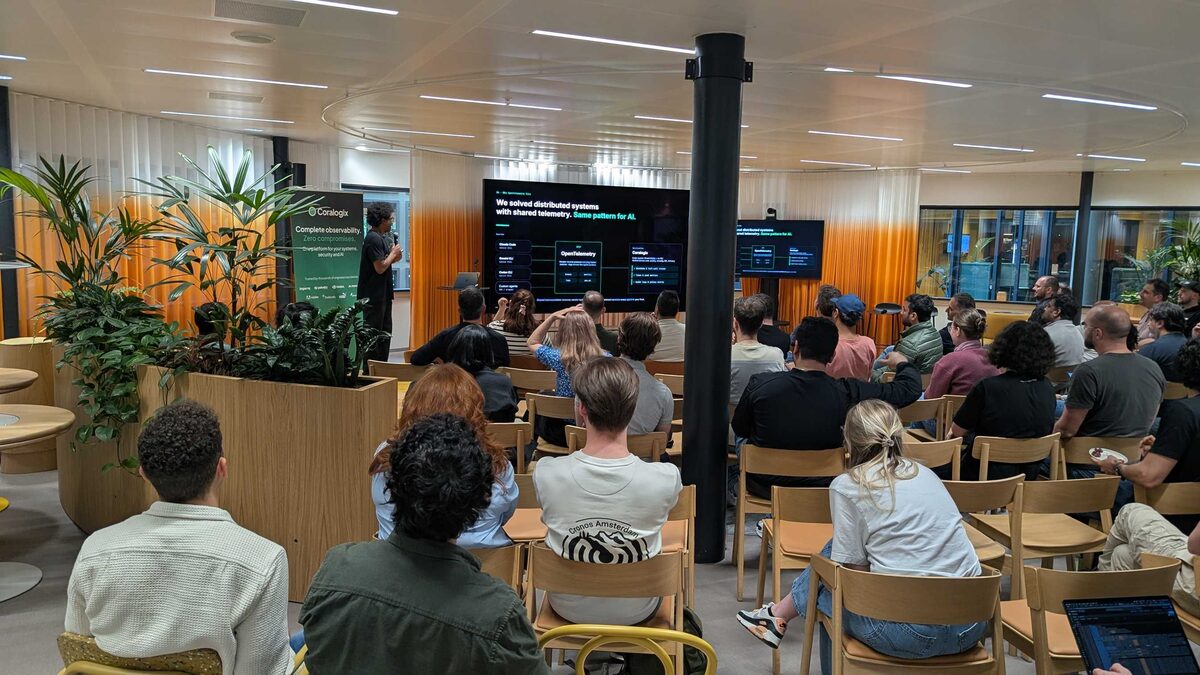
OpenTelemetry: The Same Pattern That Solved Distributed Systems
The architecture is elegant: “We solved distributed systems with shared telemetry. Same pattern for AI.”
Sources → OTLP → OpenTelemetry → Destination:
- Claude Code (native OTel), Gemini CLI (native OTel), Codex CLI (native OTel), Custom agents (SDK/wrapper)
- OpenTelemetry: vendor-neutral protocol carrying traces, metrics, logs across the agent surface (traces, metrics, logs, gen_ai)
- Coralogix: Code Agents Observability + AI CLI — unified across cost, quality, security, DX, delivery (sessions and tool-call traces, token and cost metrics, audit logs and policy alerts)
Shared instrumentation removes vendor lock-in — and lets one backend correlate every agent in your fleet.
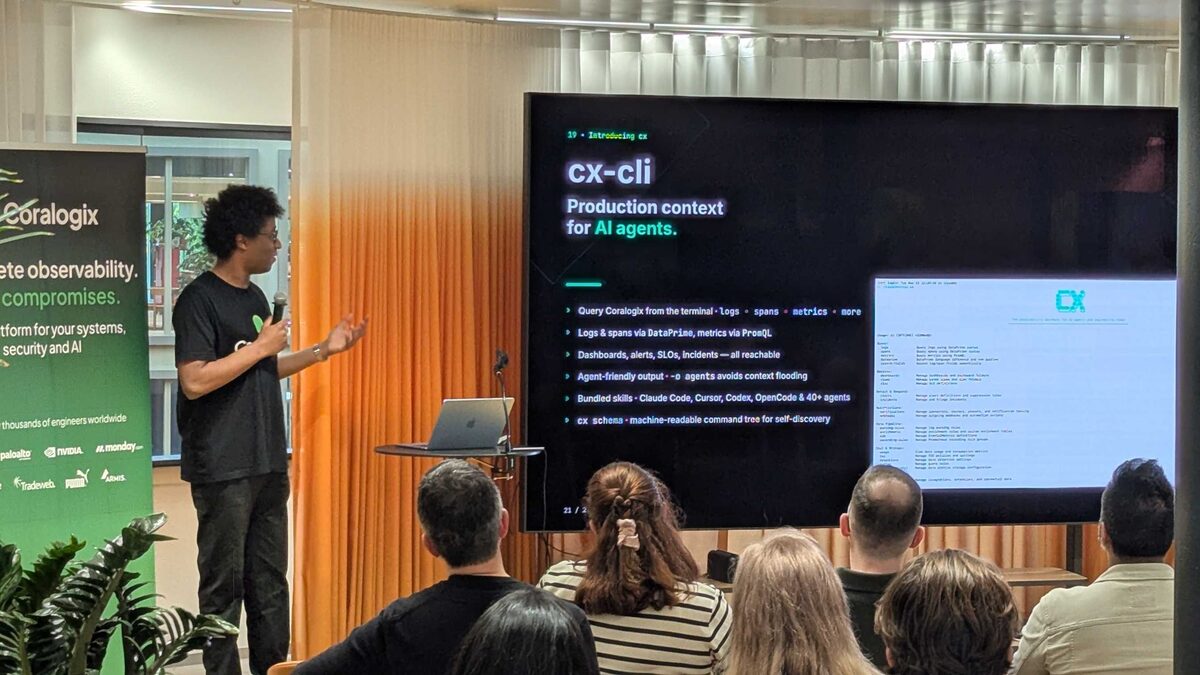
Introducing cx-cli: Production Context for AI Agents
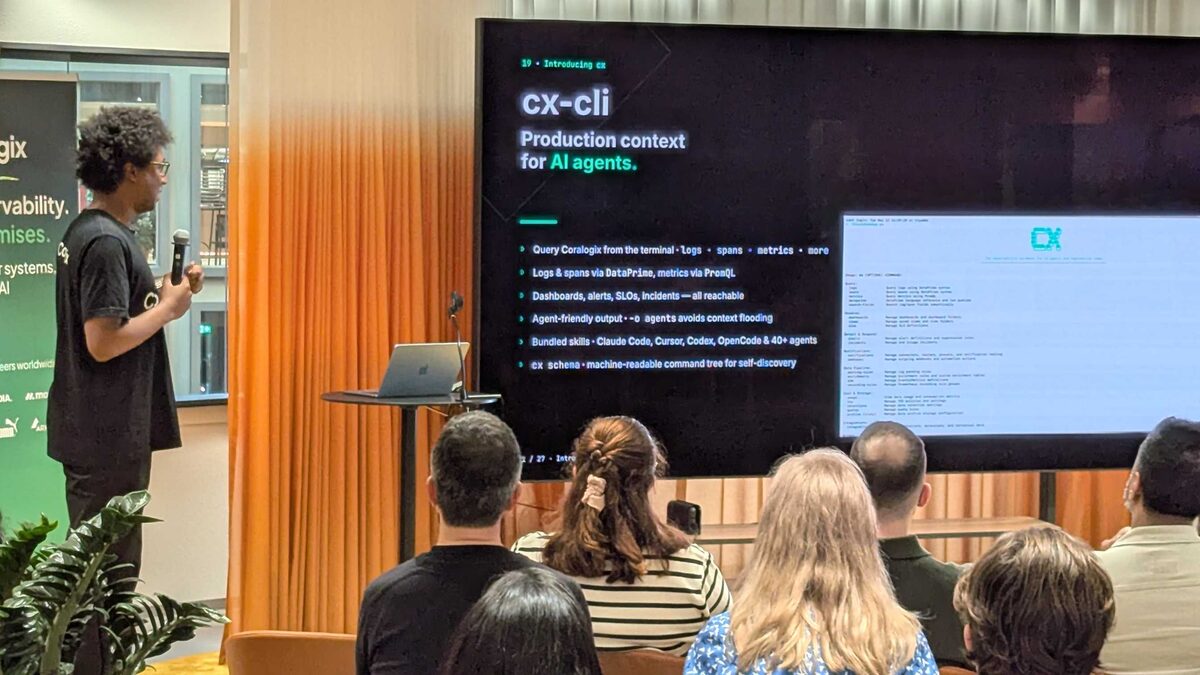
Lewis closed with a product announcement: cx-cli — a CLI tool that gives AI agents direct access to production context:
- Query Coralogix from the terminal: logs + spans + metrics + more
- Logs and spans via DataPrime, metrics via PromQL
- Dashboards, alerts, SLOs, incidents — all reachable
- Agent-friendly output (
-o) avoids context flooding - Bundled skills for Claude Code, Cursor, Codex, OpenCode and 40+ agents
cx schema— machine-readable command tree for self-discovery
This closes the loop: first observe what agents do, then empower them with the production data they need to make better decisions.
Live Demo: cx-cli in Action
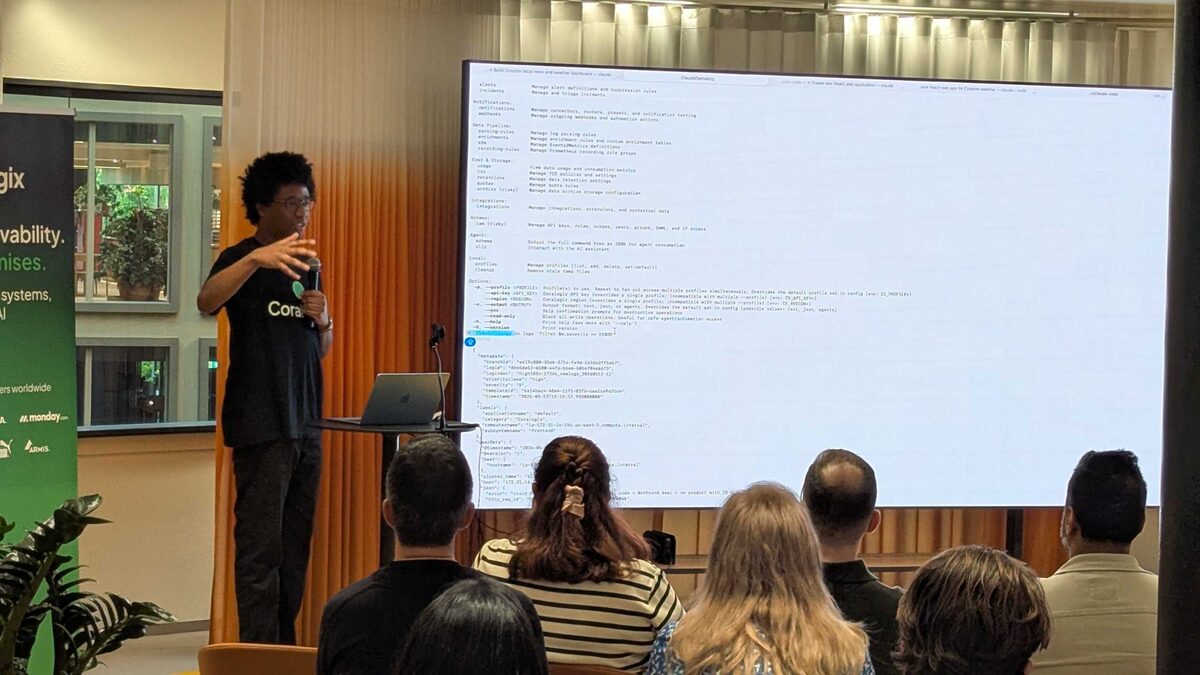
Lewis showed a live demo with the cx-cli command tree — the full Coralogix API surface exposed as a CLI: alerts, incidents, notifications, webhooks, parsing-rules, enrichments, SLOs, quotas, archive, integrations, access management, profiles, and cleanup. He then demonstrated querying real Kubernetes pod logs with structured JSON output showing request IDs, session contexts, deployment metadata, and error messages.
Six Things to Take Back to Your Team
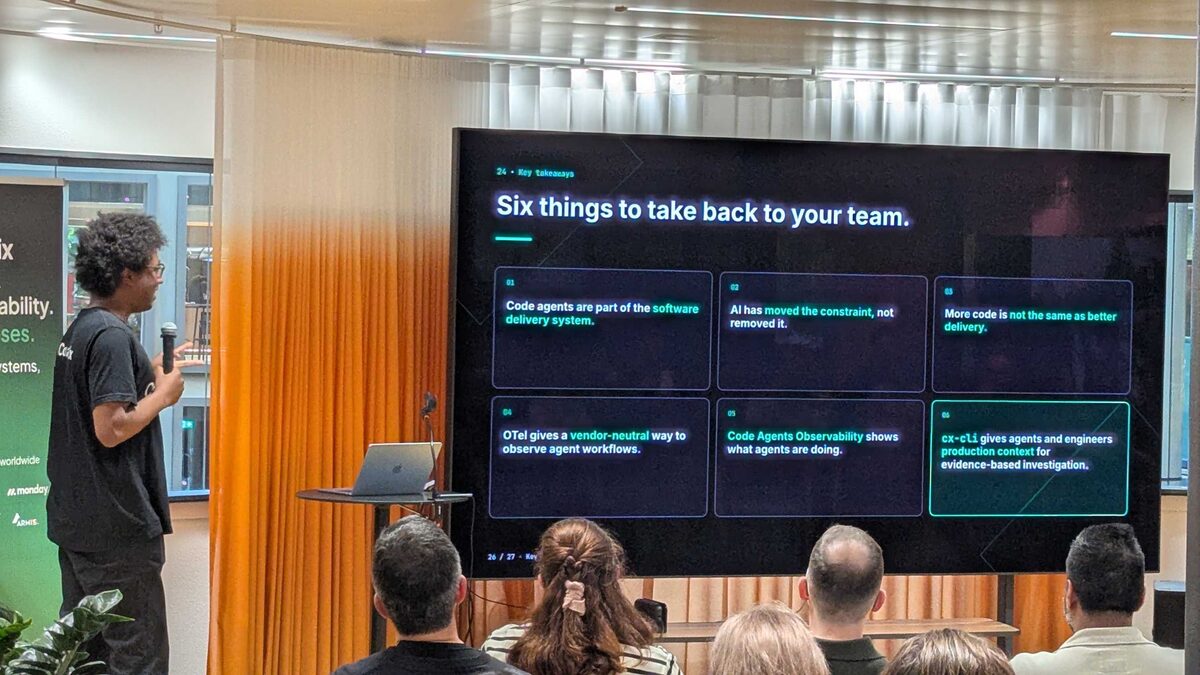
Lewis closed with six actionable takeaways:
- Code agents are part of the software delivery system
- AI has moved the constraint, not removed it
- More code is not the same as better delivery
- OTel gives a vendor-neutral way to observe agent workflows
- Code Agents Observability shows what agents are doing
- cx-cli gives agents and engineers production context for evidence-based investigation
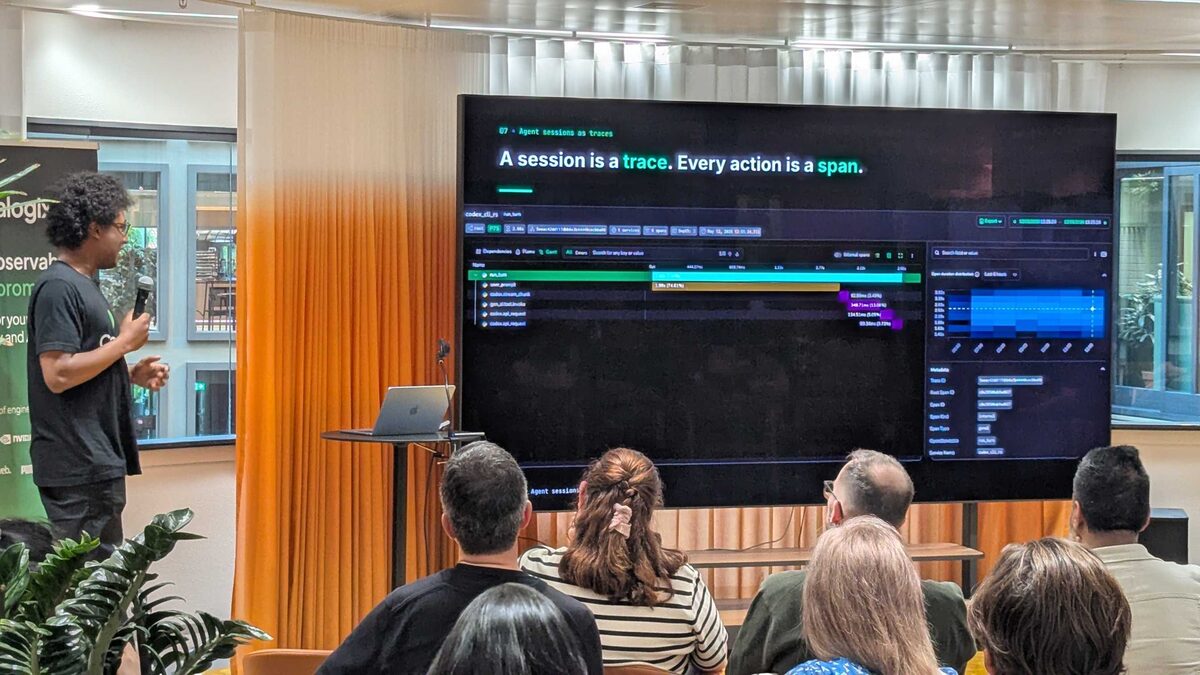
Agent Sessions as Traces
“A session is a trace. Every action is a span.” Lewis showed a live Coralogix trace waterfall from a Codex CLI session — each agent action (user_prompt, open_github_issue, create_sql_request) appears as a span with duration, allowing you to see exactly what the agent did, how long each step took, and where failures occurred.
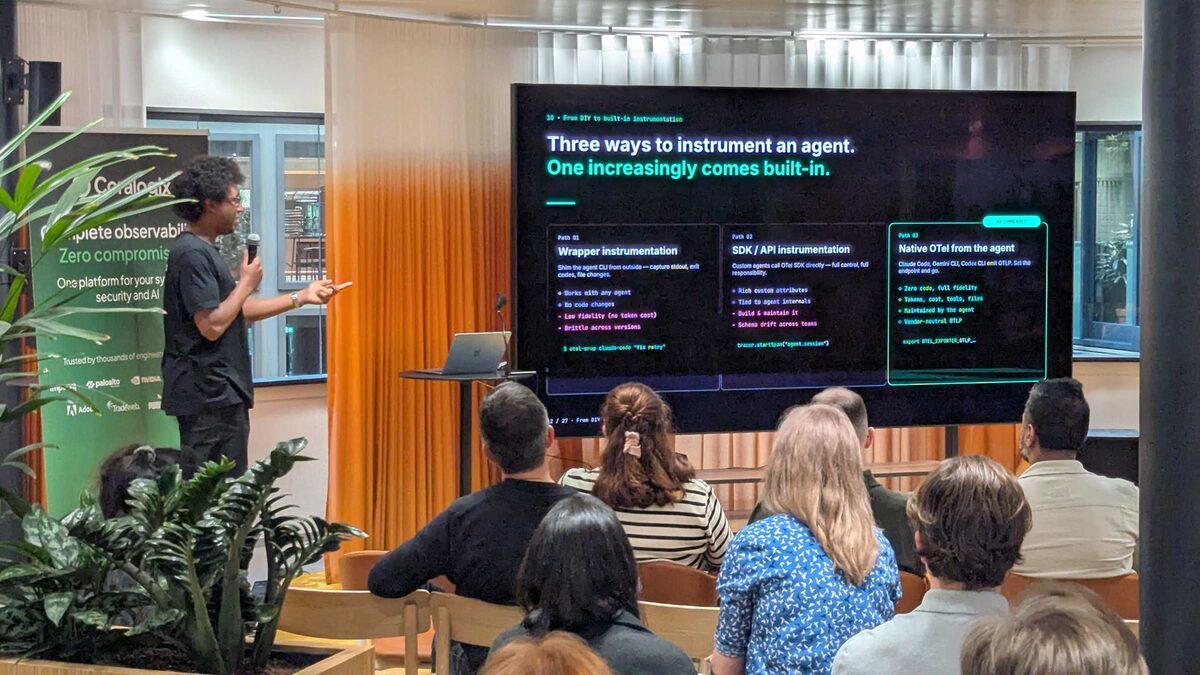
Three Ways to Instrument an Agent
Lewis presented the instrumentation spectrum:
- Path 1: Wrapper instrumentation — shim the agent CLI from outside, capture stdin/stdout, exit codes, file changes. Works with any agent, no code changes, but low fidelity (no token cost) and brittle across versions
- Path 2: SDK/API instrumentation — custom agents call OTel SDK directly with full control. Rich custom attributes, but tied to agent internals, requires building and maintaining, schema drift across teams
- Path 3: Native OTel from the agent — Claude Code, Gemini CLI, Codex CLI emit OTLP. Zero code, full fidelity, tokens/cost/tools/files maintained by the agent, vendor-neutral OTLP
The trend is clear: native OTel is winning. export OTEL_EXPORTER_OTLP_... and you are done.
Logs as the Audit Trail
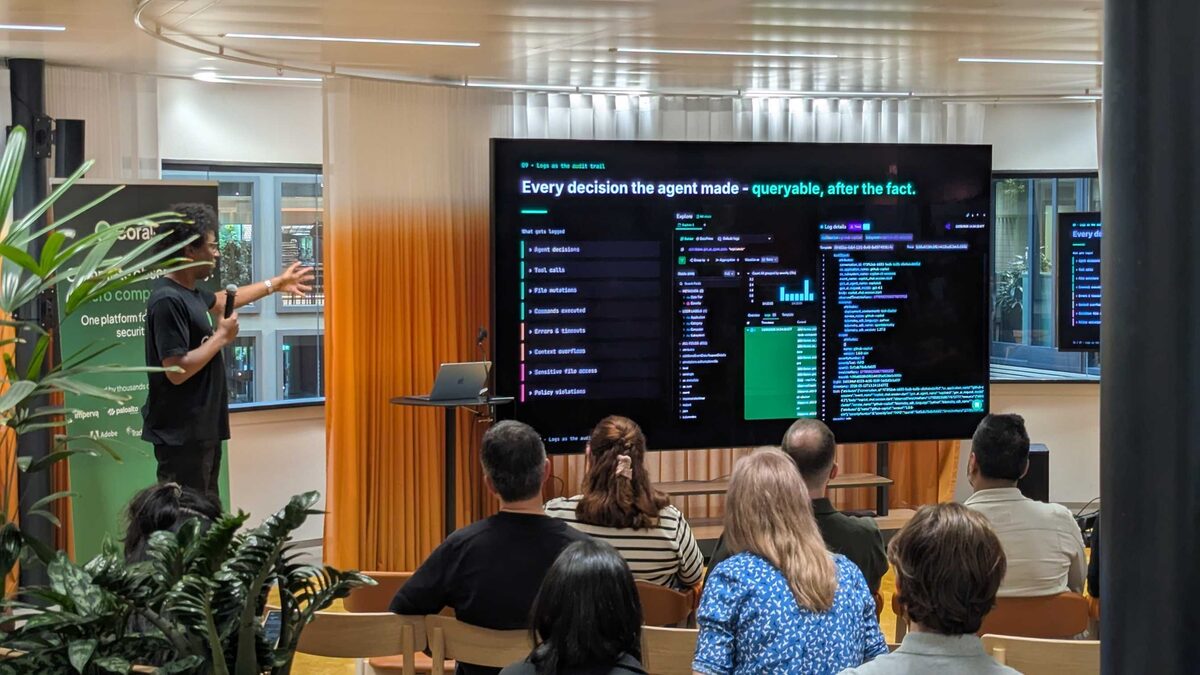
“Every decision the agent made — queryable, after the fact.” What gets logged:
- Agent decisions
- Tool calls
- File mutations
- Commands executed
- Errors and timeouts
- Context overflows
- Sensitive file access
- Policy violations
The Coralogix log explorer showed real agent audit data — complete with bar charts, log detail panels, and structured JSON payloads. This is the forensic layer that answers “what did the agent do and why?” when something goes wrong.
Two Halves of the Loop
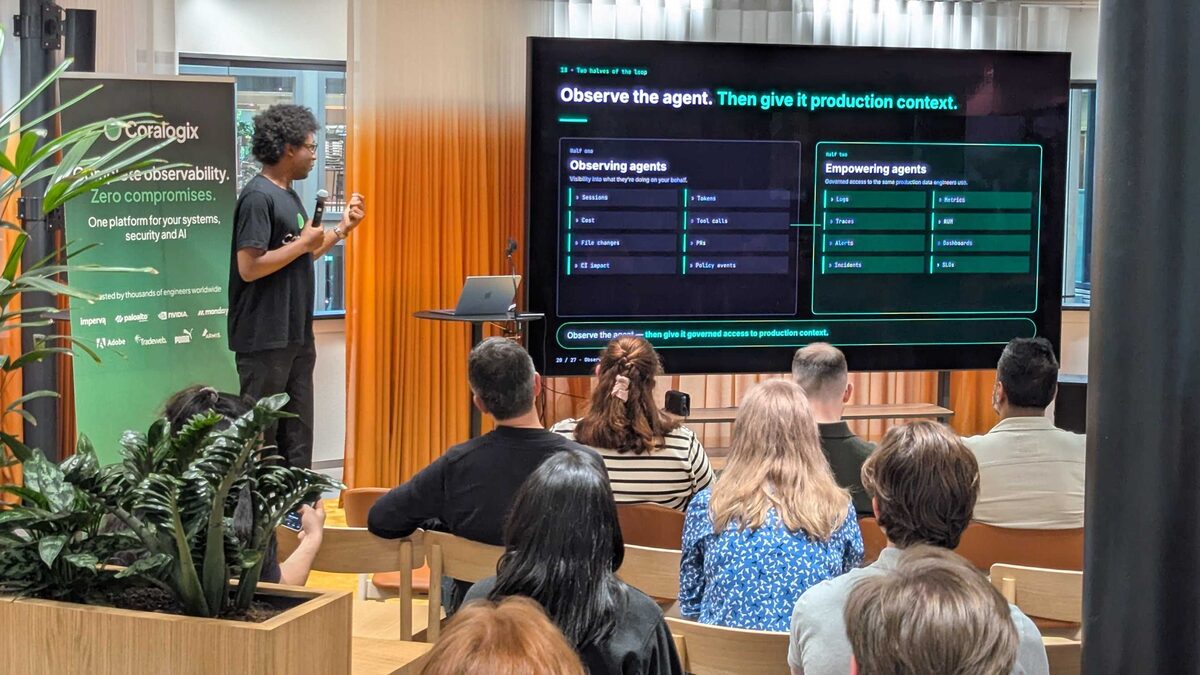
“Observe the agent. Then give it production context.” Lewis presented the full vision as two halves:
Half one — Observing agents (visibility into what they are doing on your behalf): Sessions, Tokens, Cost, Tool calls, File changes, PRs, CI Impact, Policy events
Half two — Empowering agents (governed access to the same production data engineers use): Logs, Metrics, Traces, RUM, Alerts, Dashboards, Incidents, SLOs
“Observe the agent — then give it governed access to production context.”
Schema Governance with OTel Weaver
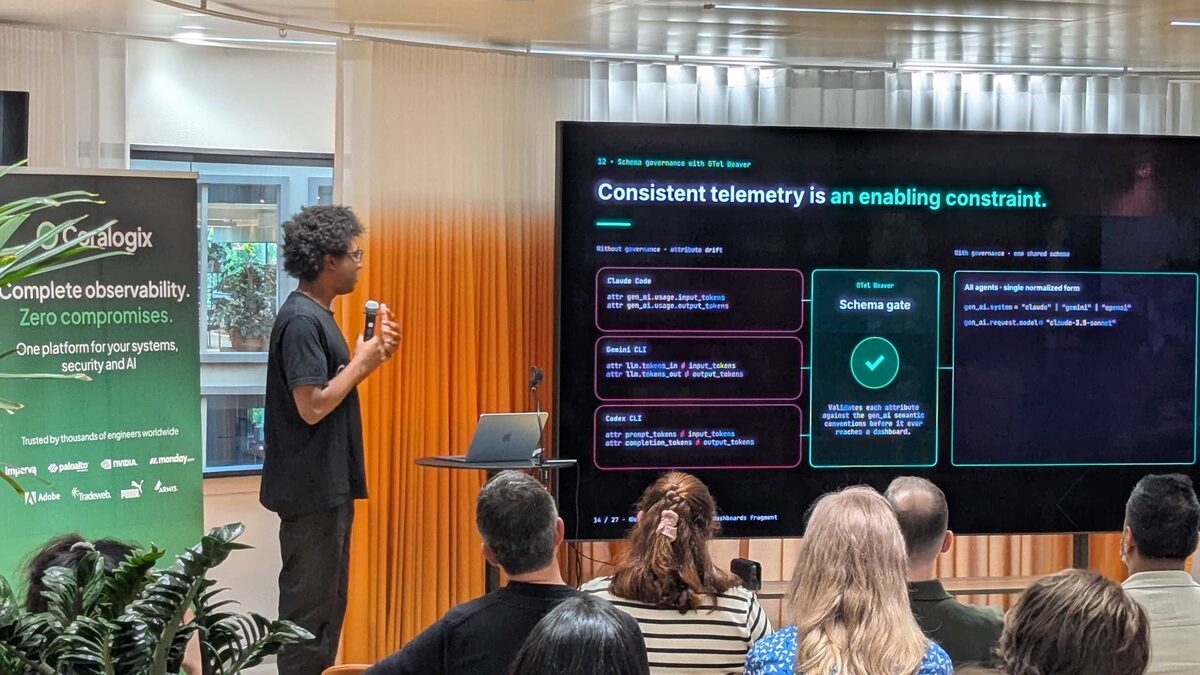
“Consistent telemetry is an enabling constraint.” The problem: without governance, every agent uses different attribute names:
- Claude Code:
gen_ai.usage.input_tokens/gen_ai.usage.output_tokens - Gemini CLI:
llm.tokens_in/input_tokens/llm.tokens_out/output_tokens - Codex CLI:
prompt_tokens/input_tokens/completion_tokens/output_tokens
The solution: an OTel Weaver Schema gate that validates each attribute against the gen_ai semantic conventions before it ever reaches a dashboard — normalizing to a single form: gen_ai.system = "claude" | "google" | "openai" and gen_ai.request.model = "claude-3.5-sonnet".
The key problems he identified:
- No visibility into token consumption and cost — teams cannot budget or forecast AI spend
- No tracking of which files are being touched by AI agents — security and compliance gaps
- No measurement of how long tasks actually take — impossible to prove ROI
- No detection of whether agent activity is introducing regressions into CI/CD pipelines
As organizations scale AI-assisted development from individual experiments to team-wide adoption, observability of the AI layer itself becomes critical infrastructure.
Panel Discussion
The evening concluded with a panel featuring:
- Lewis Isaac (Coralogix) — AI observability and cost visibility
- Iris Dyrmishi (Miro) — practical AI-powered observability workflows
- Wilco Burggraaf (Hightech Innovators) — innovation and engineering leadership
- Ehsan Khodadadi (ING) — enterprise-scale observability challenges
The discussion explored the intersection of traditional SRE practices with the new reality of AI agents in production — from monitoring LLM-powered features to ensuring AI-assisted code does not silently degrade system reliability.
CNCF Merge Forward
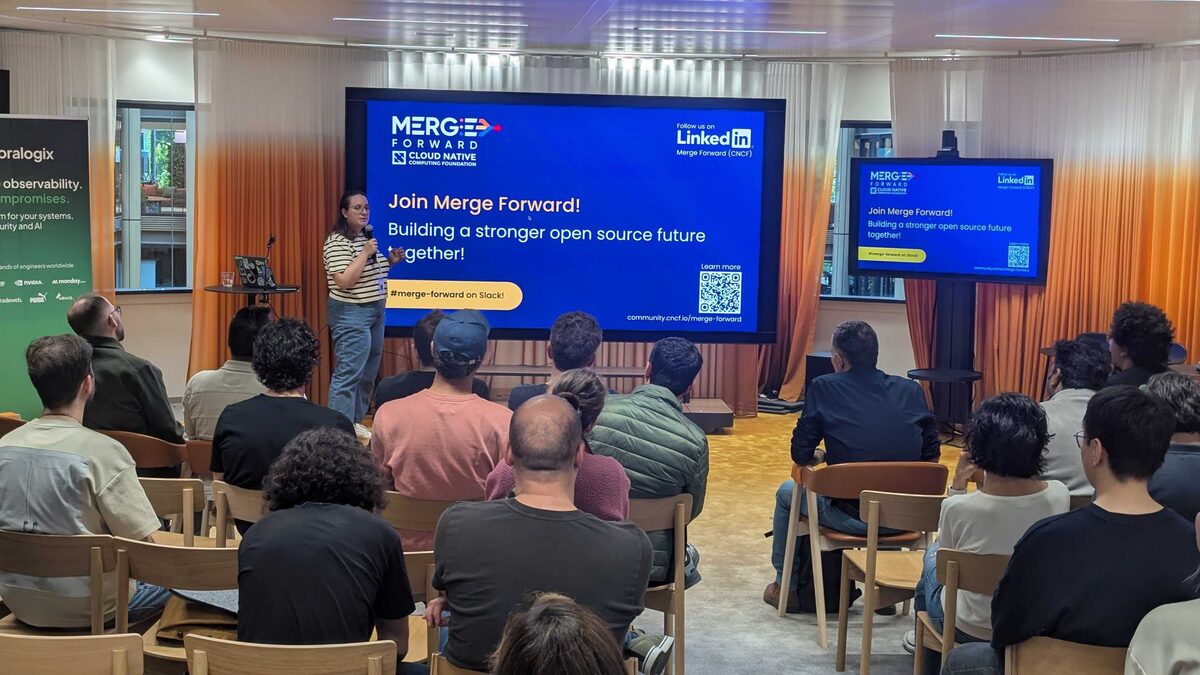
The event also featured a community announcement about CNCF Merge Forward — a new initiative building a stronger open source future together. The community can join via #merge-forward on Slack and at community.cncf.io/merge-forward.
Networking
Great catching up with Wilco Burggraaf — the event wrapped up with drinks, pizza, and conversations at Miro’s impressive Amsterdam office.
Key Takeaways
- Observability is fundamentally human — AI helps navigate signals faster, but understanding still requires people
- Start small with MCP + LLM + Skills — you do not need to replace your stack, just augment it
- Custom skills beat generic AI — encoding organizational knowledge (PromQL conventions, PR workflows, internal guidelines) is where real value lives
- AI agents need observability too — token costs, file access patterns, and CI/CD regression detection are the new observability requirements
- The SRE role is evolving — from monitoring systems to monitoring both systems AND the AI that helps you monitor systems
Event Details
- Event: Who’s Watching the Agents?
- Organizers: SRE NL + Coralogix
- Venue: Miro Amsterdam office
- Date: May 21, 2026
- Sponsors: Coralogix, NVIDIA, Palo Alto Networks, monday.com, Imperva, Trademarks, Adobe, Davos