On Tuesday 17 February 2026 I went to “What Your Dashboards and Your Brain Won’t Tell You”, a Site Reliability Engineering NL (SRE NL) meetup at the Elastic office on Keizersgracht 281 in Amsterdam. The invitation promised two things: how to actually see what is happening in your systems, and how your own brain can sabotage your reliability efforts. The two talks covered exactly that, in that order.
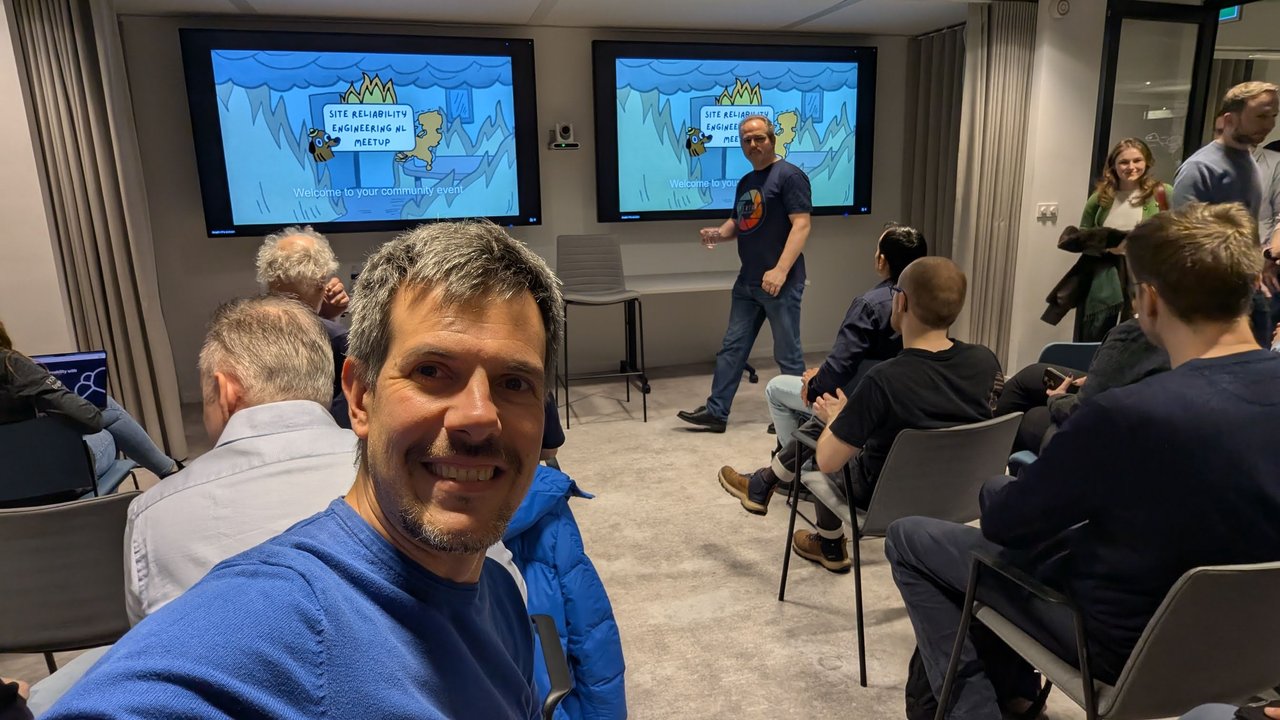
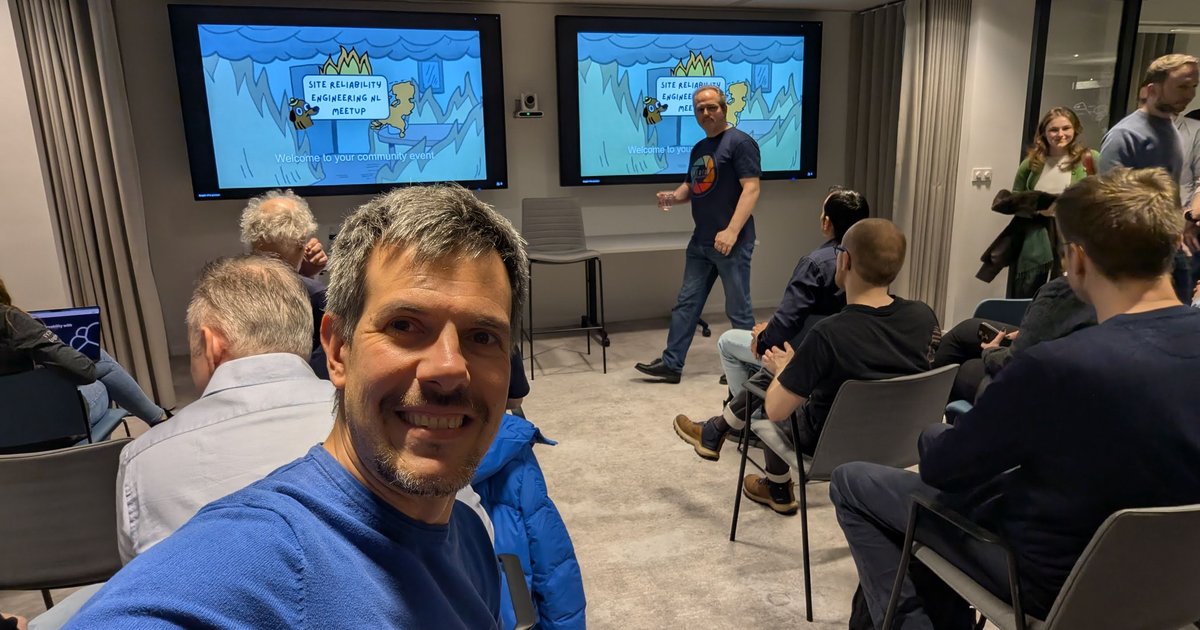
“Welcome to your community event”: the SRE NL opening slide, with the “this is fine” dog in a burning room.
Community news first
The Luma listing named Arash Haghighat and Balázs Nagy as hosts. The opening slides covered the usual housekeeping, plus a few changes:
- The organisers: a slide titled “And this is us, the organizers behind the events” showed six organisers, with Booking.com, bol., ING and Xebia logos under their photos.
- SRE NL has moved to Luma. Scheduling, communication and registration now happen on luma.com/srenl. Events will still appear on Meetup “just as an FYI”.
- Next event: hosted by Booking.com on 23 March, with registration opening at the end of that week. That became Signal Overflow during KubeCon week, which I wrote up in my KubeCon co-located day post.
- Contribute: talk to the organisers, find past slides at sre-nl.github.io/slides, and submit a topic to present.
Guide to Observability with OpenTelemetry (Elastic)
The first talk, according to the event listing, was Guide to Observability with OpenTelemetry by Evelien Schellekens of Elastic. Her name was also on the screen-share label. The abstract promised an explanation of how OpenTelemetry works, using the OpenTelemetry Demo Application running on Azure, and a live demo in Elastic.
In the live demo, the screens showed the Elastic APM view of a service, with a failed transaction latency distribution chart and a failed transaction correlations tab. My take: that is the right place to start an investigation. Look at the failed requests first, then ask what they have in common.
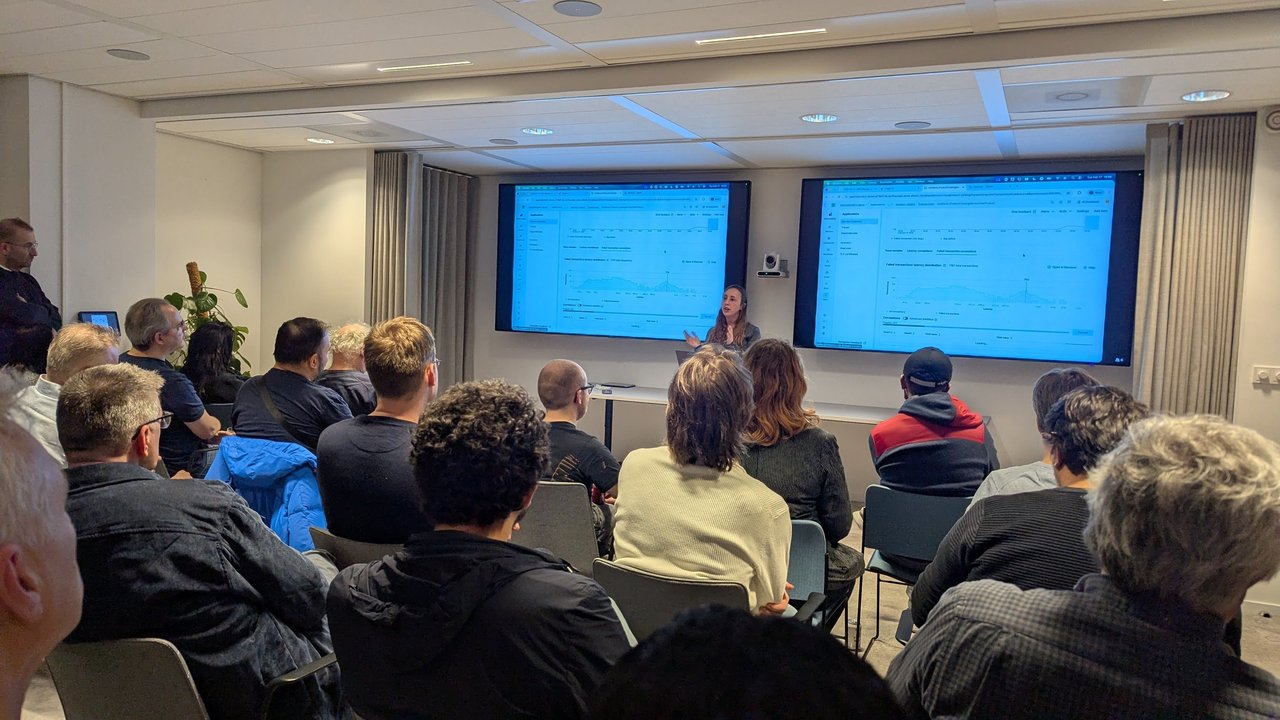
The live demo: failed transaction latency and correlations in Elastic Observability.
A “Want to try yourself?” slide pointed to the hosted demo at otel.demo.elastic.co and the elastic/opentelemetry-demo repository, a fork set up as “OpenTelemetry Demo with Elastic Observability”.
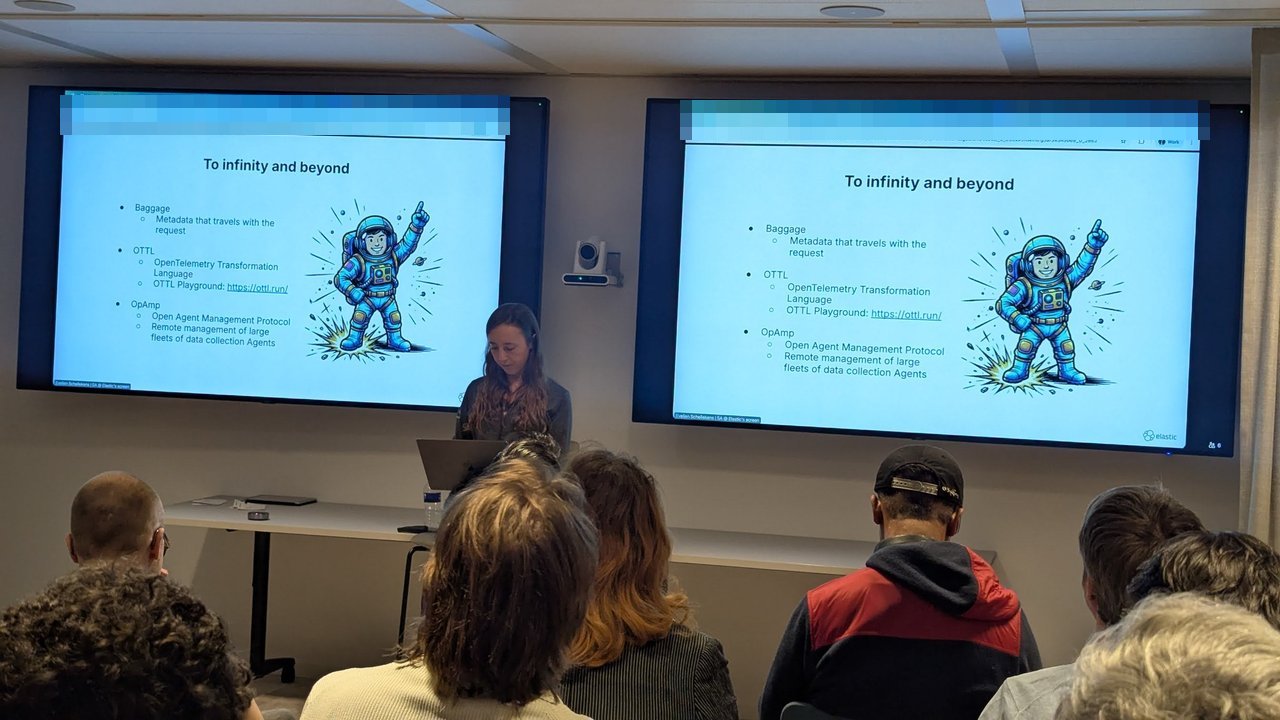
To infinity and beyond
The slide I found most useful was To infinity and beyond, which listed three OpenTelemetry features worth learning once the basics are in place:
- Baggage: metadata that travels with the request
- OTTL: the OpenTelemetry Transformation Language, with a playground at ottl.run
- OpAMP: the Open Agent Management Protocol, for remote management of large fleets of data collection agents
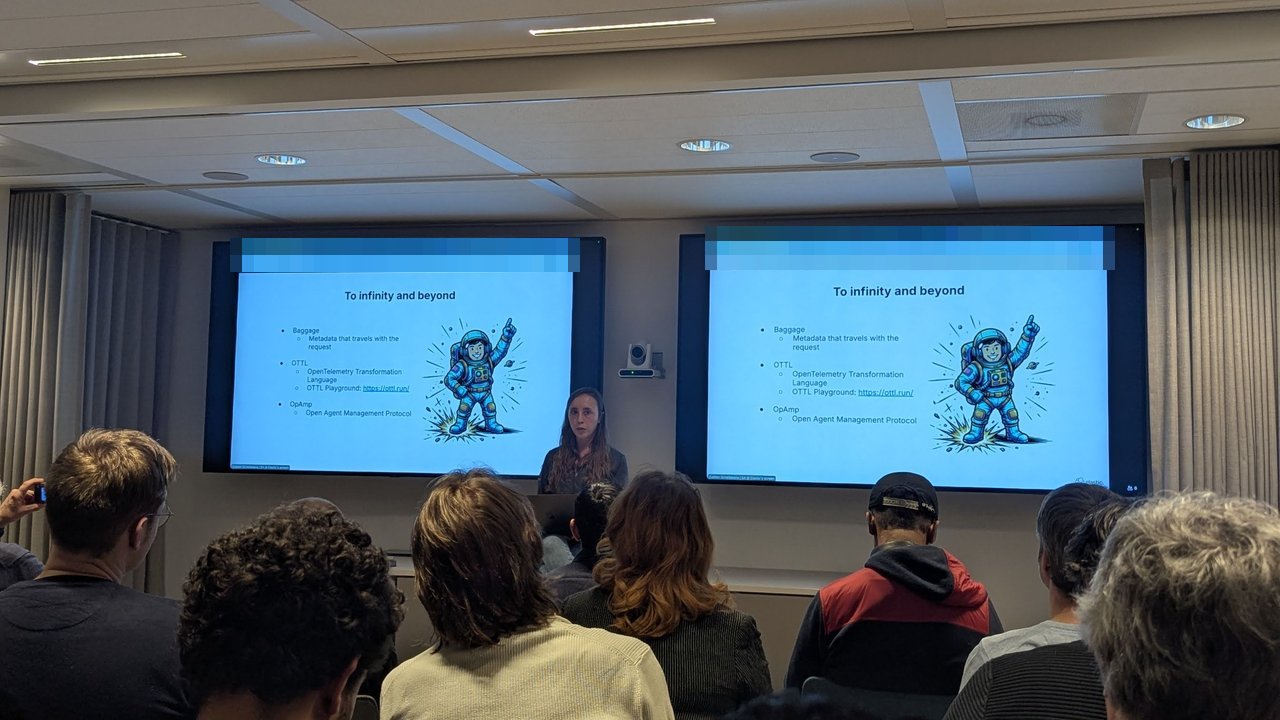
Baggage, OTTL and OpAMP: the “next step” list after your first traces.
My take: OTTL is the one most teams underestimate. Being able to drop, rename or redact attributes in the Collector, before they reach any backend, is how you keep cardinality and costs under control without touching application code. The playground makes it much easier to test a statement before you ship it.
The talk ended with resources: an OpenTelemetry cheat sheet (“OpenTelemetry + Elastic: Exploring Elastic Observability with OTel”) at ela.st/otel-cheat-sheet, and Elastic’s Observability Labs articles, “resources for developers by developers like you”. The example on that slide was a 20 January 2026 article, “A train ride away from a million events per second with EDOT Cloud Forwarder”.
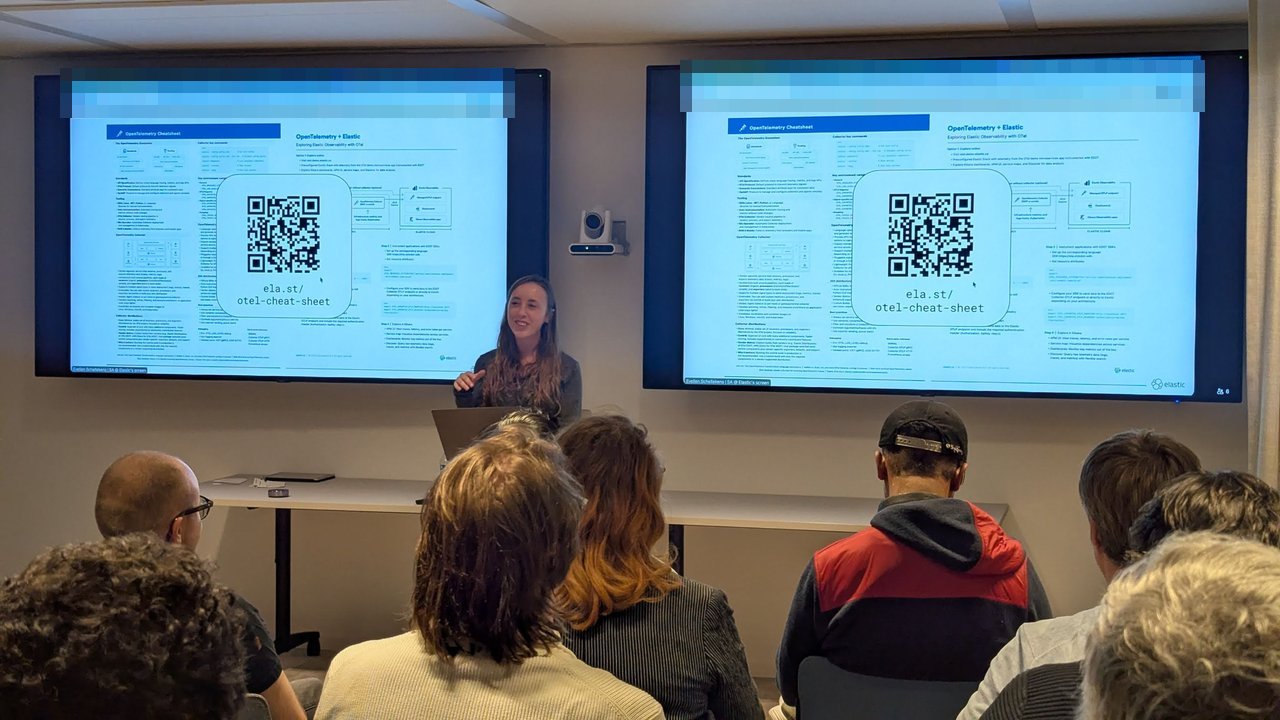
The OpenTelemetry cheat sheet, one QR code away.
The biases your dashboards won’t show
The second half of the title, “your brain”, was the second talk. The speaker’s intro slide described his background as DevOps, SRE and platform engineering, and his work as speaker, educator and consultant. The deck was a PDF that, judging by the viewer’s title bar, was called “Short Lecture Human Biases in IT”. Each slide was a cartoon-style illustration of one bias, usually with an IT example and a list of ways to fight it.
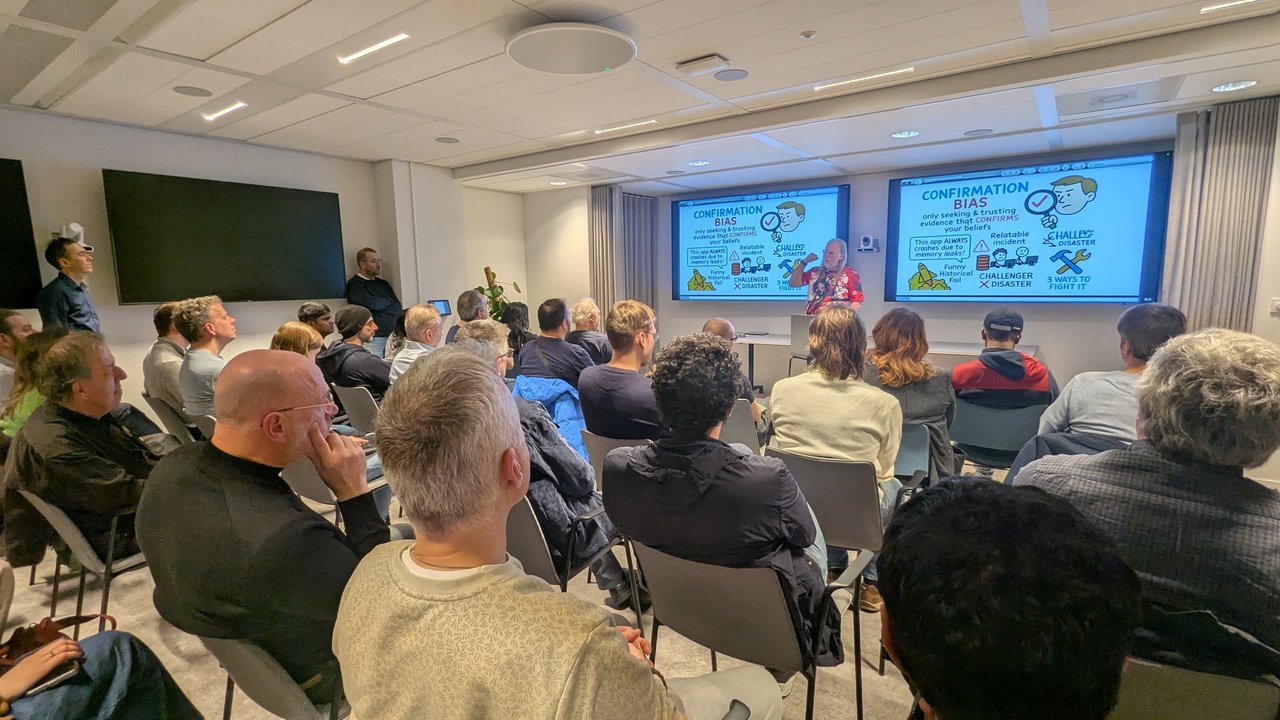
Confirmation bias: “This app ALWAYS crashes due to memory leaks!”
Here are the biases, as the slides described them:
- Confirmation bias: only seeking and trusting evidence that confirms your beliefs. The IT example was “This app ALWAYS crashes due to memory leaks!” The historical example was the Challenger disaster.
- Availability bias: “we remember what hurt”, or judging risk by what is easily recalled. The slide’s examples included a component labelled “flaky”, “Not DNS? Double check.” and “Shark attack? Never swim again!” How to fight it: use data dashboards, show historical trends, and ask “what have we ignored?”
- Optimism bias: overly positive thinking. “DevOps sin #1” was “We don’t need a rollback strategy”, next to Friday evening deploys, “We’ll clean it up later” code and “temporary” features, plus a 2 AM clock. How to fight it: run pre-mortems, budget for Murphy’s Law, and ask “what could go wrong?”
- Groupthink: everyone agrees to bad ideas. The “infamous incident” on the slide was a plan to rebuild all 150 CI/CD pipelines in one sprint, and “the awkward moment” was a cartoon team saying “Let’s deploy!” while one person looks worried.
- Overconfidence bias: the belief that you know more than you do. The engineering version: “This script is solid. No need to test it in staging.” The horror story: a developer once hotfixed a production system. How to fight it: add peer reviews and teach the Dunning-Kruger effect.
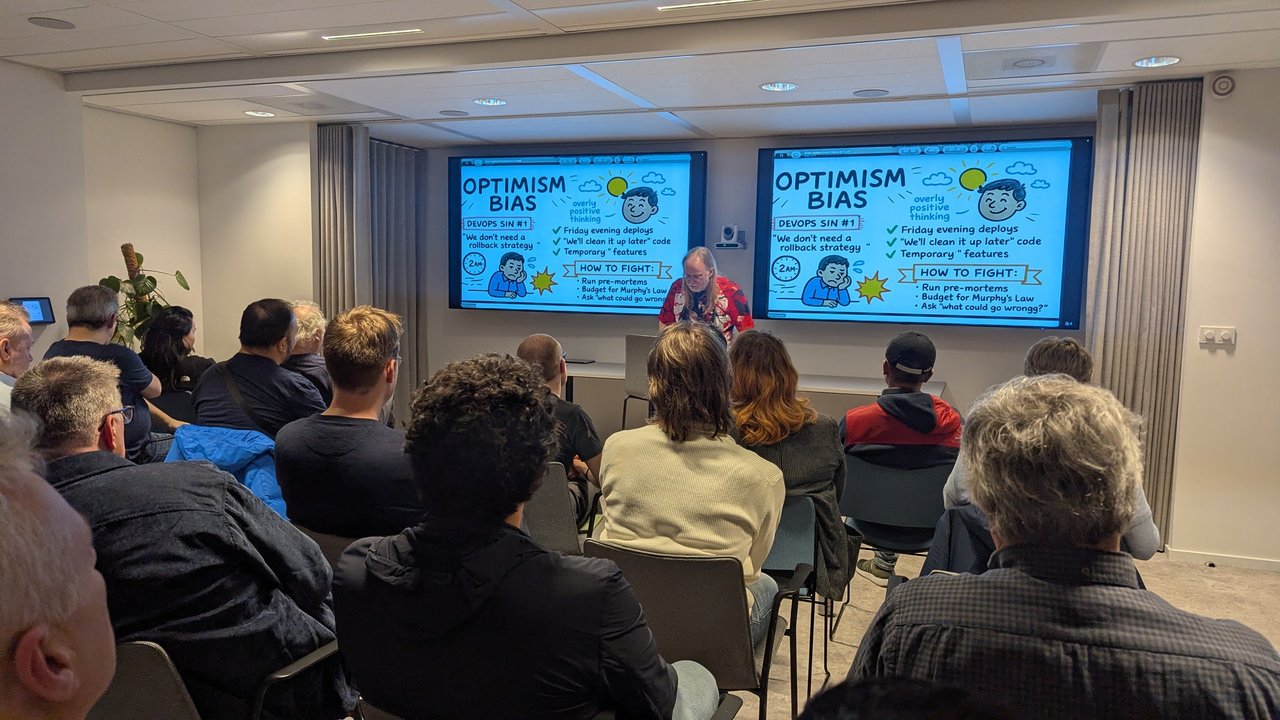
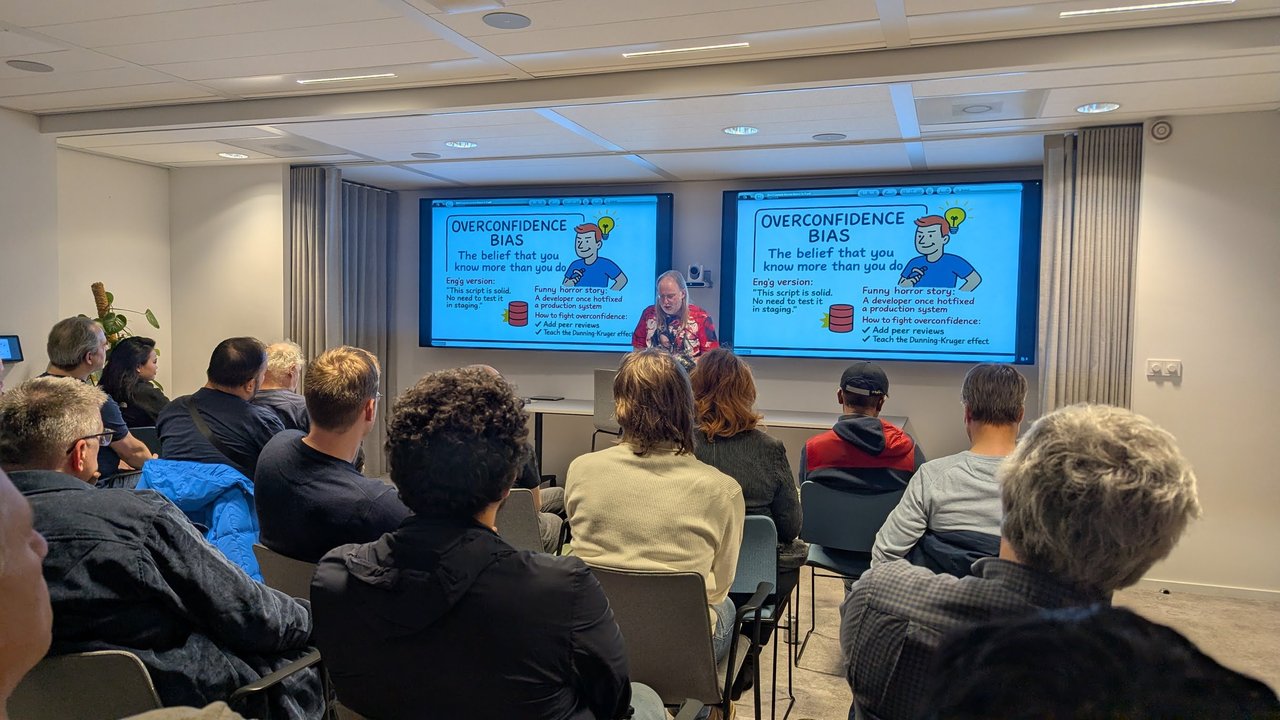
Optimism bias and overconfidence bias, each with its own “how to fight” list.
My take: almost every fix on those slides is a process, not a personal resolution. Pre-mortems, peer reviews, historical trend panels and a rollback plan written before the deploy all work because they don’t rely on someone feeling sceptical at 2 AM. That is also why blameless postmortems matter: you can’t fight a bias in a review where people are busy defending themselves.
The closing slide was “You’re just human: think better”. Then the organisers joined the speaker at the front of the room to close the evening’s talks.
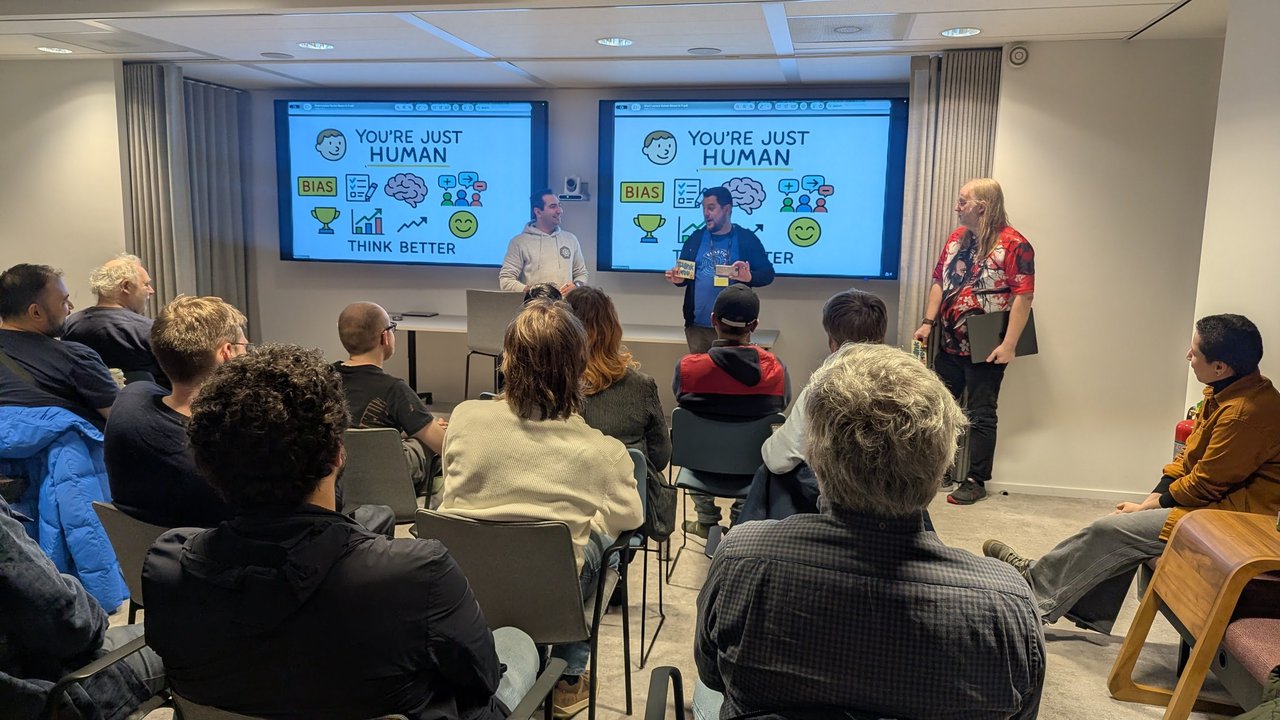
“You’re just human. Think better.”
What I took from the evening
The pairing worked. The first talk showed how OpenTelemetry and a good backend help you see what your systems are doing. The second showed the ways we still misread what we see. Dashboards can answer the question you ask, but they won’t tell you that you asked the wrong one.