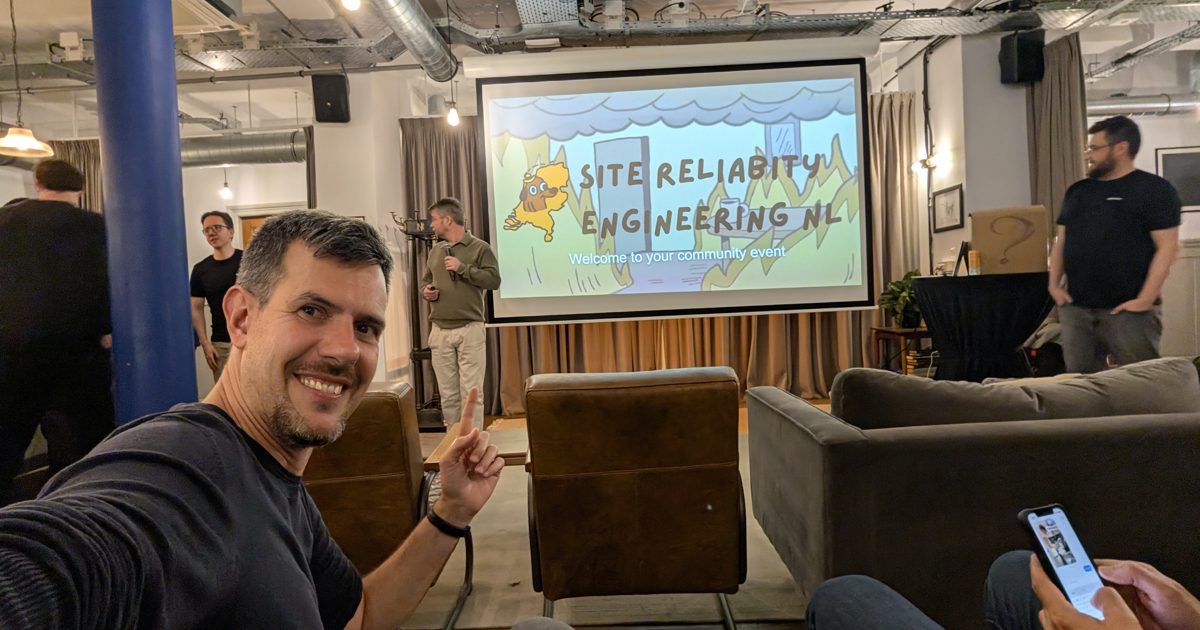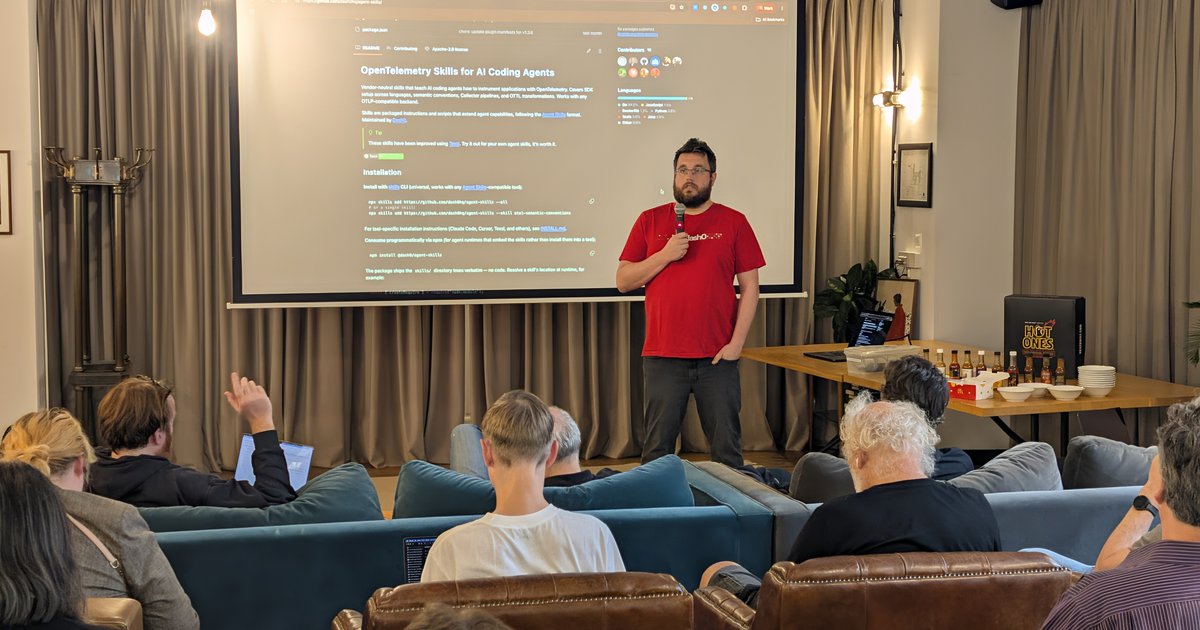
On 3 November 2026 I spent a day at SreDay DASH0 — an intimate SRE day held in a loft, run around dash0, the observability company whose tagline is beyond observability, ship more, break less. No main stage, no expo floor: leather sofas, exposed ceiling, and a projector. The kind of format where the talks land, because the room is small enough that every question is heard.
The through-line of the day was the one I keep coming back to on the observability side of the platform: OpenTelemetry has matured into a toolbox, and the interesting work now is in instrumentation and cost.
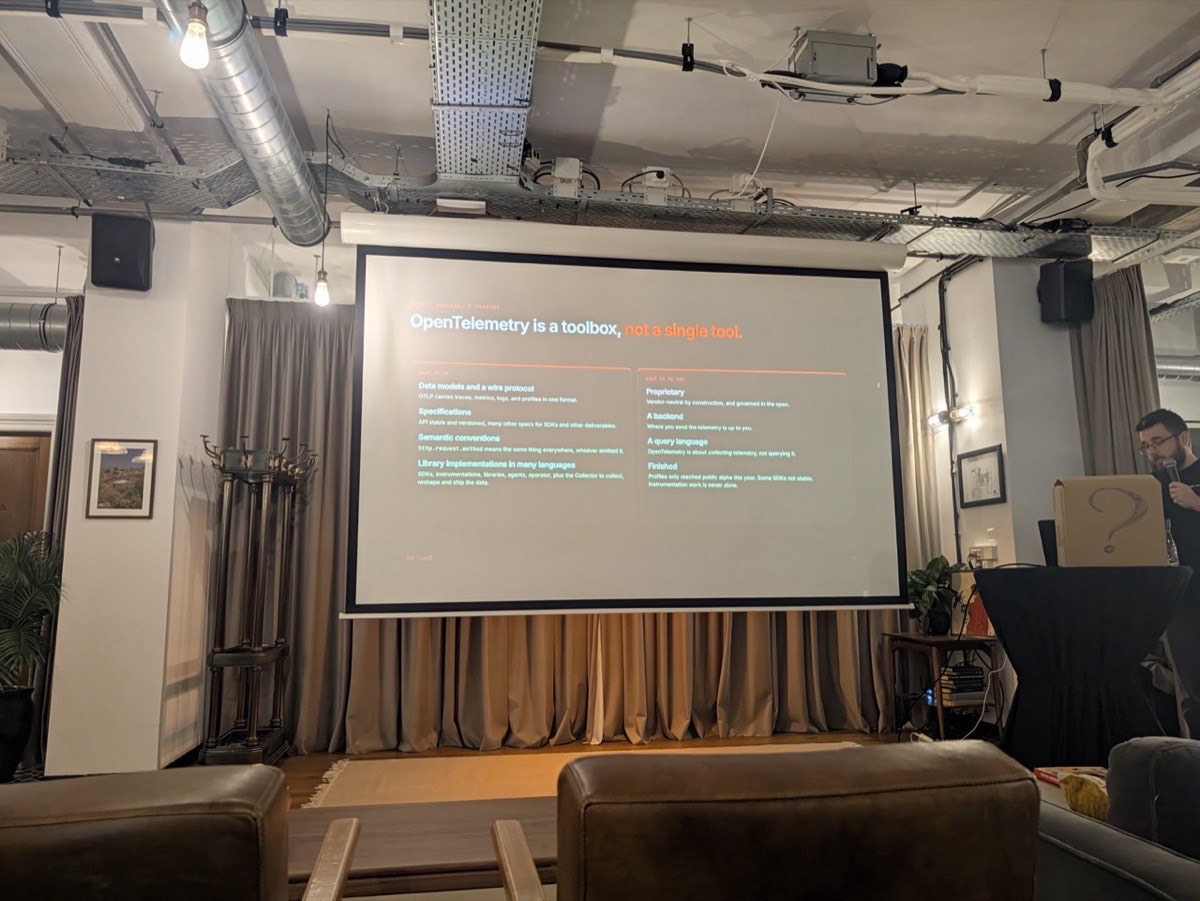
OpenTelemetry is a toolbox, not a single tool
The first framing was the one that finally made OTEL click for a lot of people: the OpenTelemetry ecosystem is large, and “OpenTelemetry” is not one product. On your services side you have the OTel API and the OTel SDKs, plus automatic instrumentation. On the shared-infrastructure side you have Kubernetes, service meshes and cloud services. The client side is browsers, mobile and managed databases. All of it funnels through one thing — the OTel Collector, which receives, processes and exports telemetry — and out the other end goes Prometheus (metrics), Jaeger (traces), and dash0 (all signals, and a shared pipeline). The point of the ecosystem, and the reason it wins, is that the pipeline is the standard: change the back end, keep the front end.
eBPF changes the instrumentation game
The most concrete shift on the day was OBI — OpenTelemetry eBPF Instrumentation. The headline slide was the one I’d have put on my own deck: you add nothing to your image, because it monitors from outside. OBI reads protocol-level distributed tracing (HTTP, gRPC, SQL, Redis, Kafka) straight off the sockets, so the language doesn’t matter — Go, Rust, C++, a vendor binary you can’t rebuild, a database. What it costs: elevated privileges (it needs a DaemonSet to control the host), and sharp edges in trace-context propagation (in Go it follows goroutine ancestry six levels deep, and TLS can break the injected context). Status on the day: beta at KubeCon EU 2026, 1.0 shipped 30 October 2026.
Then the caveat that separates a demo from production: the OpenTelemetry Operator gives you zero-code, automatic injection on Kubernetes — but you still have to know your libc. Alpine links against musl, the default build expects glibc, and the wrong value gives you zero spans. The profilers never load. The lesson is the same one I make on the platform side: zero code does not mean zero knowledge.
The economics of telemetry
The part that matters most to a platform team is cost, and dash0’s SignalControl is exactly that lens: a pipeline that reduces telemetry volume, cuts ingestion cost and retains only the data you need — filter and convert rules across logs, metrics and spans, with a live picture of what is ingested versus stored. On the day the numbers were telling: tens of thousands of events ingested, a few thousand stored, with per-signal reduction ratios. That is the observability analogue of the cost-control pillar in my From AI Demo to Production framework: the biggest lever is not the price of a token or a data point, it is utilisation — and knowing what you actually need to keep.
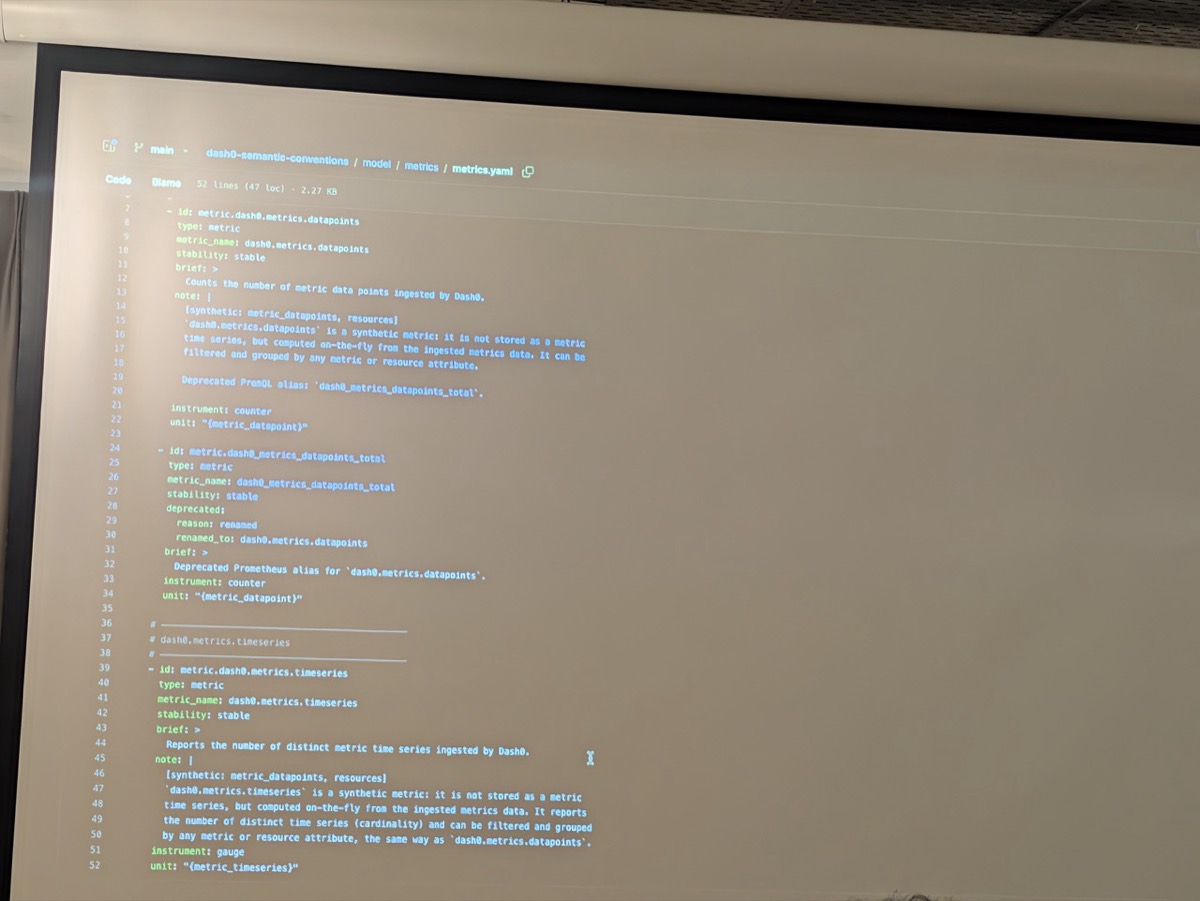
Alongside it: dash0’s own semantic conventions (a dash0-metrics.yaml of the metrics dash0 itself emits — data points ingested, time series, counters and gauges), and the newer AI SLO insights and Automerge views, where the platform starts reasoning about service-level objectives rather than just plotting them.
And the pub quiz
No SRE day is complete without one. SreDay DASH0 closed with an OTel Pub Quiz — register via a QR code, random teams, and a scoring system built from poker chips stamped beyond observability / ship more / break less, in fives and tens. It was the right note to end on: the serious engineering of the morning, and the reason the community keeps showing up, in the same room.
The photos from the day are up separately.