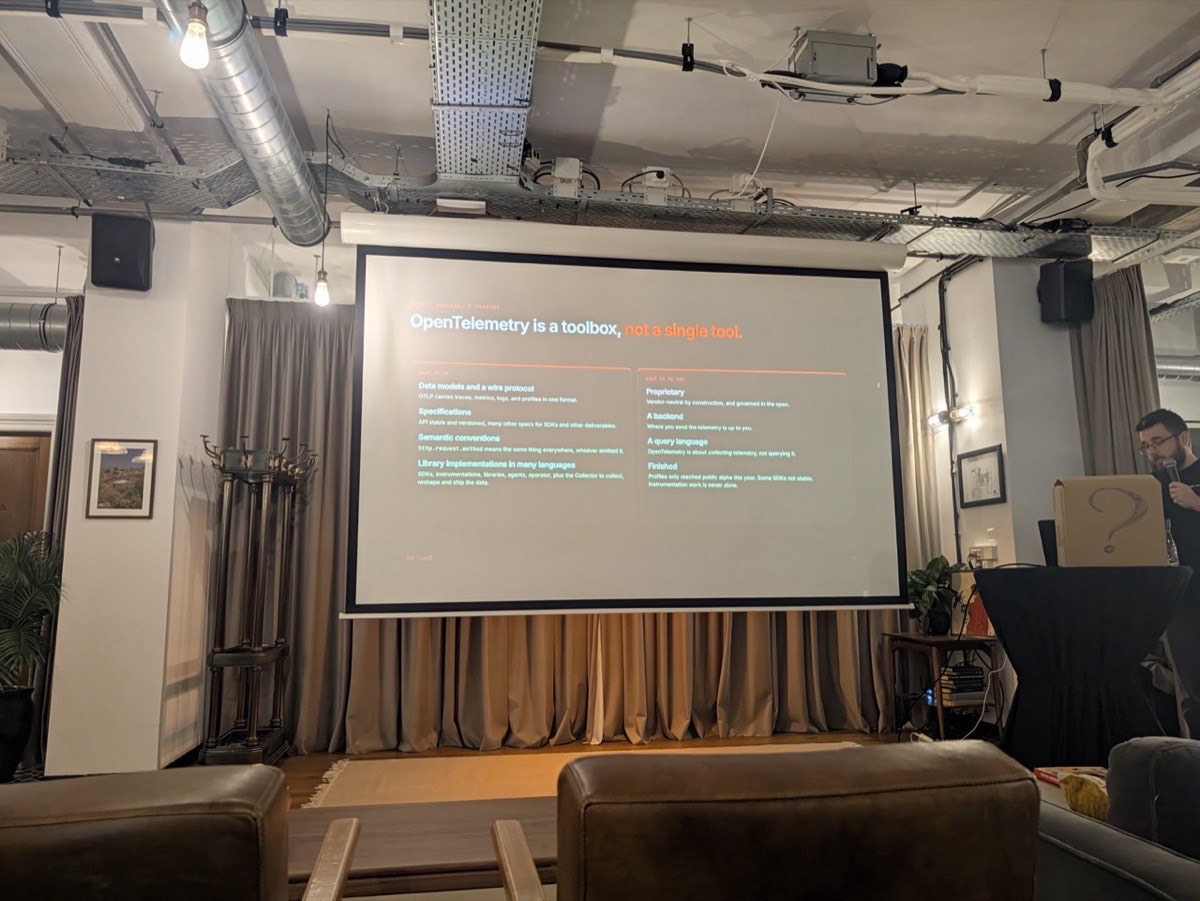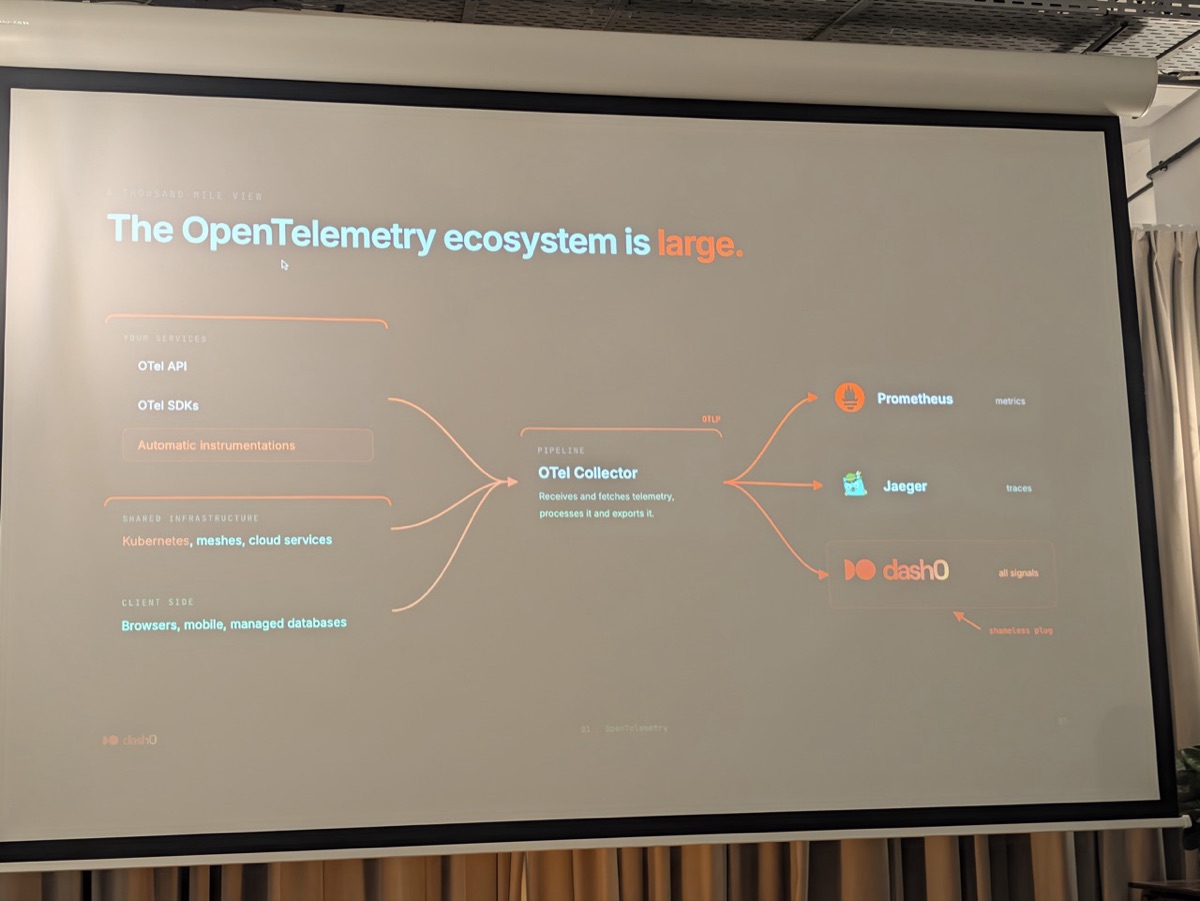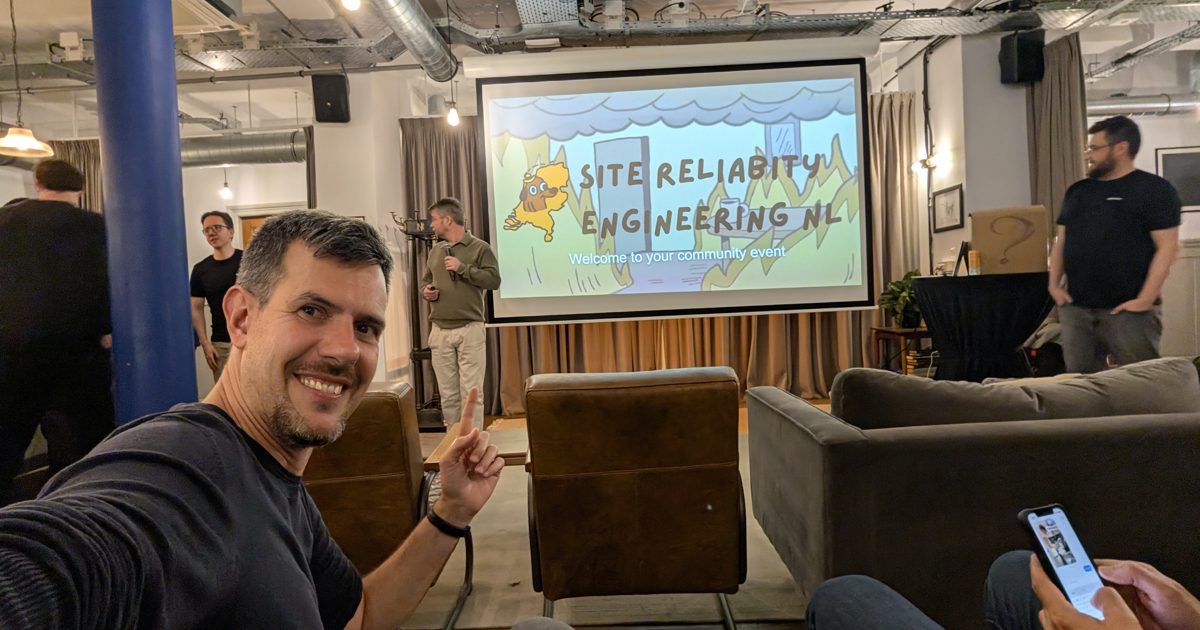
If SreDay DASH0 had one standout moment, it was the observability Q&A — and it was funny. The format was a hot-sauce challenge: the harder the question, the hotter the sauce the host had to eat before answering. It was the best way I have seen to keep a dense technical room on its toes, and it made the day easy to remember. (For the room, the deck and the OBI story, start with my SreDay DASH0 overview; for the day in photos, the gallery.)
Four signals, not three
The thread that ran through the day is the one that finally made observability click for a lot of people: there are not three signals, there are four. Traces, logs, metrics are the familiar three — and the fourth, the one most people still underestimate, is profiling. Tracing tells you which service was slow across a distributed call chain; profiling tells you where inside a single process the time or memory actually went. Metrics tell you how much; logs tell you what happened; traces tell you where, across services; profiling tells you where, in code. The day’s point was that the interesting work in OpenTelemetry now lives in making all four signals share one pipeline and one vocabulary.
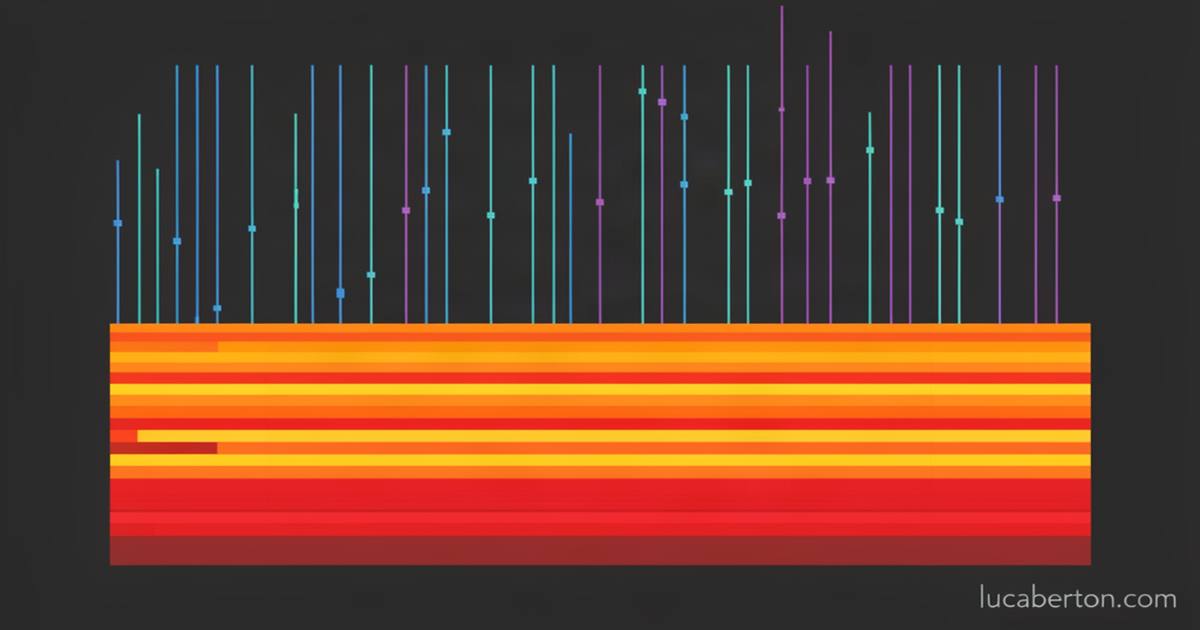
Profiling and the flame graph
Profiling was the most concrete topic. The mental model is the flame graph (and its close cousin, the icicle graph): a stack of frames where the width of a frame is how much time or memory that path consumed. The modern shift is continuous profiling — always-on sampling rather than attaching a profiler for one debug session — so you can spot hot methods, allocation spikes and lock contention before they become an incident. The same Q&A drew the line that matters operationally: profiling lives inside one process, while tracing lives across services. You need both, and they should share the same span context so you can jump from a slow request in a trace down to the exact hot method that caused it.
Semantic conventions are the unglamorous win
The theme I keep returning to from this day is semantic conventions. When every signal is tagged the same way — the same resource attributes, the same span names, the same metric names — you can move a workload from one backend to another without rewriting your dashboards, and you can cross-correlate signals instead of staring at three disconnected graphs. The Q&A made the practical case: a good resource attribute is where a signal comes from — service, instance, host, region — and with it you can grow from logs to spans to metrics and back, because the annotations that link them are standardized. That is the unglamorous work that actually pays off.
Web, mobile and where AI is going
Two themes closed the day and both point forward. On the client side, the day covered web and mobile monitoring — real-user monitoring, session-level events, and turning browser and mobile signals into the same OpenTelemetry stream as your backend. And on the frontier, the recurring answer was the one I have been saying on the platform side for a while: AI is about to observe our software in new ways — turning telemetry into natural-language diagnosis, and making the question “why is this slow” answerable by asking, not by grepping logs at 3am. That is the direction of the whole ecosystem, and it is why the day felt less like a talk and more like a preview.
Related Content
About the Author
Luca Berton is a Production AI Expert and ex-Red Hat engineer, a Docker Captain and author of eight books on containers and cloud-native platforms. He writes about OpenTelemetry, SRE and the path from prototype to production.