If you want to speed up a Maven build, you have more levers than “buy a bigger CI runner”: the shape of your modules, -T parallel builds, -pl/-am to build only what changed, parallel tests, the Maven Build Cache Extension and the Maven Daemon. I wanted numbers rather than folklore, so I generated the same synthetic Java codebase twice, once as one big module and once split into nine modules, and timed each lever on my laptop.
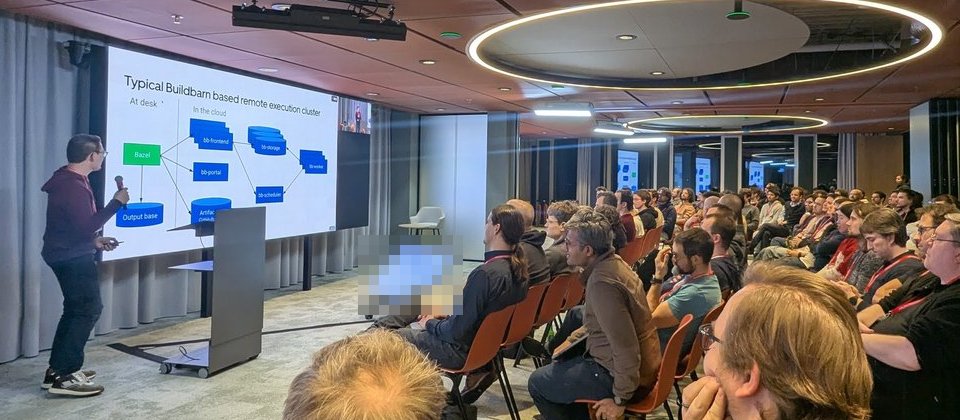
The idea came from the Uber x EngFlow Build Meetup in Amsterdam on 28 January 2026. Sergey Chernov from Miro gave the lightning talk “Why Maven build is slow and how to make it faster?”, and the slide I photographed, “Split large modules to smaller”, made two points: smaller modules have a smaller set of upstream dependencies, and they’re built in parallel. That slide is all I have from the talk. Everything below is my own lab, built from the Maven docs.

The “Split large modules to smaller” slide from the Build Meetup Amsterdam.
Versions. macOS 26.6 on an Apple M1 Pro (8 cores, 16 GB), Oracle JDK 19.0.1, Maven 3.9.16 through Maven Wrapper 3.3.4, maven-build-cache-extension 1.3.0, mvnd 1.0.6 (which bundles Maven 3.9.16), maven-compiler-plugin 3.16.0, maven-surefire-plugin 3.6.0, maven-jar-plugin 3.5.1, maven-resources-plugin 3.5.0, maven-clean-plugin 3.5.0, maven-install-plugin 3.2.0 and JUnit Jupiter 5.14.4. I checked flags against mvnw --help and the docs on maven.apache.org.
The test project: one big module vs nine small ones
A Python script writes the same code twice. mono/ has one shop module with all 2,250 classes and 72 test classes. multi/ has nine modules wired like this:
GRAPH = {
    "core": [],
    "model": ["core"],
    "util": ["core"],
    "billing": ["model", "util"],
    "inventory": ["model", "util"],
    "shipping": ["model", "util"],
    "notification": ["util"],
    "api": ["billing", "inventory", "shipping", "notification"],
    "app": ["api"],
}
Each area gets 250 classes (records, streams, lambdas and a call into each upstream area, so the dependencies are real) and 8 test classes with 4 tests each. Each test runs a fixed CPU loop of about 50 ms, standing in for slow unit tests. The parent POM pins every plugin version. The graph is four modules wide (billing, inventory, shipping, notification) and five deep (core, model, billing, api, app).
Set up the Maven Wrapper without installing Maven
The official way to add the wrapper is mvn wrapper:wrapper, which needs Maven. I had only a JDK, so I took the wrapper scripts from Maven Central’s maven-wrapper-distribution artifact (the only-script type, the default) and wrote the properties file myself:
curl -O https://repo.maven.apache.org/maven2/org/apache/maven/wrapper/maven-wrapper-distribution/3.3.4/maven-wrapper-distribution-3.3.4-only-script.zip
unzip maven-wrapper-distribution-3.3.4-only-script.zip mvnw
mkdir -p .mvn/wrapper
cat > .mvn/wrapper/maven-wrapper.properties <<'EOF'
wrapperVersion=3.3.4
distributionType=only-script
distributionUrl=https://repo.maven.apache.org/maven2/org/apache/maven/apache-maven/3.9.16/apache-maven-3.9.16-bin.zip
distributionSha256Sum=5af3b743dd8b876b5c45da33b676251e5f1687712644abb4ee519ca56e1d89ce
EOF
I checked both zips against their published checksums on Central. To keep the lab out of ~/.m2, I set MAVEN_USER_HOME (where the wrapper unpacks Maven) and moved the local repository:
export MAVEN_USER_HOME=$PWD/../m2home
export MAVEN_OPTS="-Dmaven.repo.local=$PWD/../m2home/repository"
./mvnw -V -q verify
Results
Each number is the median of three timed runs after a warm-up, wall clock, ./mvnw -B -q. I ran the full-build rows round-robin so background load hit them equally, but runs still varied by up to 5 seconds. Treat these as illustrative: the shape of the gains on one synthetic project, not a prediction for yours.
| Scenario | mono (1 module) | multi (9 modules) |
|---|---|---|
clean verify | 23.0 s | 28.7 s |
-T 1C clean verify | 24.1 s | 17.5 s |
-T 4 clean verify | not run | 18.6 s |
-T 1C -o clean verify (offline) | not run | 17.2 s |
clean verify -DforkCount=1C | 13.0 s | not run |
clean verify + JUnit parallel | 11.7 s | 12.9 s (with -T 1C) |
mvnd clean verify (vs mvnw) | 19.1 s (22.3 s) | 13.1 s (17.2 s with -T 7) |
One file changed, verify without clean | 24.9 s | 17.2 s (-T 1C) |
One file changed, -pl shipping -am | not applicable | 10.5 s |
One file changed, -pl shipping -amd after install | not applicable | 12.4 s |
| Build cache, first build (cache empty) | not run | 19.4 s (-T 1C) |
| Build cache, everything cached | 2.2 s | 2.3 s |
Build cache, one file in shipping changed | 28.5 s | 15.6 s |
Build cache, one file in core changed | not applicable | 21.9 s |
| Empty local repository (downloads included, 2 runs) | not run | 29.4 s (-T 1C) |
Parallel builds with -T, and why one big module can’t use them
-T 1C means one thread per CPU core, -T 4 means four threads. Maven builds modules in parallel when the dependency graph allows it. It doesn’t split work inside a module, so mono gained nothing from -T (23.0 s vs 24.1 s, within noise). Its 2,250 classes go to javac in one call and its 72 test classes go to one surefire JVM.
Built serially, multi is slower than mono (28.7 s): nine javac calls and nine test JVMs add overhead. With -T 1C it drops to 17.5 s, because the four middle modules build at once. -T 4 was no faster, since the graph is never more than four wide. The longest chain (core to app) sets the wall-clock time, so a split pays off when it makes the graph wider, not longer. That’s the slide’s point: fewer upstream dependencies per module, more modules starting at once.
The Maven parallel builds wiki page still calls this “experimental” and warns about plugins that aren’t thread-safe. Maven logs a warning when a plugin isn’t marked @threadSafe, so read the log of your first -T build.
Speed up Maven build tests: forkCount and JUnit parallel
In this project, tests were the biggest single cost, and parallel tests gave the biggest win on full builds: mono went from 23.0 s to 13.0 s with -DforkCount=1C and to 11.7 s with JUnit’s own parallel execution.
forkCount: the maximum number of test JVMs surefire runs at once. Per the surefire docs, aCsuffix multiplies by the core count, the default isforkCount=1withreuseForks=true(one JVM per module), and with more forks test classes are handed out one by one. Separate JVMs isolate static state but cost memory.- JUnit Jupiter parallel: one JVM, several threads. Surefire’s own
parallelparameter documents its values for JUnit 4.7+, and its JUnit 5 Platform page says that route doesn’t support running tests in parallel. Since Surefire 3.6.0, all tests run through the JUnit Platform, so you enable Jupiter’s feature through its configuration parameters instead:
<plugin>
  <groupId>org.apache.maven.plugins</groupId>
  <artifactId>maven-surefire-plugin</artifactId>
  <version>3.6.0</version>
  <configuration>
    <properties>
      <configurationParameters>
        junit.jupiter.execution.parallel.enabled = true
        junit.jupiter.execution.parallel.mode.default = concurrent
      </configurationParameters>
    </properties>
  </configuration>
</plugin>
enabled = true alone doesn’t run anything concurrently: the JUnit docs say the default execution mode is SAME_THREAD, so you also need mode.default = concurrent (or mode.classes.default). For the benchmark I passed both keys as -D system properties, which JUnit also reads. Parallel tests in one JVM only work if your tests don’t share mutable static state, ports or files.
With tests parallel, multi -T 1C (12.9 s) was no faster than mono (11.7 s): the split’s per-module overhead ate its scheduling advantage. On this project, the module split pays off in incremental builds and with the cache, which the next sections show.
Build only what changed: -pl, -am and -amd
Without clean, the compiler plugin’s change detection doesn’t make a big module cheap. After editing one file in mono, the log said Recompiling the module because of changed source code. and Compiling 2250 source files. In multi, core, model, util and the other untouched modules logged Nothing to compile - all classes are up to date., while shipping, api and app (changed dependency) recompiled 250 files each. But surefire ran every module’s tests again, changed or not: 17.2 s.
-pl (projects) narrows the reactor:
./mvnw -T 1C verify -pl shipping -am     # shipping plus what it needs: core, model, util
./mvnw -T 1C verify -pl shipping -amd    # shipping plus what depends on it: api, app
-pl shipping -am took 10.5 s. -amd has a trap: on a clean checkout, -pl shipping -amd failed with Could not find artifact com.example:model:jar:1.0.0-SNAPSHOT, because model and util aren’t in the reactor and nothing had been installed. Combining -am -amd didn’t fix it either: api failed on billing, inventory and notification, because -am adds only shipping’s own upstream. It worked (12.4 s) after a one-off ./mvnw install -DskipTests, but then Maven builds against whatever SNAPSHOT jars are in your local repository, which can be stale.
Offline mode and dependency resolution
With a warm local repository and only release dependencies, -o saved nothing measurable (17.2 s vs 17.5 s). The expensive case is an empty local repository: 29.4 s instead of about 17 s, downloading JUnit and every plugin. On CI that’s every run unless you cache the local repository between jobs. My lab had no remote SNAPSHOT dependencies, so I didn’t measure update checks.
Maven Build Cache Extension
The Maven Build Cache Extension hashes each module’s inputs and, on a match, restores its outputs instead of running the plugins. Version 1.3.0 needs Maven 3.9.0 or later. The docs prefer the core extension model, .mvn/extensions.xml:
<extensions>
  <extension>
    <groupId>org.apache.maven.extensions</groupId>
    <artifactId>maven-build-cache-extension</artifactId>
    <version>1.3.0</version>
  </extension>
</extensions>
The optional config goes in .mvn/maven-build-cache-config.xml. This minimal one matches the documented defaults (xxHash, three builds kept per module):
<cache xmlns="http://maven.apache.org/BUILD-CACHE-CONFIG/1.4.0"
       xmlns:xsi="http://www.w3.org/2001/XMLSchema-instance"
       xsi:schemaLocation="http://maven.apache.org/BUILD-CACHE-CONFIG/1.4.0 https://maven.apache.org/xsd/build-cache-config-1.4.0.xsd">
  <configuration>
    <enabled>true</enabled>
    <hashAlgorithm>XX</hashAlgorithm>
    <local>
      <maxBuildsCached>3</maxBuildsCached>
    </local>
  </configuration>
  <input>
    <global>
      <glob>*</glob>
    </global>
  </input>
</cache>
The local cache lives in a build-cache directory next to the local repository (build-cache/v1.2/<groupId>/<artifactId>/<checksum>/local/ in my lab). A hit looks like this:
[INFO] Loading cache configuration from .../multi/.mvn/maven-build-cache-config.xml
[INFO] Using XX hash algorithm for cache
[INFO] Local build found by checksum 363876e899ffa966
[INFO] Found cached build, restoring com.example:core from cache by checksum 363876e899ffa966
[INFO] Skipping plugin execution (cached): compiler:compile
[INFO] Skipping plugin execution (cached): surefire:test
[INFO] Skipping plugin execution (cached): jar:jar
With everything cached, clean verify took 2.3 s, tests included, because the cached tests are skipped too. After a change in shipping, the log showed exactly the chain I expected: core, model, util, billing, inventory and notification restored, and Local build was not found by checksum ... for com.example:shipping, then api and app rebuilt because their upstream checksum changed (15.6 s). A change in core invalidates everything (21.9 s). In mono, one changed file means a full rebuild (28.5 s). Cache granularity is the module, which is another reason to split.
Each build also writes target/maven-incremental/cache-report.*.xml in the root project, with checksumMatched and source (LOCAL here) per module. Use it to see why a module missed.
Things to know:
- A comment change is a change. Inputs are hashed by content, so whitespace or comments rebuild the module and everything downstream.
- Restored modules only get the jar in
target/, nottarget/classes. The docs warn that the cache doesn’t restore the whole project state, so IDEs shouldn’t compile into Maven’stargetfolders. - Skipped tests are the point and the risk. The getting-started guide asks you to review the
buildinfo.xmlof a typical module, check that the expected source files are in it and add critical plugin parameters to runtime reconciliation before you trust hits. - Useful switches:
-Dmaven.build.cache.enabled=false,-Dmaven.build.cache.skipCache=true(force a rebuild but still save) and-Dmaven.build.cache.skipSave=true(read-only, for example on pull request builds). A remote cache on any HTTP server that supports GET and PUT shares hits across CI runners, which I didn’t test.
Maven Daemon (mvnd)
mvnd keeps a long-lived daemon JVM, so plugin classloaders and JIT-compiled code survive between builds. It also builds modules in parallel by default, using cores minus one threads. The 23 MB darwin-aarch64 archive needed no install. I set MVND_DAEMON_STORAGE and -Dmaven.repo.local to keep it out of ~/.m2:
export MVND_DAEMON_STORAGE=$PWD/../mvnd-storage
mvnd -B -q clean verify -Dmaven.repo.local=$PWD/../m2home/repository
mvnd --stop
The first run, which starts the daemon, took 17.2 s. Warm runs took 13.1 s against 17.2 s for ./mvnw -T 7 on multi, and 19.1 s against 22.3 s on mono: 3 to 4 seconds saved per build. That helps on laptops, where builds repeat, not on ephemeral CI runners that start a new daemon each time.
Profile where the time goes
- Reactor summary. Without
-q, Maven prints a per-module time at the end. With-Tthe total line readsTotal time: 10.097 s (Wall Clock), and module times overlap. - Timestamps on every log line. Maven 3.9 logs through an SLF4J Simple-based provider, so
-Dorg.slf4j.simpleLogger.showDateTime=true -Dorg.slf4j.simpleLogger.dateTimeFormat=HH:mm:ss.SSSprefixes each line with a time. The gaps between--- compiler:...,--- surefire:...and--- jar:...show where each module spends its time. - Surefire reports.
target/surefire-reportshas the time per test class. - The cache report, above, for cache misses.
I didn’t try a third-party timing extension; the timestamps were enough here.
My take
Measure first, then fix in this order: parallel tests (cheap if your tests are isolated), -T 1C on CI, and a module structure whose dependency graph is wide rather than deep. Big modules are slow twice: they can’t build in parallel, and any change rebuilds and retests all of them. The build cache extension is the biggest lever when most of the build doesn’t change, but only once modules are small enough for hits to be common. Bazel users will recognise the idea from the Bazel remote cache: reuse only works at the granularity your build graph gives you. For CI, cache the local repository and track build duration as a platform metric.