AgentOps in Production: Agentic End-to-End Observability
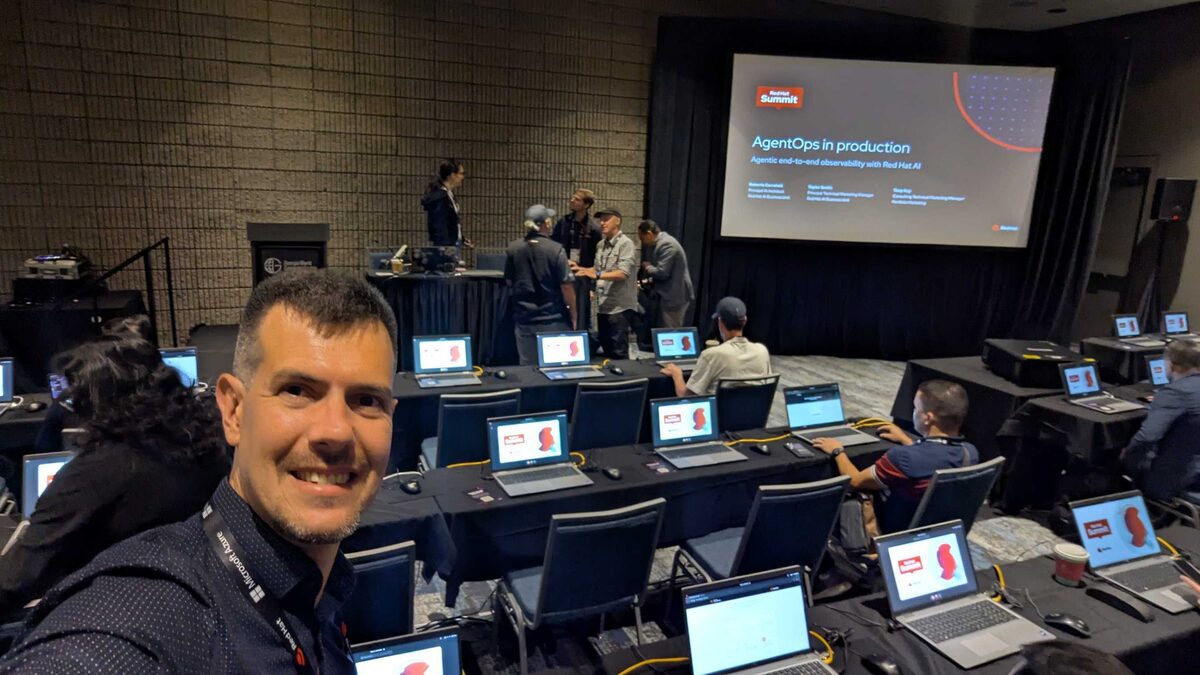
At Red Hat Summit 2026 in Atlanta, I attended the “AgentOps in Production” hands-on lab — one of the most anticipated sessions focused on agentic end-to-end observability with Red Hat AI.
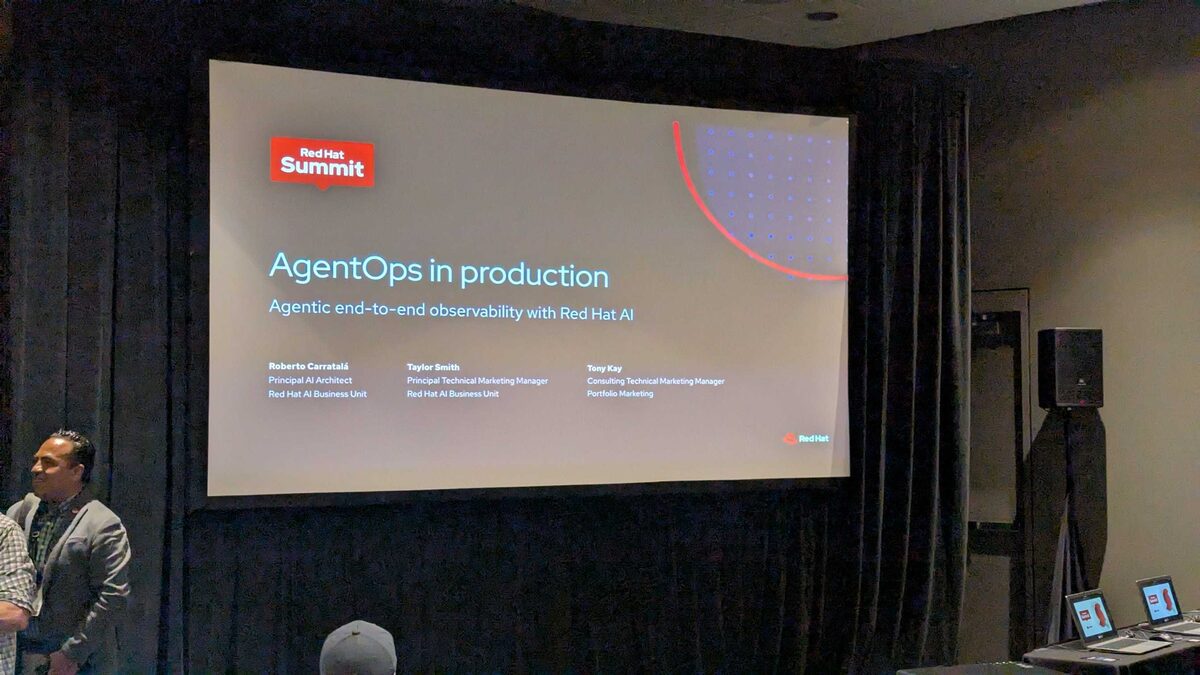
The lab was led by three Red Hat experts:
- Roberto Carratala — Principal AI Architect, Red Hat AI Business Unit
- Taylor Smith — Principal Technical Marketing Manager, Red Hat AI Business Unit
- Tony Kay — Consulting Technical Marketing Manager, Portfolio Marketing
What AgentOps Covers
Red Hat AI Platform Architecture
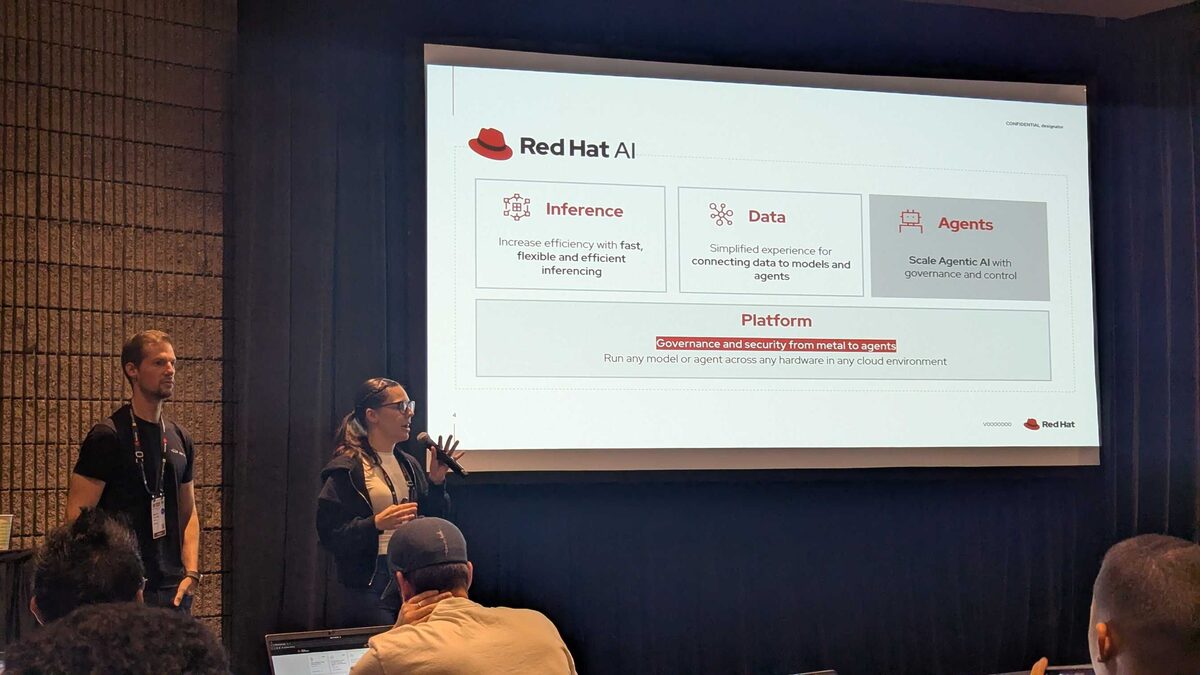
The session started with the Red Hat AI platform overview — four pillars:
- Inference: Fast, flexible, and efficient inferencing (powered by llm-d)
- Data: Simplified experience for connecting data to models and agents
- Agents: Scale Agentic AI with governance and control
- Platform: Governance and security from metal to agents — run any model or agent across any hardware in any cloud environment
The Agentic AI Explosion
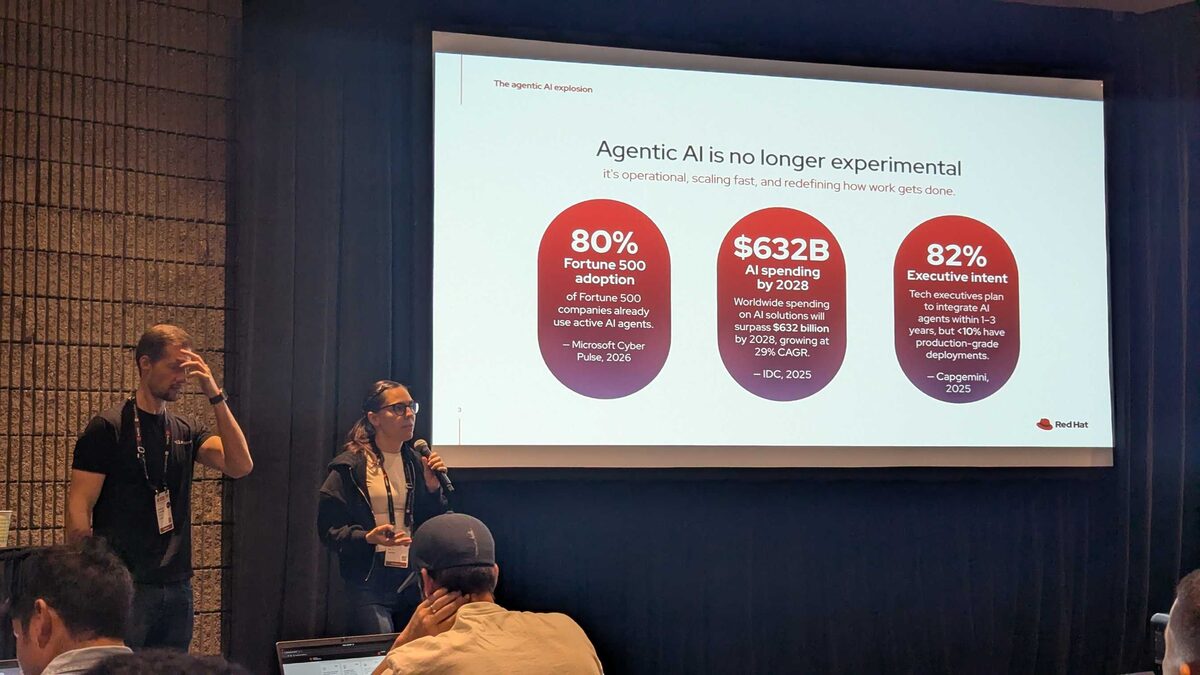
The numbers driving the urgency behind AgentOps:
- 80% Fortune 500 adoption — of Fortune 500 companies already use active AI agents (Microsoft Cyber Pulse, 2026)
- $632B AI spending by 2028 — worldwide spending on AI solutions will surpass $632 billion, growing at 29% CAGR (IDC, 2025)
- 82% Executive intent — tech executives plan to integrate AI agents within 1-3 years, but under 10% have production-grade deployments (Capgemini, 2025)
The gap between intent (82%) and production deployment (under 10%) is exactly where AgentOps lives. Enterprises want agents but cannot deploy them safely without observability, governance, and security tooling.
AgentOps is Red Hat’s approach to operationalizing AI agents in production. The lab covered end-to-end observability for agentic workloads:
- Tracing agent reasoning chains — following the full decision path from user prompt to final output
- Monitoring guardrail effectiveness — tracking block rates, false positives, and detector performance
- Auditing agent actions — every tool call, API request, and data access logged and traceable
- Performance metrics — latency per agent step, token usage, cost tracking across model providers
Hands-On: The Fed Aura Capital Mortgage AI Demo
The lab used a fictional “Fed Aura Capital” mortgage processing application — a multi-agent AI system running on OpenShift AI with 5 LangGraph agents, RAG-based compliance checking, and model routing.
The Mortgage AI Application

The front-end was a polished mortgage affordability calculator. Behind it: 5 specialized AI agents with role-scoped tools, RBAC enforcement, a compliance knowledge base using pgvector with tiered boosting (federal regulations, agency guidelines, internal policies), complexity-based model routing between fast and capable LLM tiers, hash-chained audit trails with MLflow trace correlation, PII masking middleware, and input/output safety shields.
Agentic Metrics: The 6 That Matter
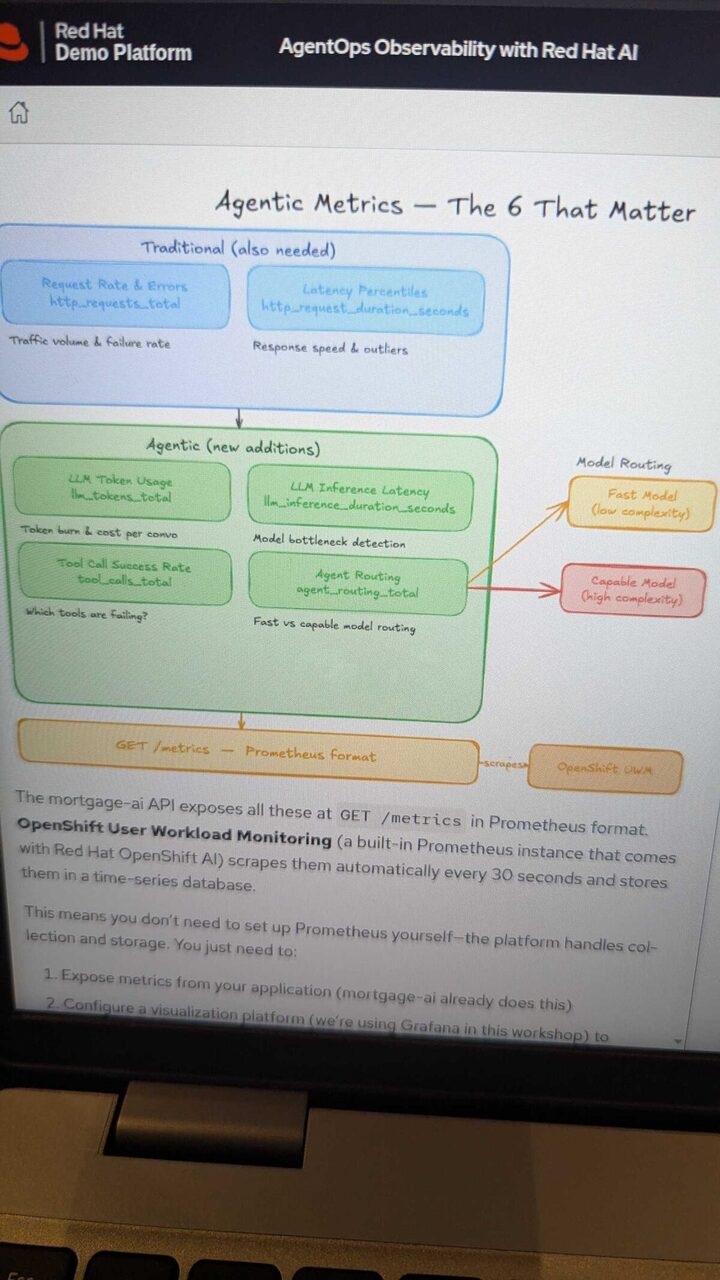
The lab defined 6 critical metrics for agentic observability, all exposed via Prometheus:
| Metric | Prometheus Name | Purpose |
|---|---|---|
| Request Rate and Errors | http_requests_total | Traffic volume and failure rate |
| Latency Percentiles | http_request_duration_seconds | Response speed and outliers |
| LLM Token Usage | llm_tokens_total | Token burn and cost per conversation |
| LLM Inference Latency | llm_inference_duration_seconds | Model bottleneck detection |
| Tool Call Success Rate | tool_calls_total | Which agent tools are failing? |
| Agent Routing | agent_routing_total | Fast vs capable model routing decisions |
OpenShift User Workload Monitoring (built-in Prometheus) scrapes these every 30 seconds automatically — no Prometheus setup needed.
Executive Dashboard and Agent Tracing
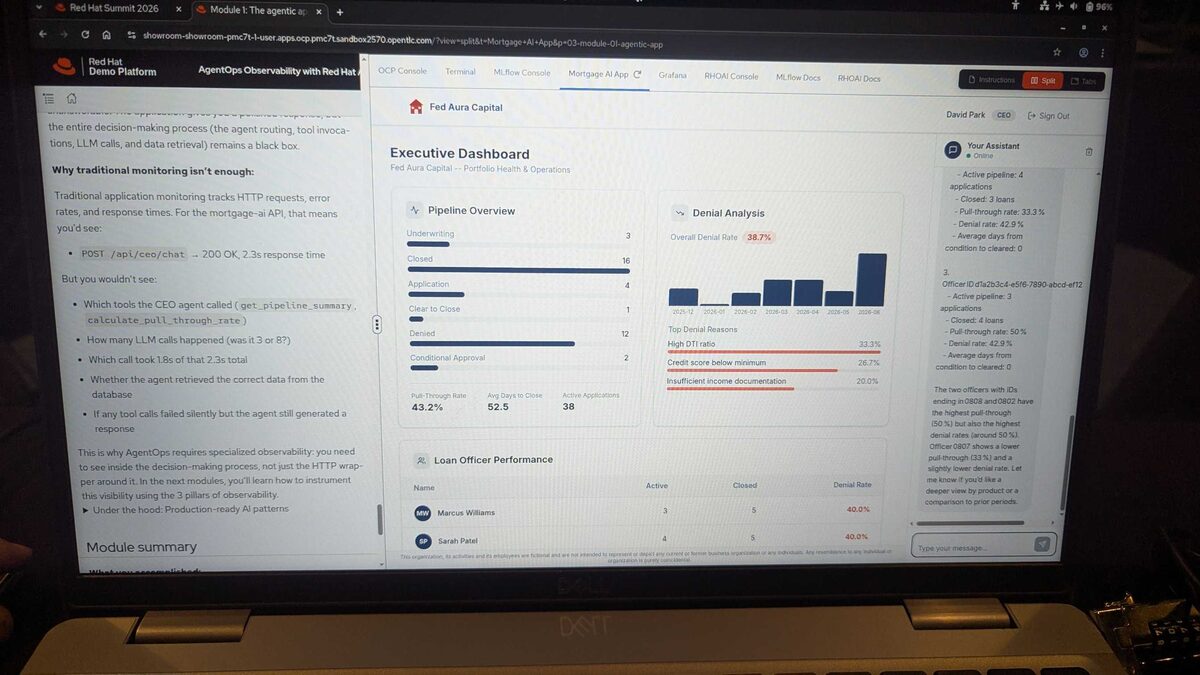
The executive dashboard showed real-time mortgage pipeline operations: 38 active applications, 43.2% pull-through rate, 38.7% overall denial rate. Top denial reasons: High DTI ratio (33.3%), credit score below minimum (26.7%), insufficient income documentation (20.0%). Loan officer performance tracked per agent with individual denial rates.
Grafana Observability
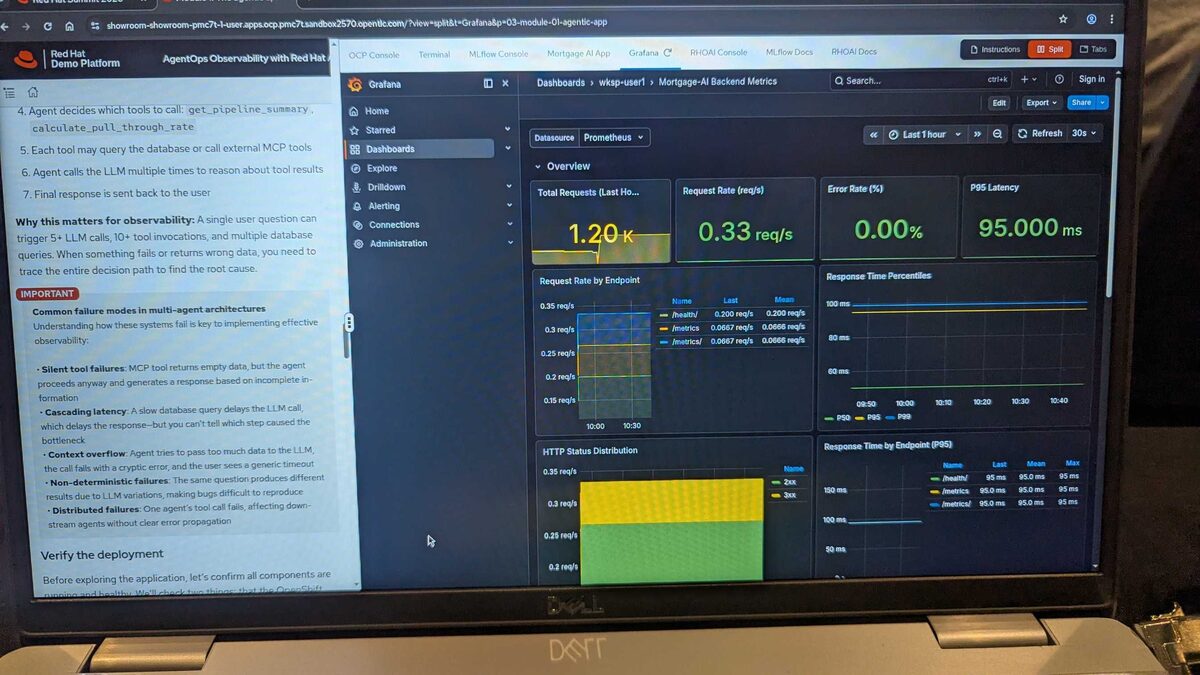
The Grafana dashboard showed 1.20K total requests, 0.33 req/s, 0.00% error rate, 95ms P95 latency. Request rate by endpoint, HTTP status distribution (all 2xx/3xx), and response time percentiles per endpoint — all scraped from the same Prometheus metrics.
OpenShift Terminal: Live Cluster
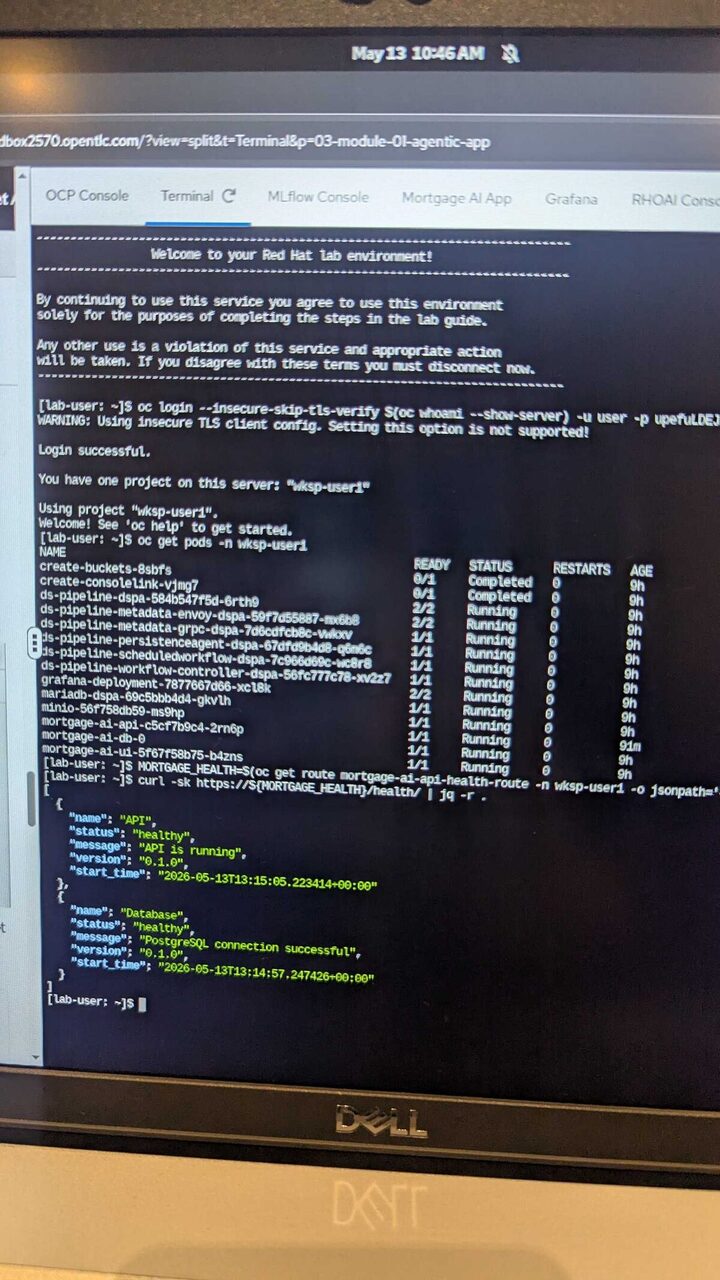
The terminal showed the full stack: ds-pipeline components (metadata, persistence, workflow-controller), Grafana deployment, MariaDB, MinIO for object storage, and the mortgage-ai-api pod — all running in the wksp-user1 namespace. Health check confirmed API running v0.1.0 with healthy PostgreSQL connection.
MLflow Trace Analysis: CEO Agent Deep Dive
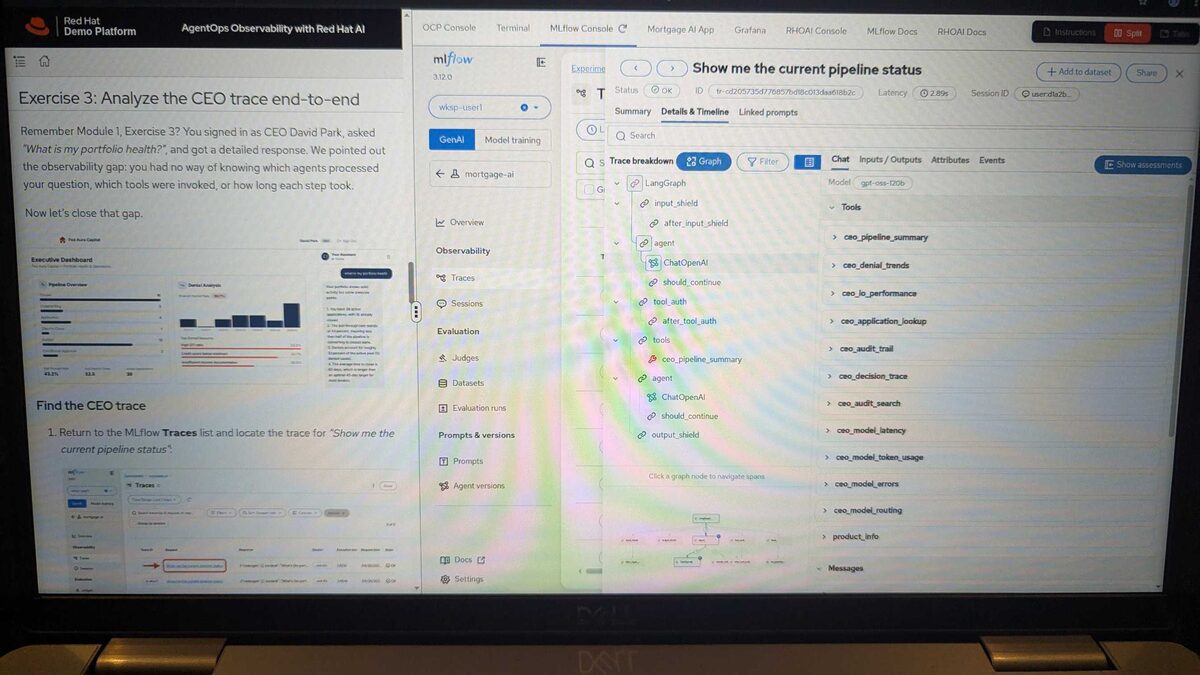
The most revealing exercise: tracing a CEO query “Show me the current pipeline status” end-to-end in MLflow 3.12.0. The trace breakdown showed every span in the LangGraph execution:
input_shield→after_input_shield(guardrails check)agent→ChatOpenAI→should_continue(decision point)tool_auth→after_tool_auth(authorization check)tools→ individual tool calls:ceo_pipeline_summary,ceo_denial_trends,ceo_lo_performance,ceo_application_lookup,ceo_audit_trail,ceo_decision_trace,ceo_audit_search,ceo_model_latency,ceo_model_token_usage,ceo_model_errors,ceo_model_routing,product_info- Final
agent→ChatOpenAI→should_continue→output_shield
The trace revealed 2.89s total latency, model gpt-oss-r20b, and the complete Graph view showing agent-to-agent handoffs. This is what traditional HTTP monitoring completely misses — a single 200 OK response hid 12+ tool calls, multiple LLM invocations, and authorization checks.
From LLM Workflows to Autonomous Agents
The session contextualized AgentOps within the broader evolution of enterprise AI. As agents gain more autonomy — from simple LLM workflows to agentic workflows to fully autonomous agents — observability becomes non-negotiable. You cannot trust what you cannot observe.
The hands-on exercises walked through setting up observability pipelines for OpenShift AI agents, configuring alerting on anomalous agent behavior, and building dashboards that give platform teams visibility into what their AI agents are actually doing in production.
Key Takeaways
Streamline Agent Operationalization
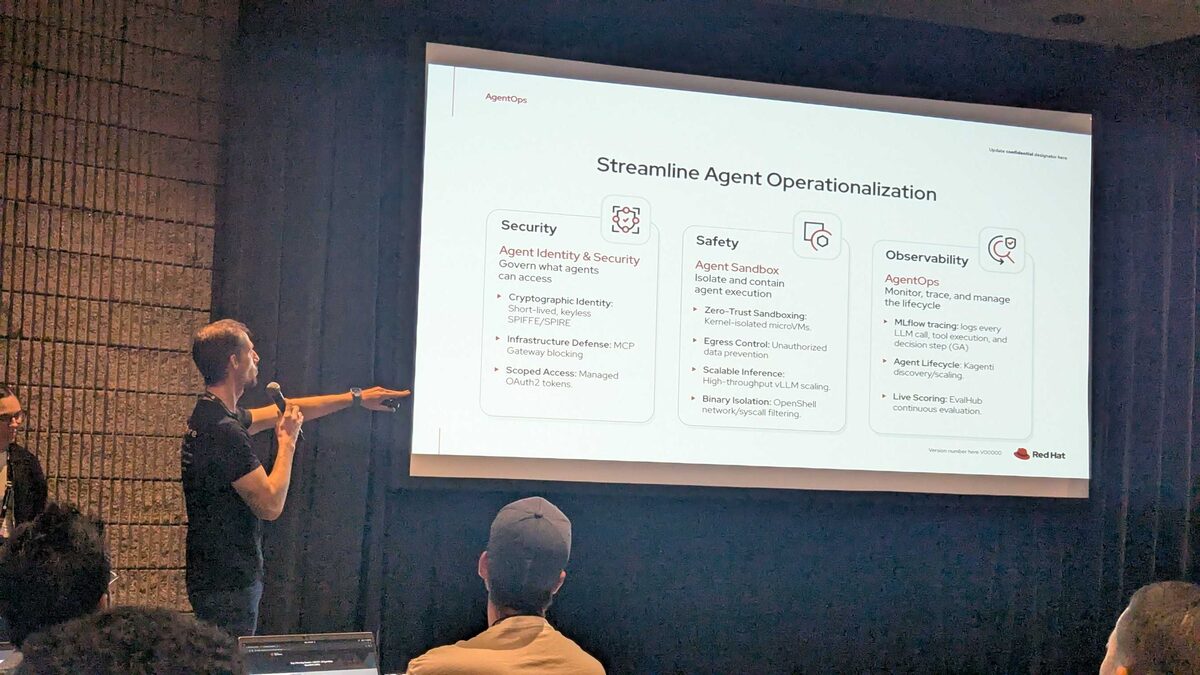
The lab broke AgentOps into three pillars:
Security — Agent Identity and Security (Govern what agents can access):
- Cryptographic Identity: Short-lived, keyless SPIFFE/SPIRE
- Infrastructure Defense: MCP Gateway blocking
- Scoped Access: Managed OAuth2 tokens
Safety — Agent Sandbox (Isolate and contain agent execution):
- Zero-Trust Sandboxing: Kernel-isolated microVMs
- Egress Control: Unauthorized data prevention
- Scalable Inference: High-throughput vLLM scaling
- Binary Isolation: OpenShell network/syscall filtering
Observability — AgentOps (Monitor, trace, and manage the lifecycle):
- MLflow tracing: Logs every LLM call, tool execution, and decision step (GA)
- Agent Lifecycle: Kagenti discovery/scaling
- Live Scoring: EvalHub continuous evaluation
Three Critical Gaps: Pilot to Production
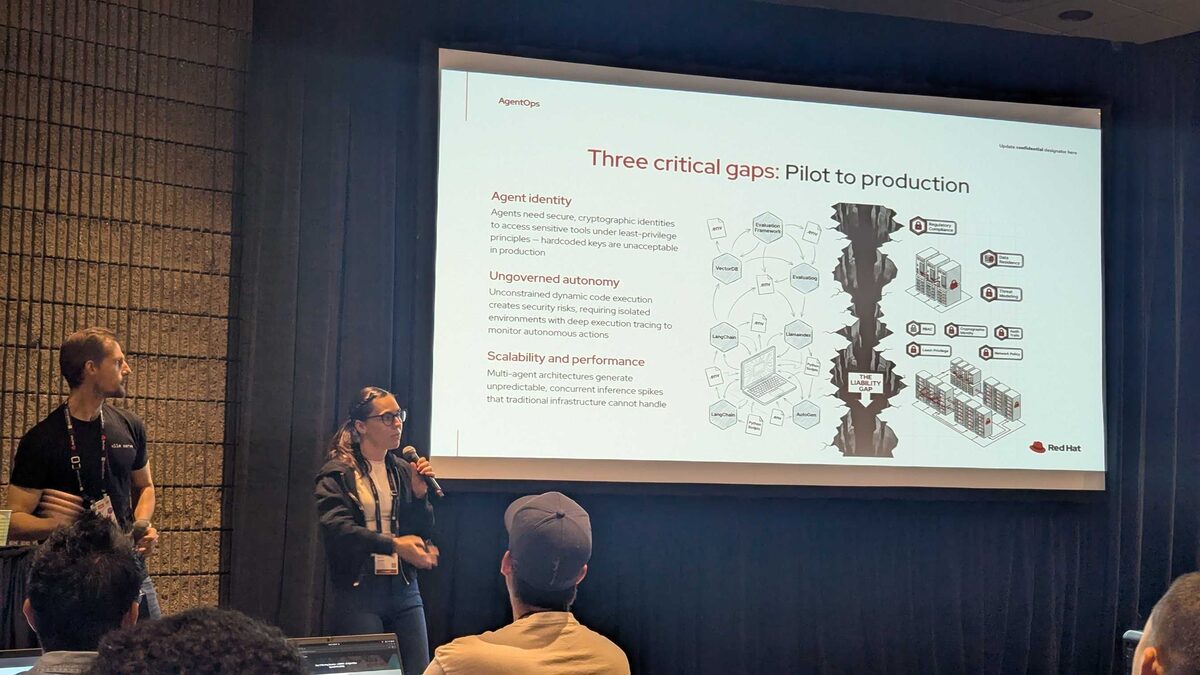
The session identified three gaps preventing enterprises from moving AI agents from pilot to production:
Agent Identity — Agents need secure, cryptographic identities to access sensitive tools under least-privilege principles. Hardcoded keys are unacceptable in production.
Ungoverned Autonomy — Unconstrained dynamic code execution creates security risks, requiring isolated environments with deep execution tracing to monitor autonomous actions.
Scalability and Performance — Multi-agent architectures generate unpredictable, concurrent inference spikes that traditional infrastructure cannot handle.
These three gaps map directly to the Security, Safety, and Observability pillars above — Red Hat’s AgentOps is designed to close all three simultaneously.
AgentOps with Red Hat AI: The Full Picture
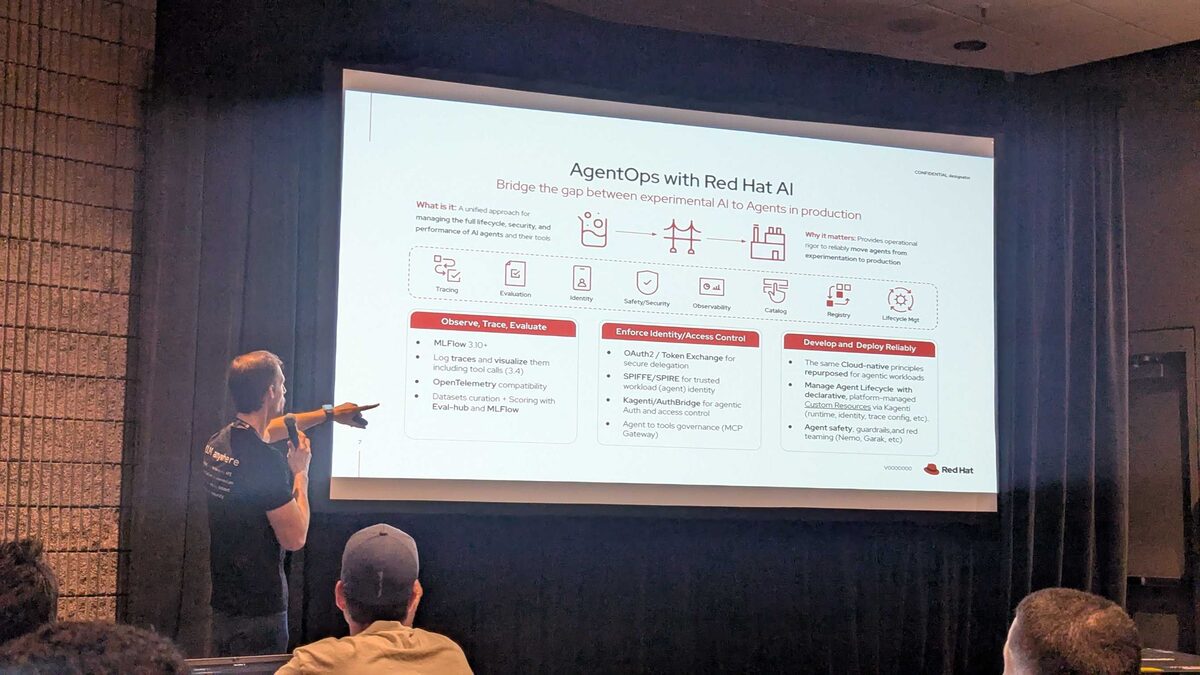
The comprehensive AgentOps slide tied everything together — “Bridge the gap between experimental AI to Agents in production.” The framework spans the full lifecycle: Tracing → Evaluation → Identity → Safety/Security → Observability → Catalog → Registry → Lifecycle Management.
Three operational domains:
Observe, Trace, Evaluate:
- MLFlow 3.10+ — log traces and visualize them including tool calls (3.4)
- OpenTelemetry compatibility
- Datasets curation + Scoring with Eval-hub and MLFlow
Enforce Identity/Access Control:
- OAuth2 / Token Exchange for secure delegation
- SPIFFE/SPIRE for trusted workload (agent) identity
- Kagenti/AuthBridge for agentic Auth and access control
- Agent to tools governance (MCP Gateway)
Develop and Deploy Reliably:
- Cloud-native principles repurposed for agentic workloads
- Declarative Agent Lifecycle management via Kagenti (runtime, identity, trace config)
- Agent safety, guardrails, and red teaming (Nemo, Garak)
Summary
- Observability is the foundation of trust — enterprises will not deploy autonomous agents without full visibility
- Existing observability tools are not enough — agent reasoning chains require new tracing primitives beyond traditional request/response
- Red Hat AI integrates with OpenTelemetry — agent traces flow into the same observability stack as your microservices
- Guardrail metrics matter — tracking what gets blocked is as important as tracking what gets through
This lab complemented the keynote announcements perfectly — the keynote showed the vision, the lab showed how to implement it.
Also at the Summit: HYVE Managed Hosting
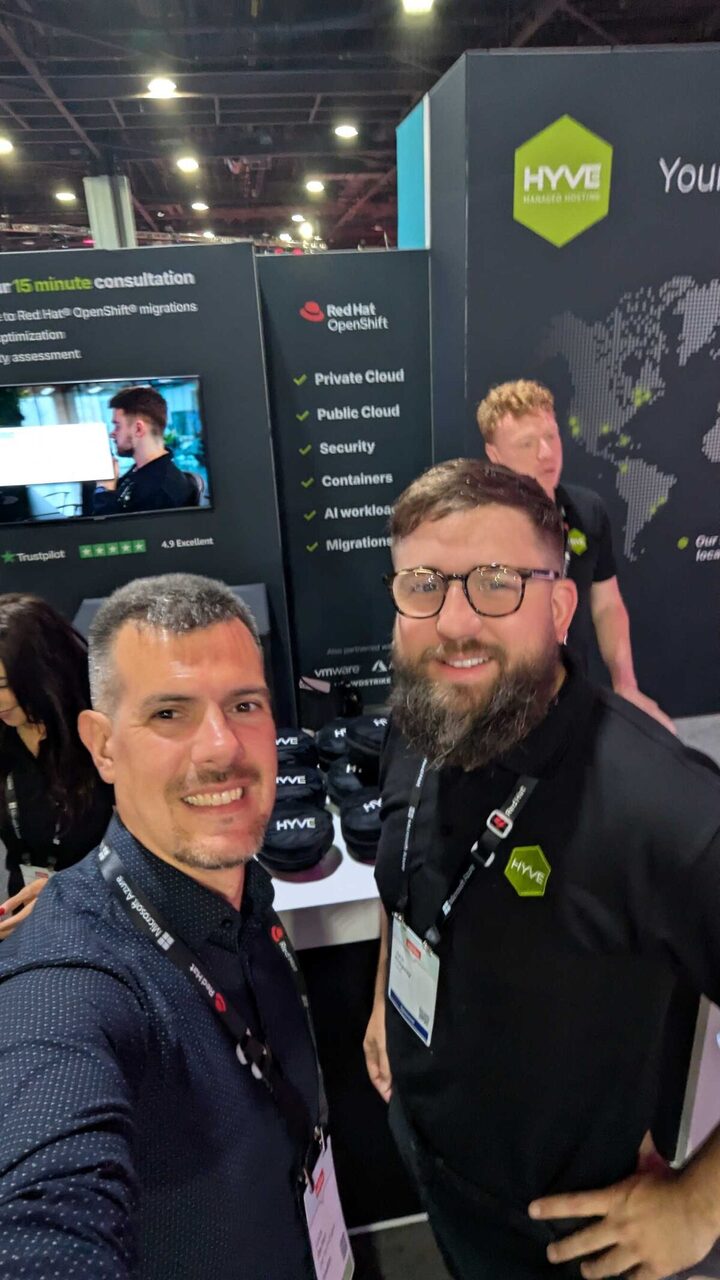
Between sessions, I stopped by the HYVE Managed Hosting booth. HYVE offers Red Hat OpenShift managed services across private cloud, public cloud, security, containers, AI workloads, and migrations — with a 4.9 Excellent Trustpilot rating. They also partner with VMware, AWS, and CrowdStrike.
Great conversations about how managed hosting providers are adapting their offerings for AI workloads and the growing demand for OpenShift migrations.
Red Hat Summit 2026 continues in Atlanta. Follow my keynote recap and book giveaway posts for more coverage.