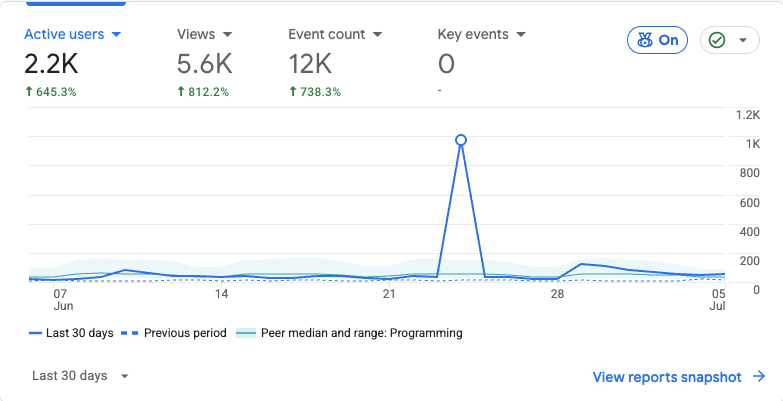
I ran cloc . on ProteinLens and got the kind of number that makes you sit up straighter in your chair:
- 123,989 text files
- 29,423 unique files
- 4,481,293 lines of code
- and a tiny warning that was basically the repo whispering: “bro…”
Line count, exceeded timeout:
./frontend/node_modules/playwright-core/lib/server/fetch.js
Nothing like a single dependency file timing out your line counter to remind you: you’re not measuring your product. You’re measuring the ecosystem.
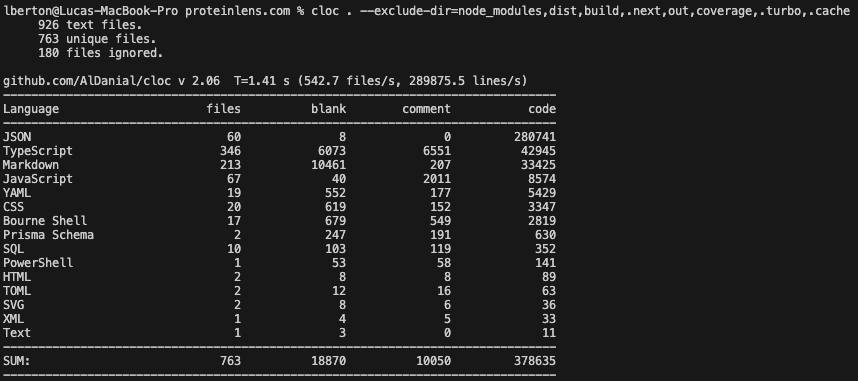
So I reran it with the grown-up filter:
cloc . --exclude-dir=node_modules,dist,build,.next,out,coverage,.turbo,.cacheAnd suddenly the truth showed up:
- 926 text files
- 763 unique files
- 378,635 lines of code
Same repo. Same project. Two completely different realities.
This is a post-mortem about what those two numbers actually mean — and why they map perfectly to the experience of building an AI MVP on Azure with “weekend vibes” and production ambitions.
Two cloc runs, two stories
Story #1: “I built a monster”
The first run is the dopamine hit:
- 4,481,293 LOC
- 18,525 JavaScript files
- 7,518 TypeScript files
- 1,417 JSON files
- plus a mountain of comments and blanks
And it’s heavily dominated by JavaScript:
- JavaScript code: 3,246,621
- TypeScript code: 543,789
- JSON code: 465,655
- Markdown code: 179,002
It’s also slow: 103 seconds and a timeout inside Playwright’s vendored code.
This is the “modern web app as a shipping container full of other shipping containers” experience.
Story #2: “Okay… here’s what I actually own”
The second run is what you should put in a blog post without lying to yourself:
- 378,635 LOC
- 763 files
- in 1.41 seconds
And the language mix flips into something much more informative:
- JSON: 280,741 (yes, still huge)
- TypeScript: 42,945
- Markdown: 33,425
- JavaScript: 8,574
- then the glue: YAML, CSS, Shell, Prisma, SQL…
That’s the real system footprint. That’s the part where decisions matter.
What ProteinLens does (and why these numbers aren’t just vanity)
ProteinLens is simple on the surface:
Photo → recognition → estimated protein → structured result
But the goal wasn’t “it works once on my laptop.” The goal was: build an MVP that looks like a product:
- a frontend that ships
- a backend with real endpoints
- a database for history and accounts
- CI/CD that doesn’t require a prayer
- secret handling that doesn’t leak on GitHub
Which is why the line count switch matters: it tells you whether you’re looking at your work, or your dependencies’ work.
Azure infrastructure overview
Current stack:
- Frontend: Azure Static Web Apps
- Backend: Azure Functions
- Database: Azure Database for PostgreSQL
- AI: AI Foundry endpoints (model + region + quota realities)
- Deploy: GitHub Actions for infra + app deploy
- Security hygiene: secret scanning + proper secret handling
On paper, the services scale.
In practice, what scales (or fails) is the system you assembled out of them.
The first cloc run is what “vibe coding” feels like
When you build fast with modern tooling, everything expands:
- dependency graphs
- generated assets
- build output
- lockfiles
- caches
- SDKs and clients and wrappers
- “helpful” pipeline steps that keep multiplying
That’s how you end up with:
- 29,423 files in the repo
- 18,525 JS files (lol)
- and a dependency file so gnarly it makes
cloctime out
It’s not bad. It’s just… not your product.
And it creates a very specific failure mode:
You start mistaking repo weight for engineering maturity
Bigger repo → feels serious → you relax Then the first real load shows up and reminds you: seriousness is retries, queues, observability, and guardrails — not LOC.
The second cloc run is what “product-shaped” actually looks like
After excluding the usual suspects (node_modules, build outputs, caches), the repo becomes readable:
- TypeScript (42,945 LOC): the actual app logic
- JavaScript (8,574 LOC): legacy, glue, tooling, scripts
- YAML (5,429 LOC): pipelines, config, infra wiring
- Shell (2,819 LOC): automation and local scripts
- Prisma (630 LOC) + SQL (352 LOC): the data model and queries
- Markdown (33,425 LOC): docs, notes, content
- JSON (280,741 LOC): the elephant in the room
That JSON number is the real “huh” moment.
Usually that means some combination of:
- lockfiles (package-lock / pnpm-lock / yarn.lock)
- generated specs / openapi snapshots
- datasets or fixtures
- build manifests
- large config blobs
It’s not automatically wrong — but it’s the kind of thing that quietly drives:
- CI slowness
- noisy diffs
- painful merges
- accidental “why is this in the repo?” debates
A tiny Playwright timeout taught me a real lesson: metrics need boundaries
That first run failed on:
./frontend/node_modules/playwright-core/lib/server/fetch.js
Which is hilarious, but also perfect.
Because every engineering metric needs a scope:
- “How big is the repo?” → include everything
- “How big is the product?” → exclude vendor/build/caches
- “How much code do we maintain?” → exclude generated files too
- “How much risk do we own?” → count infra + pipelines + migrations + secrets handling
If you don’t define the metric, the repo defines it for you.
And the repo will happily count 3.2 million lines of JavaScript you didn’t write.
What I learned (the honest version)
- My repo had 4,481,293 LOC… and only 378,635 LOC of it was “mine” after exclusions.
- The difference between “demo” and “product” isn’t features — it’s boring reliability work.
- Modern stacks inflate fast. That’s normal. Measuring without exclusions is basically self-hypnosis.
- JSON being 280,741 LOC is a signal to audit what’s committed and why.
- The most dangerous productivity trap is tooling that “helps” by adding more stuff every time. Progress often looks like deleting.