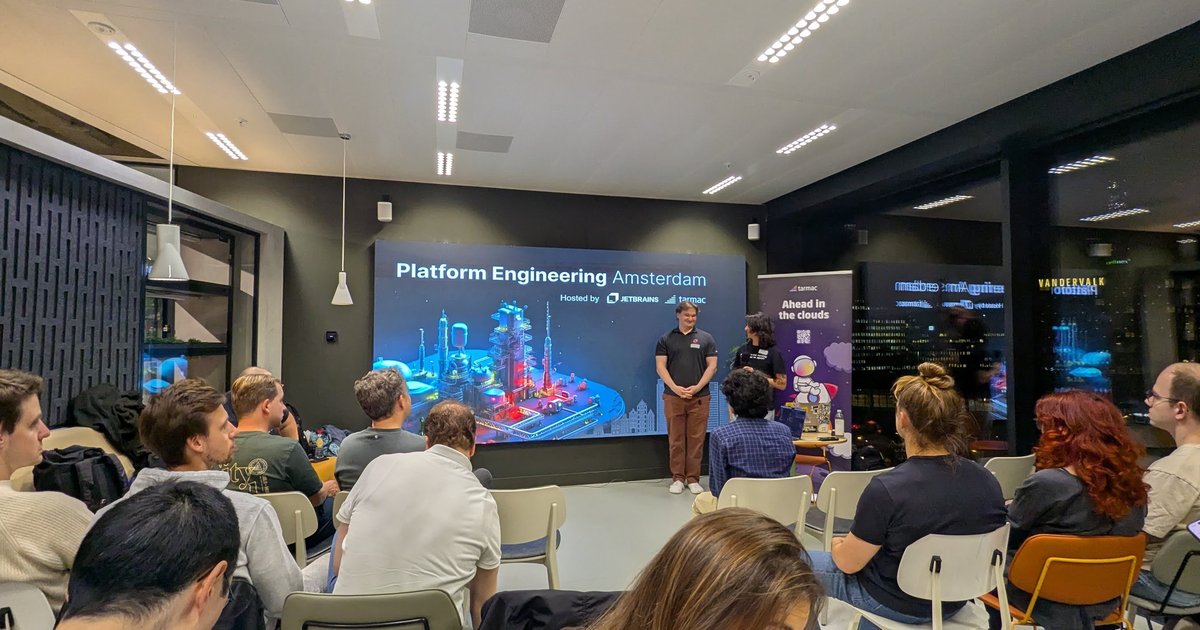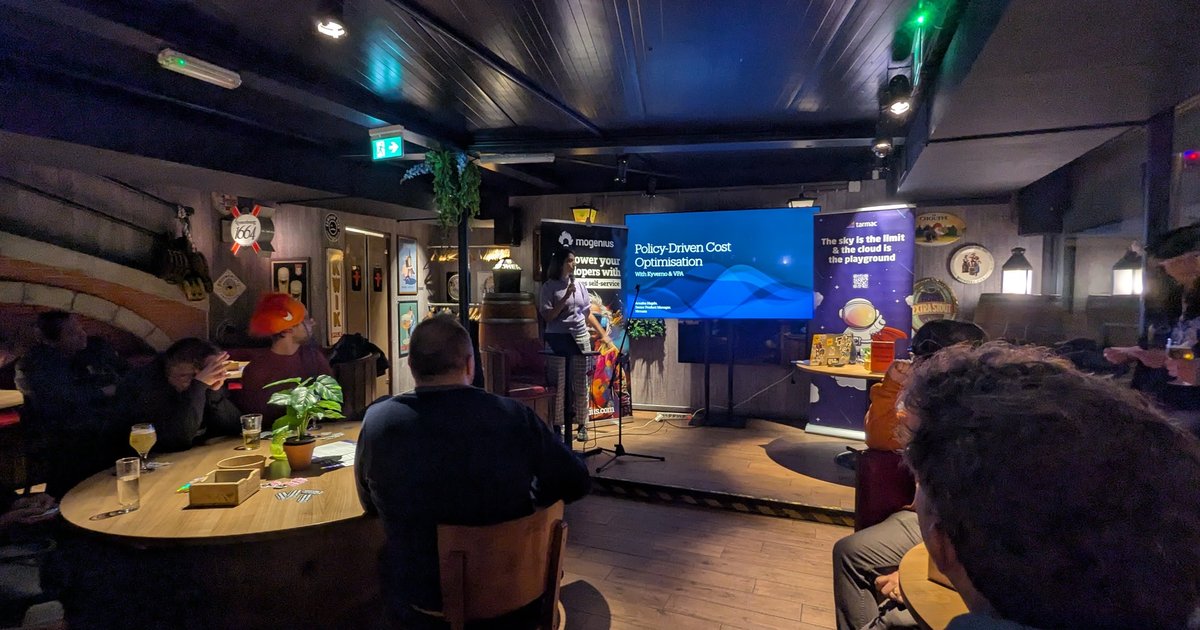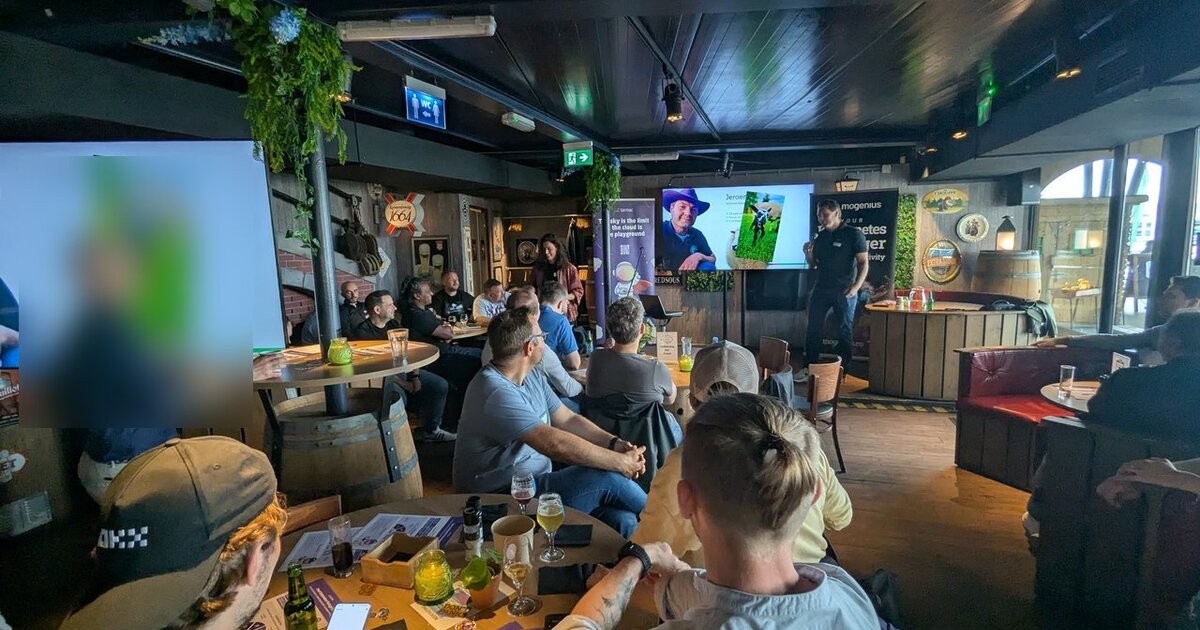
On Wednesday 4 June 2025 I spent the late afternoon and evening at the Platform Engineering MeetUp & BBQ in Amsterdam, the summer edition of the Platform Engineering Amsterdam group. According to the Meetup listing it was organised by the Platform Engineering Amsterdam group at Waterfront on the Piet Heinkade, formerly Delirium Cafe, and tarmac and mogenius roll-ups stood in the room. Doors opened at 17:00, there were three talks, and a BBQ on the terrace followed. I had spent the day at the Red Hat Tech Day, which I covered in Red Hat Tech Day Netherlands 2025.
This is a throwback post, written from my photos, the listing and a short recording. The listed agenda:
| Time | Talk | Speaker (per listing) |
|---|---|---|
| 18:10 | The Evolution of Observability, from ice age to AI | Jeroen Van Erp, Technical Advocate at SUSE |
| 18:35 | Scaffolding the Startup: Zero to Platform Without Blocking the Build | Kris Gillespie, Head of Platform & Security at Silverflow |
| 19:00 | Pricing your infrastructure, how hard could it be? | Malcolm Matalka, CTO at Terrateam |
I only recorded part of the first talk, so the other two are described from slides I photographed.
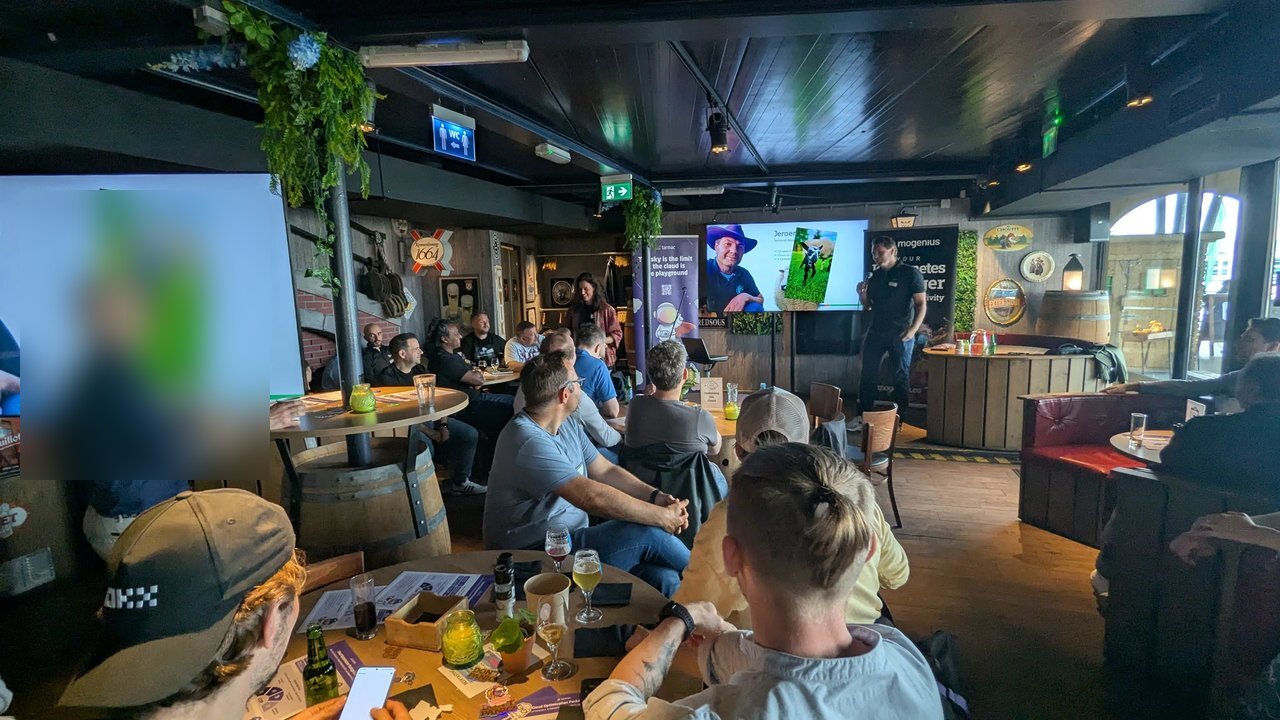
The speaker’s introduction slide on the screens, with the tarmac and mogenius roll-ups beside it. Attendees are blurred.
The evolution of observability, from ice age to AI
The speaker’s introduction slide showed the first name Jeroen and the title technical advocate, and he talked about SUSE Observability, so I match him to the first listed speaker. I recorded only two short clips, from the later part of the talk, where it got to the point of the title: how metrics, logs and traces came together, and what AI can do with them.
- Combine all signals. He mentioned a custom eBPF agent that adds extra data, and said the value comes from combining everything into something actionable. His benchmark is 2 a.m.: “my mind is still asleep”, so if the tool tells you what is going on and how to fix it, you take it.
- Health-based, correlated signals. The slides showed health-based signals and correlated signals. His description: an overview of all your microservices with health states, connected so that you see the problem path, and every signal tied to the component it belongs to: which service, what logs, what metrics, what events, and what health. With that, he said, troubleshooting becomes a breeze and the guessing is taken out.
- Context is the magic word. Once you have this context, which is also what the Model Context Protocol is about, you can start doing AI observability, and the “AI Assistance” slide followed.
- The experiment. He had taken a pre-correlated dashboard from StackState, which he said is now SUSE Observability, and given the screenshot to GPT-4 a year earlier for a talk at Google Cloud Next, asking why a service had gone unhealthy. The answer pointed to a change event shortly before, which was indeed the deployment that made the service fall over. His conclusion was that the model could only know this because all the data was already contextualised.
My take: this matches what I see in practice. An LLM on top of raw telemetry guesses. An LLM on top of correlated, topology-aware data can point at the change that broke something. The investment is in the correlation layer, not in the chat box, and it is the same lesson as the ClickHouse talk in Treblle MCP Meetup Amsterdam 2025.
Scaffolding the startup (slides only)
The photos I took between about 18:55 and 19:05 local time show a deck about a startup platform in a regulated business. I did not capture a title slide or a speaker name, so I cannot say which listed talk it was and I describe the slides without attributing them. The slides were not all fully visible, because someone’s head is in some frames.
- Deeper dive. Platform partitions are self-contained, selected based on latency or data residency requirements, and can be spun up in a matter of days.
- Time for actual observability. The slide listed alerts on errors in logs, TypeScript producing massive stack traces, no bespoke metric collection, no trends and a “one banana problem”. A yellow card asked “can you imagine how noisy it was? Imagine 50+ lines on your phone”, and a second card was headed alert fatigue.
- Focus on DevEx. The results of the initial wins: a simplified and standardised setup, especially networking, reduced cognitive load and developer anxiety and sped up the setup of new regions, and monitoring came “for free” through the new reliability stack.
- People, the hard part. One card on the startup and fintech tension: startups need feature velocity while finance needs compliance and reliability. Another on the human element: tech at a certain point is easy, people are hard.
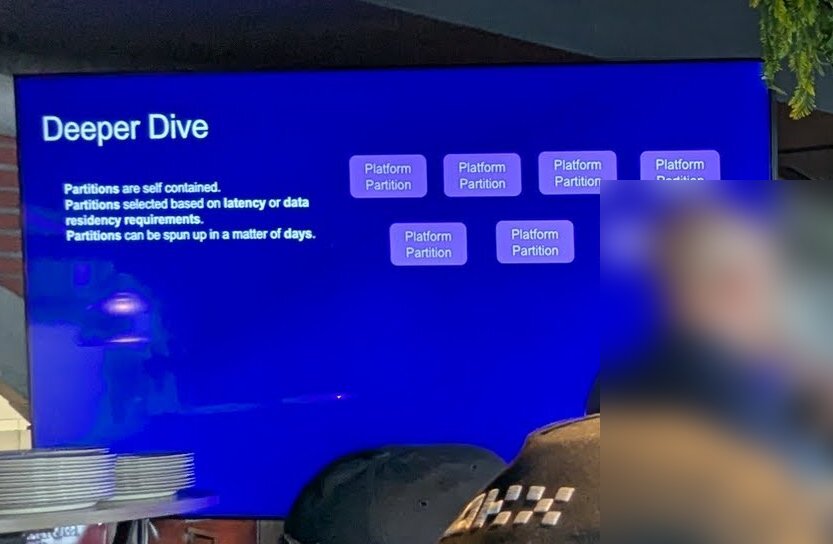
“Deeper Dive”: self-contained partitions per region.
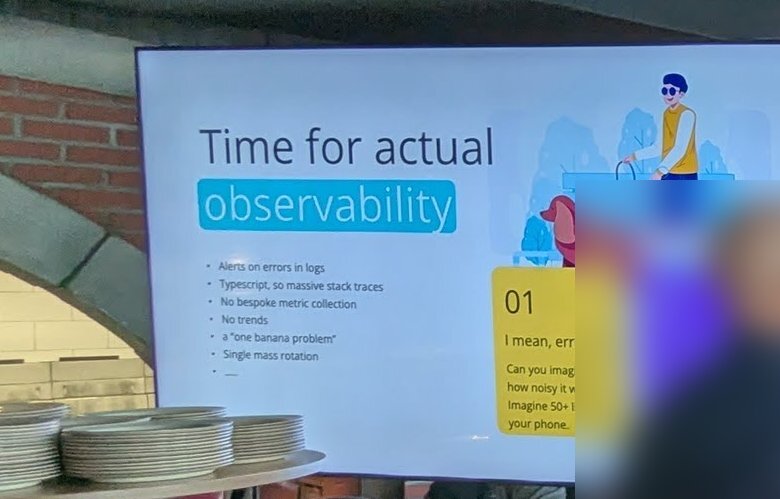
“Time for actual observability”: noisy error logs and alert fatigue as the starting point.
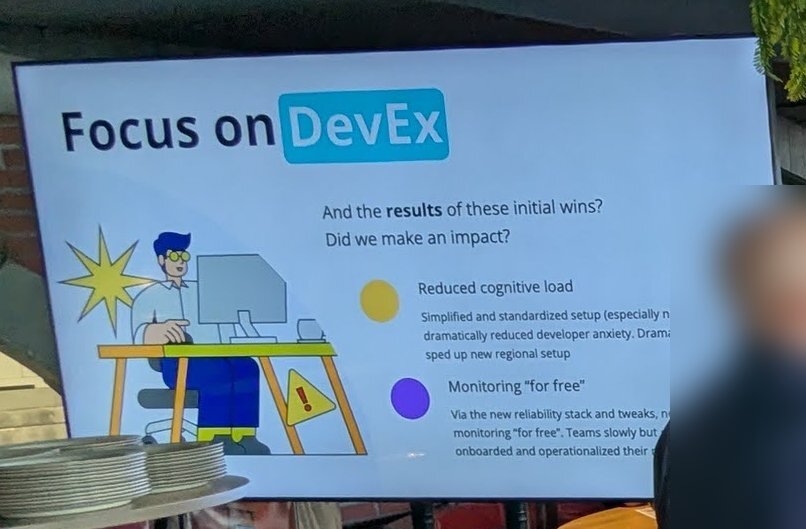
“Focus on DevEx”: the results of the initial wins.
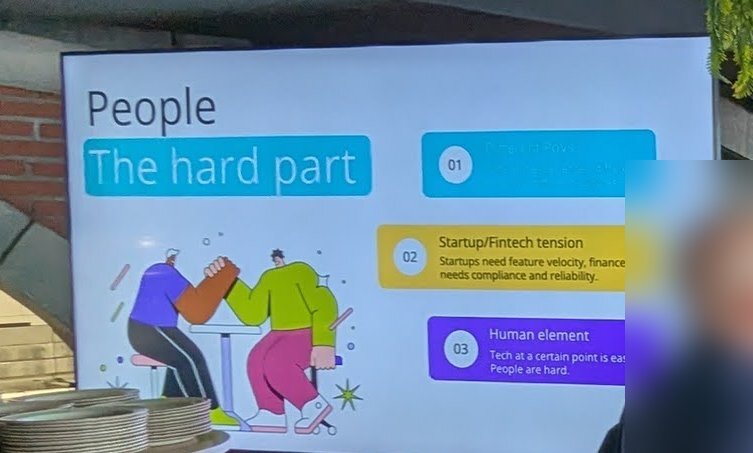
“People, the hard part”.
My take: “tech at a certain point is easy, people are hard” is the line I would put on every platform team’s wall. The slide order, from noisy alerts to DevEx wins to the people problem, is the order most platform teams go through.
Pricing infrastructure (not captured)
The third talk was listed as being by Malcolm Matalka of Terrateam, about OpenInfraQuote, an open-source tool for translating AWS pricing into Terraform cost estimates, according to the listing. I did not record it or photograph its slides, so I have nothing to add. It pairs well with the cost topics in Tergos FinOps Meetup Amsterdam 2025.