On the evening of Tuesday 14 January 2025 I went to a tech meetup at Picnic in Amsterdam. The topic was developer experience. A host opened the evening, three panellists sat on the low stage, and later on the room was asked a question on Slido that I’ve been thinking about ever since: “What metrics can be used to quantify DevEx?”
This post covers what I saw that night and then turns the question into a practical guide: how to measure developer experience with DORA, SPACE and the DevEx framework, without falling into the usual traps.
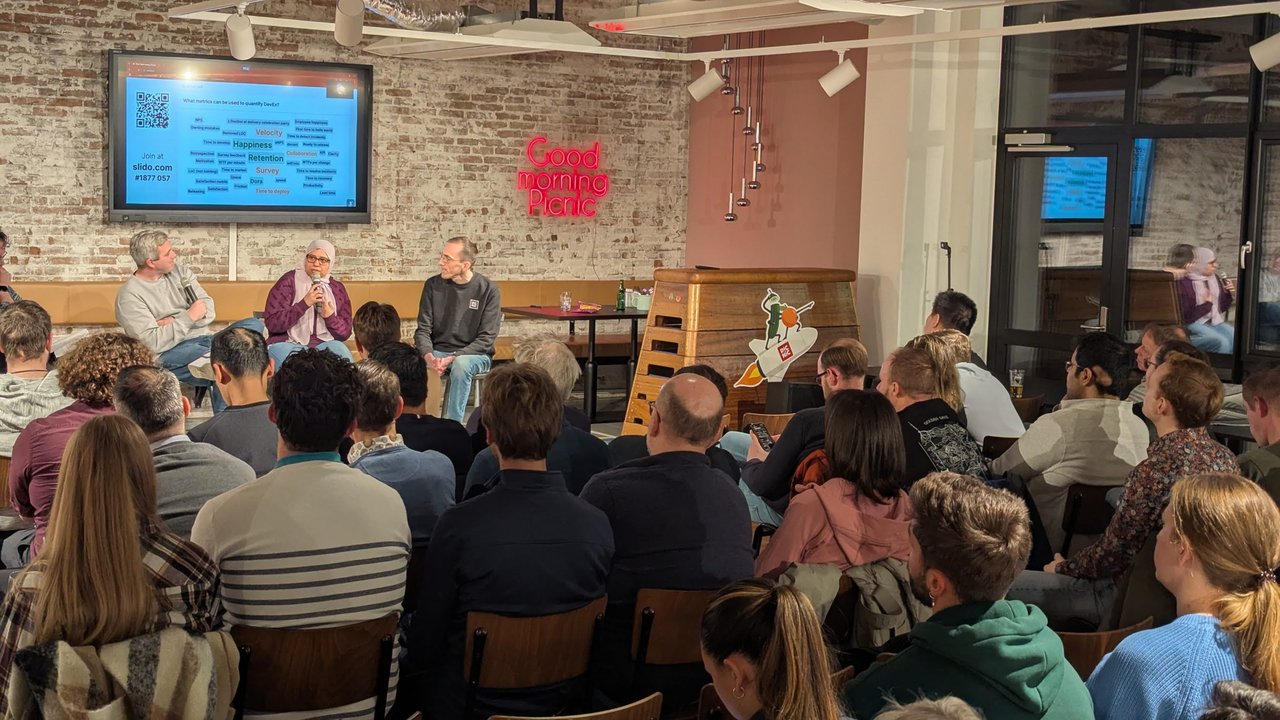
The panel at Picnic, with the audience’s answers to “What metrics can be used to quantify DevEx?” on the screen.
The room at Picnic
The event took place in a large canteen with exposed brick, industrial ducts and rows of wooden school chairs. A red neon sign on the wall read “Good morning Picnic”, and a roll-up banner by the stage said “Tech’s answer to groceries, logistics, deliveries”. Posters of Picnic staff at work hung on the walls, and the dining area next door had long wooden tables with stacks of glasses.
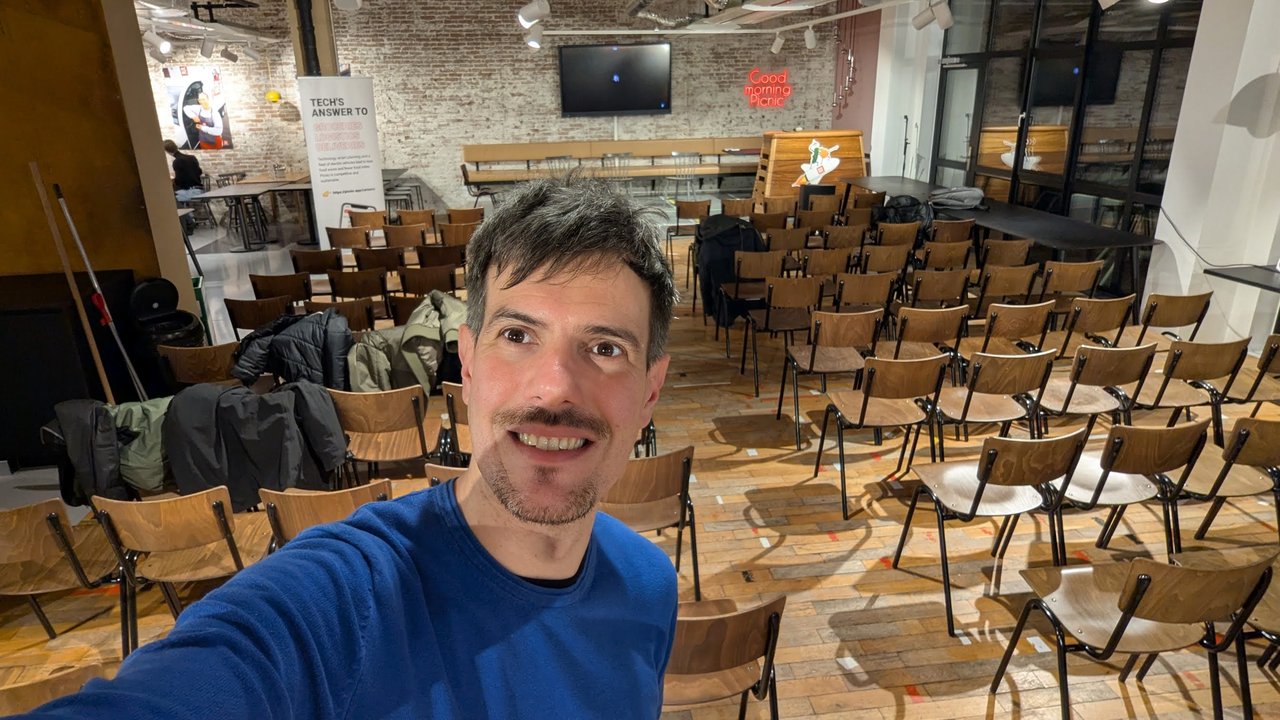
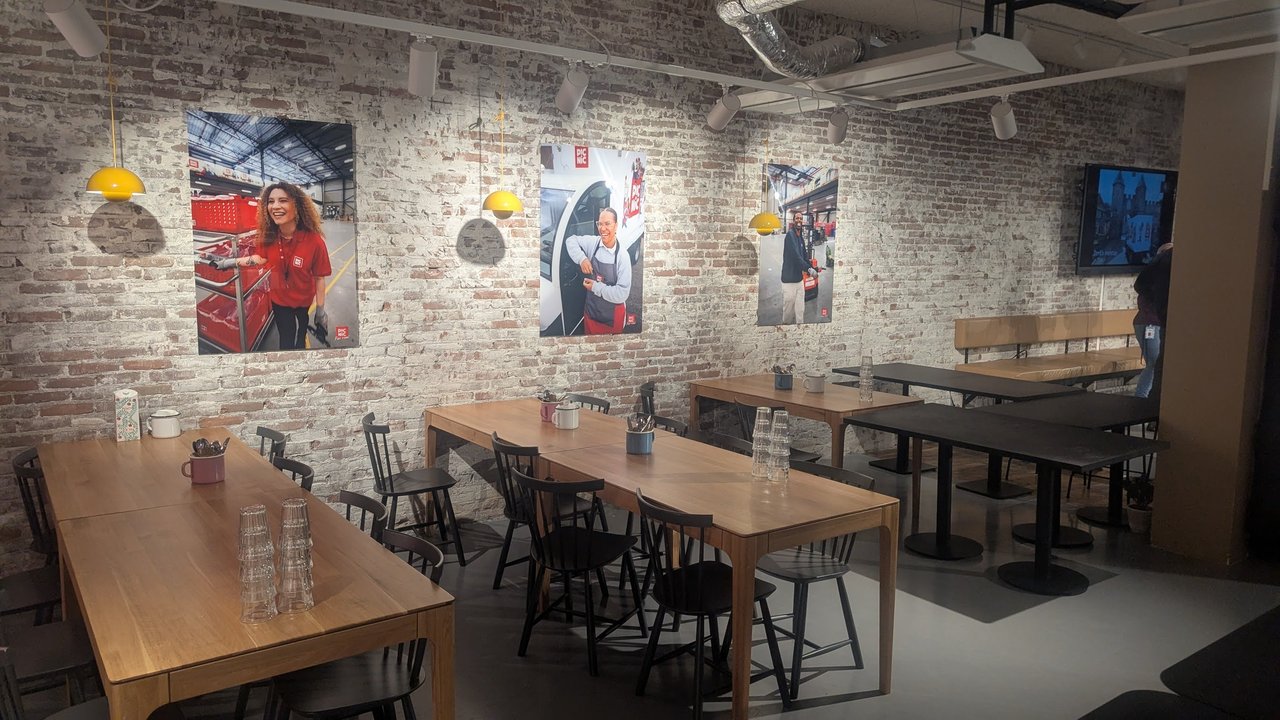
Before the start: rows of empty chairs, and the dining area next door.
By the time the host picked up the microphone, the rows were full. The opening screen had two QR codes: one for the guest Wi-Fi and one for Slido.

The host opens the panel. I’ve blurred the screen because it showed the guest Wi-Fi details.
”What metrics can be used to quantify DevEx?”
Later in the evening, the screen switched to a Slido word cloud. The answers came straight from the audience, and they’re a good snapshot of how practitioners think about the problem. The largest words were Happiness, Retention, Velocity and Survey, followed by Collaboration, Dora, Time to deploy and Motivation.
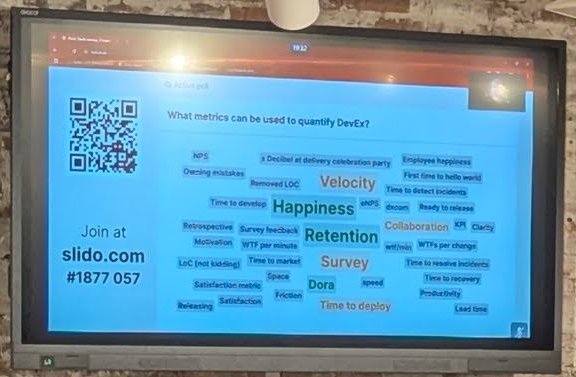
The audience’s answers on Slido. The biggest words were happiness, retention, velocity and survey.
Reading the smaller answers, they fall into a few groups:
- How people feel: happiness, employee happiness, satisfaction, satisfaction metric, motivation, NPS, eNPS, survey and survey feedback.
- Whether people stay: retention and “number of years in a company”.
- Delivery flow: lead time, time to develop, time to deploy, time to market, releasing, ready to release, speed, velocity and Dora.
- Reliability: downtime, time to detect incidents, time to resolve incidents and time to recovery.
- Friction: friction, “first time to hello world”, first time right, and three versions of the same joke: “WTF per minute”, “wtf/min” and “WTFs per change”.
- Team health: collaboration, communication, clarity, decisions, retrospective and “owning mistakes”.
- Output: productivity, efficiency, “LoC (not kidding)” and removed LOC.
There were also a couple of jokes in there: “x Decibel at delivery celebration party” and “Listen for screams”. And two answers named the research frameworks directly: Dora and Space.
My take: the room had the right instincts. Almost nobody suggested measuring developers by output alone, and the one person who wrote “LoC” felt the need to add “(not kidding)”. The interesting tension is between the two biggest words. Happiness and retention are things you ask people about; velocity is something you measure in your systems. A good DevEx measurement programme needs both.
How to measure developer experience
There’s no single DevEx metric, and the three best-known research frameworks each say so in their own way. Here’s what each one measures, according to its primary source, and how I’d combine them.
DORA: how the delivery system performs
DORA currently describes five software delivery performance metrics, split into two groups:
| Group | Metric | What it measures |
|---|---|---|
| Throughput | Change lead time | Time from a commit in version control to that change running in production |
| Throughput | Deployment frequency | Number of deployments in a period, or the time between deployments |
| Throughput | Failed deployment recovery time | Time to recover from a deployment that fails and needs immediate intervention |
| Instability | Change fail rate | Share of deployments that need immediate intervention afterwards |
| Instability | Deployment rework rate | Share of deployments that are unplanned and happen because of a production incident |
DORA measures the delivery pipeline, not how developers feel about it. Its own guidance warns against setting the metrics as targets (Goodhart’s law), against comparing very different applications, and against using them to compete with other teams instead of improving your own over time. The metrics are meant to be applied per application or service.
SPACE: productivity has more than one dimension
The SPACE framework comes from the paper “The SPACE of Developer Productivity” by Nicole Forsgren, Margaret-Anne Storey and colleagues at GitHub, the University of Victoria and Microsoft Research (ACM Queue, 2021). Its five dimensions are:
- Satisfaction and well-being
- Performance
- Activity
- Communication and collaboration
- Efficiency and flow
The paper’s practical advice is the part most teams skip. Capture metrics from at least three dimensions, and make sure at least one is a perceptual measure such as survey data. Adding pull request counts to a commit count doesn’t help, because both are activity metrics. The authors also say activity metrics should never be used in isolation to reward or penalise developers.
The DevEx framework: friction in daily work
The DevEx framework comes from “DevEx: What Actually Drives Productivity” by Abi Noda, Margaret-Anne Storey, Nicole Forsgren and Michaela Greiler (ACM Queue, 2023). It describes developer experience through three dimensions:
- Feedback loops: the speed and quality of responses to actions, such as builds, test runs and code reviews.
- Cognitive load: the mental processing a task requires, which goes up with complex tasks, unfamiliar frameworks and poorly documented code or systems.
- Flow state: energised, immersed focus. The paper links it to fewer interruptions and delays, autonomy, clear goals and challenging work.
The paper measures each dimension in two ways: perceptions (for example, satisfaction with how long it takes to validate a change) and workflows (for example, the time it takes to get CI results). On top of those come a few KPIs, or “North Star metrics”: overall perceived ease of delivering software, employee engagement or satisfaction, and perceived productivity. It also has advice on surveys: design the questions carefully, break results down by team and persona rather than looking only at company-wide averages, add short transactional surveys at specific points in the workflow, and follow up on results so people keep responding. It suggests a quarterly or twice-yearly cadence for most organisations.
Putting it together
Here’s the starter set I recommend to platform teams. It maps neatly onto the answers in the Picnic word cloud:
- Delivery (system data): the five DORA metrics per service. This is the “velocity”, “lead time” and “time to deploy” part of the cloud.
- Friction (system data): CI time to first result, code review turnaround and time to first deploy for a new joiner. This is “first time to hello world”, made measurable.
- Perception (survey): a short quarterly survey that covers the three DevEx dimensions, with one question each on ease of delivery, satisfaction and perceived productivity. This is “happiness”, “satisfaction” and “survey”.
- Outcome (HR data, aggregated): retention and tenure trends for engineering. This is a lagging indicator, so use it to confirm the trend, not to steer week to week.
Then follow three rules. Report at team level, never per person. Watch metrics in pairs, so that faster deployments with a rising change fail rate show up as the warning they are. And publish what you changed because of the last survey before you send the next one.
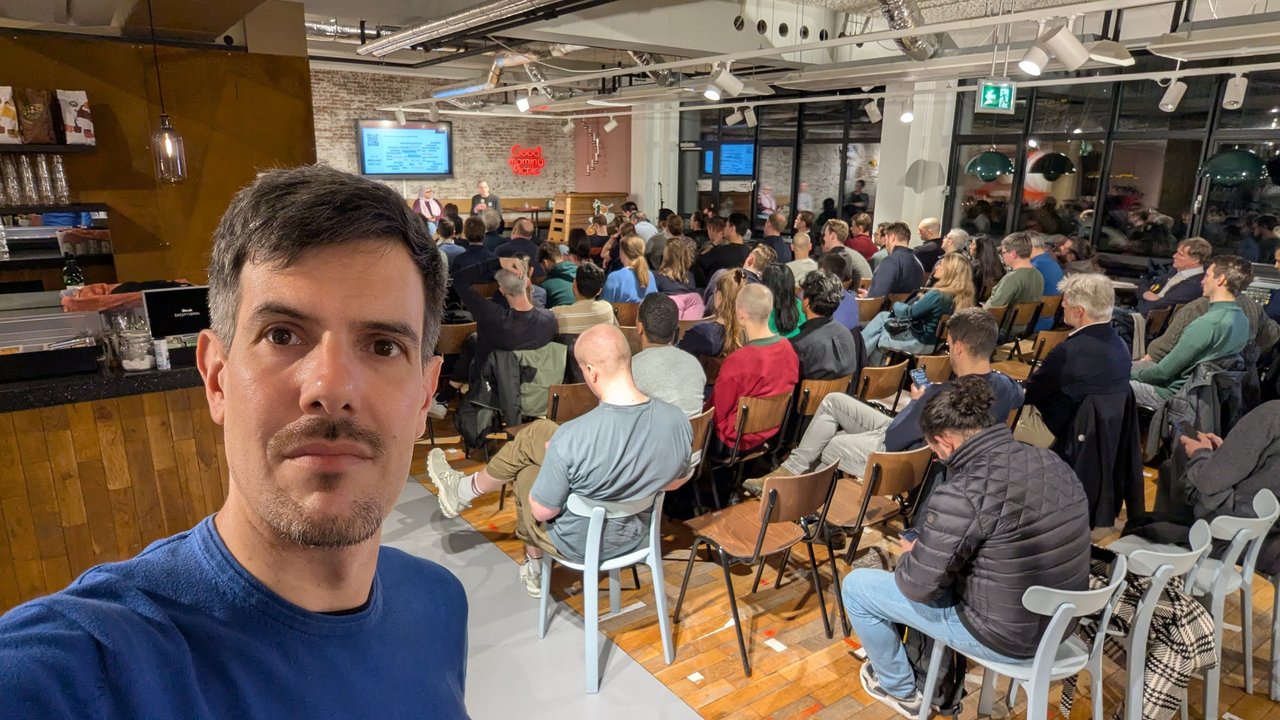
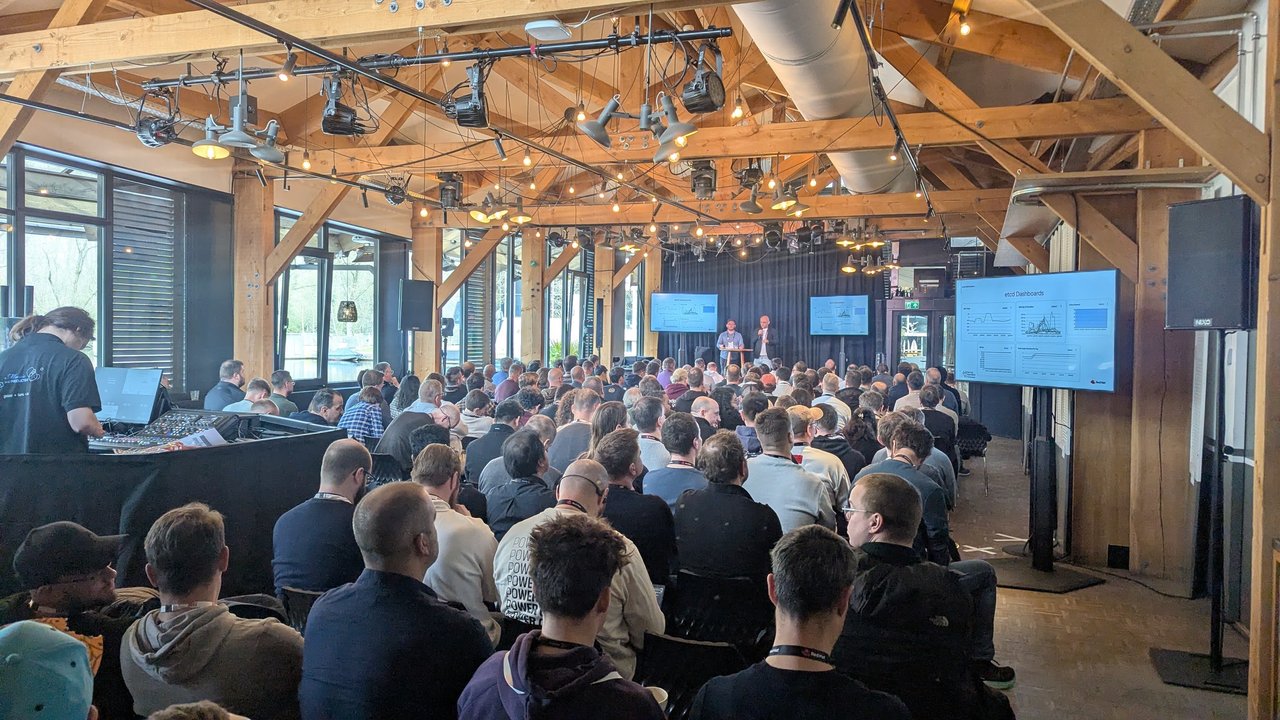
Still a full room later in the evening.
Wrapping up
A packed canteen on a Tuesday night in January says a lot about how much engineers care about this topic. The Slido word cloud was the most useful thing I took home. It showed that the audience already thinks about DevEx in terms of feelings, flow, friction and retention, not lines of code. The frameworks give that instinct a structure: DORA for the delivery system, SPACE to make sure you look at more than one dimension, and the DevEx framework to connect developers’ perceptions to the systems they use every day.

Next to the “Tech’s answer to groceries, logistics, deliveries” banner.