PgBouncer connection pooling is the fix I reach for when a PostgreSQL database starts refusing connections because the application scaled out faster than the database could. This post covers what to configure before your next traffic spike: why raising max_connections is only an emergency fix, how the pool modes differ, which settings matter, how to size pools from your worker and thread counts, and how to watch the pooler while it’s under load.
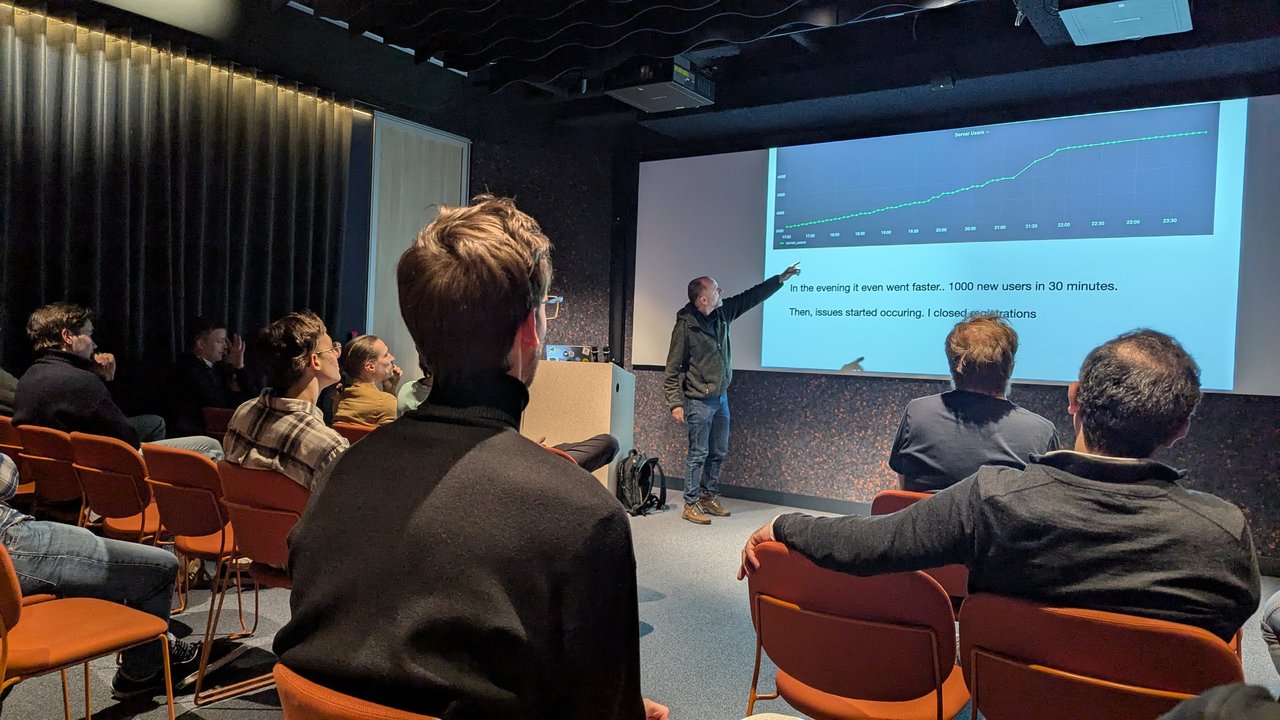
I started thinking about this again after Ruud Schilders’ talk “Mastodon and PostgreSQL, or: … and then November happened!” at a PostgreSQL user meetup in Amsterdam in February 2025. In the talk, adding Sidekiq threads moved the bottleneck to Postgres connections. The first emergency fix was setting max_connections to 800. The next fix was PgBouncer in Docker with max_client_conn=2000 and default_pool_size=500, and later max_client_conn=10000 to absorb peaks. The rest of this post is a general tutorial, not a description of that setup.
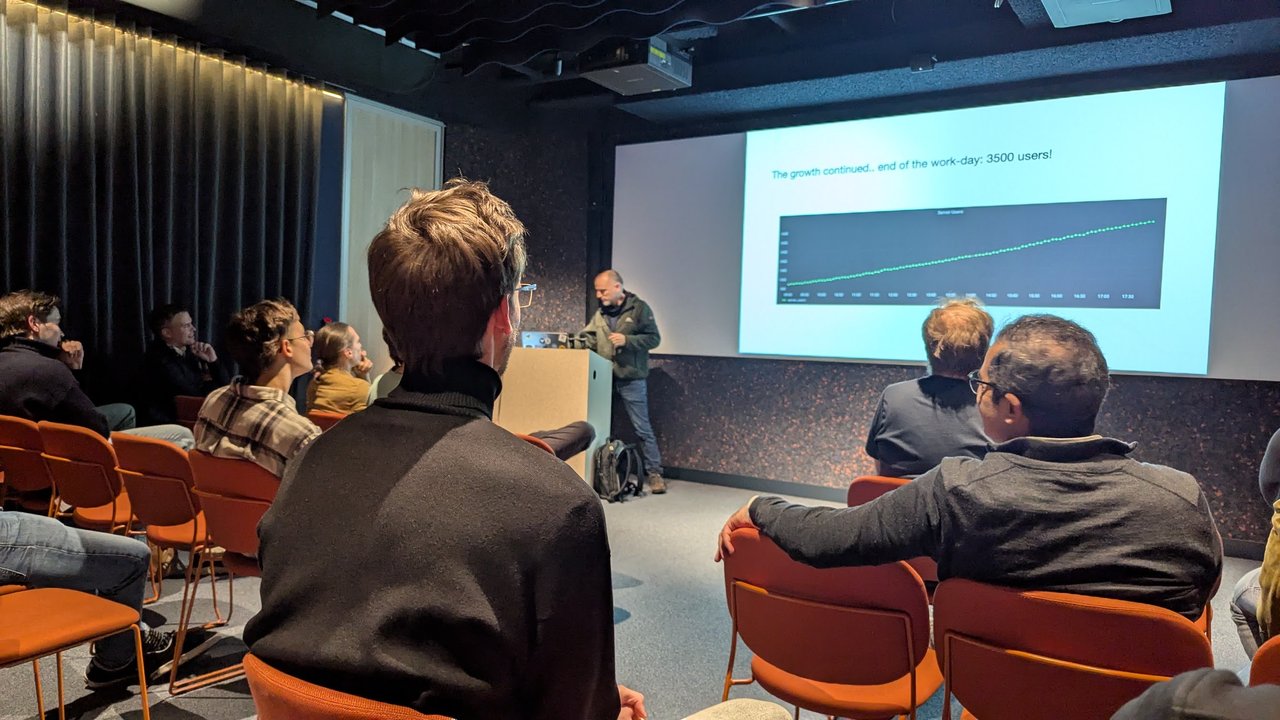
A slide from Ruud Schilders’ “Mastodon and PostgreSQL” talk at the PostgreSQL user meetup in Amsterdam: “The growth continued.. end of the work-day: 3500 users!”, with a server users graph climbing all afternoon.
Settings were checked against the PgBouncer configuration docs, the usage docs and the changelog for PgBouncer 1.26.0 (released 2026-09-23), plus the PostgreSQL 18 docs. I ran the Docker example below locally with PgBouncer 1.24.1 and PostgreSQL 18.
Why raising max_connections is not a strategy
PostgreSQL starts (“forks”) a new server process for each client connection. The max_connections and resource docs point to three costs of turning it up:
- It needs a restart. The parameter “can only be set at server start”, so you change it in the middle of the incident.
- It costs memory even when idle. PostgreSQL sizes some resources, including shared memory, directly from
max_connections. - Active connections multiply
work_mem. Each sort or hash operation can use up towork_mem(4MB by default), a single query can run several of them, and every session can do this at the same time.
And it’s one OS process per connection. My take: once hundreds of backends are runnable on far fewer cores, the kernel spends its time context switching instead of finishing queries, and latency climbs while throughput stays flat.
The connections you need are the ones running a transaction right now. A worker thread waiting on an HTTP call doesn’t need a backend. A pooler lets thousands of clients share a few dozen.
PgBouncer pool modes and their trade-offs
pool_mode decides when a server connection goes back to the pool:
| Mode | Server connection is released | What breaks |
|---|---|---|
session (default) | when the client disconnects | nothing; but long-lived app connections get no sharing |
transaction | when the transaction finishes | session state: SET/RESET, LISTEN, WITH HOLD cursors, SQL PREPARE/DEALLOCATE, session-level advisory locks, LOAD |
statement | when the query finishes | the above, plus multi-statement transactions are disallowed |
The “what breaks” column comes from PgBouncer’s SQL feature map. Workers and web servers keep their connections open, so session mode barely cuts the backend count. For a spike, transaction mode does the work.
Prepared statements in transaction mode
This used to be the main reason to avoid transaction pooling. PgBouncer 1.21.0 (October 2023) added support for protocol-level named prepared statements through the max_prepared_statements setting, which was off by default at the time. Since 1.24.0 (January 2025) it defaults to 200.
PgBouncer then tracks each client’s statements and prepares them on whichever server connection the client gets. Three limits:
- It only covers the protocol-level extended query flow your driver uses. SQL-level
PREPARE,EXECUTEandDEALLOCATEgo straight to Postgres and won’t follow the client across connections.DEALLOCATE ALLandDISCARD ALLare handled. - Setting it to
0turns the support off for transaction and statement pooling. - After a DDL migration that changes a column’s type, you can see
ERROR: cached plan must not change result type. The docs recommend runningRECONNECTon the admin console after the migration.
Since 1.26.0, PgBouncer also tracks every parameter PostgreSQL reports by default, including search_path (PostgreSQL 18+), so a client’s SET search_path no longer leaks to the next client on that server connection.
The settings that matter, with defaults
| Setting | Default | What it controls |
|---|---|---|
max_client_conn | 100 | client connections PgBouncer accepts in total |
default_pool_size | 20 | server connections per user/database pair |
min_pool_size | 0 | keep this many server connections warm |
reserve_pool_size | 0 | extra server connections allowed when clients wait |
reserve_pool_timeout | 5.0 s | how long a client waits before the reserve is used |
max_db_connections | 0 (unlimited) | hard cap on server connections per database |
server_idle_timeout | 600.0 s | close server connections idle this long |
server_lifetime | 3600.0 s | close unused server connections older than this |
query_wait_timeout | 120.0 s | disconnect a client that waited this long for a server |
max_prepared_statements | 200 | prepared statements cached per server connection |

A slide from Ruud Schilders’ “Mastodon and PostgreSQL” talk at the PostgreSQL user meetup in Amsterdam: the 18 November spike, from 30k to 62k users in 12 hours, followed by PgBouncer in Docker with max_client_conn=2000 and default_pool_size=500.
Two things to note. default_pool_size is per user/database pair, so ten app roles against one database can open ten pools. And max_client_conn also drives file descriptors: the docs give the theoretical maximum as max_client_conn + (max pool_size * total databases * total users), so raise ulimit -n to match.
Sizing math from workers and threads
Start from the client side. Every thread that can check out a database connection is a potential PgBouncer client. Sidekiq-style job runners start one process with 5 threads by default, and the Sidekiq docs tell you to set the Active Record pool equal to the thread count.

A slide from Ruud Schilders’ “Mastodon and PostgreSQL” talk at the PostgreSQL user meetup in Amsterdam: Sidekiq’s default of 1 process with 5 threads, a queue of over 350,000 jobs, and the number of threads changed to 200.
Here’s a worked example:
| Source | Count |
|---|---|
| Job workers: 10 processes × 25 threads | 250 |
| Web: 6 pods × 5 threads | 30 |
| Subtotal | 280 |
| ×2 for a rolling deploy (old and new pods overlap) | 560 |
Setting max_client_conn = 1000 per PgBouncer leaves room for that and for a spike in scheduled jobs.
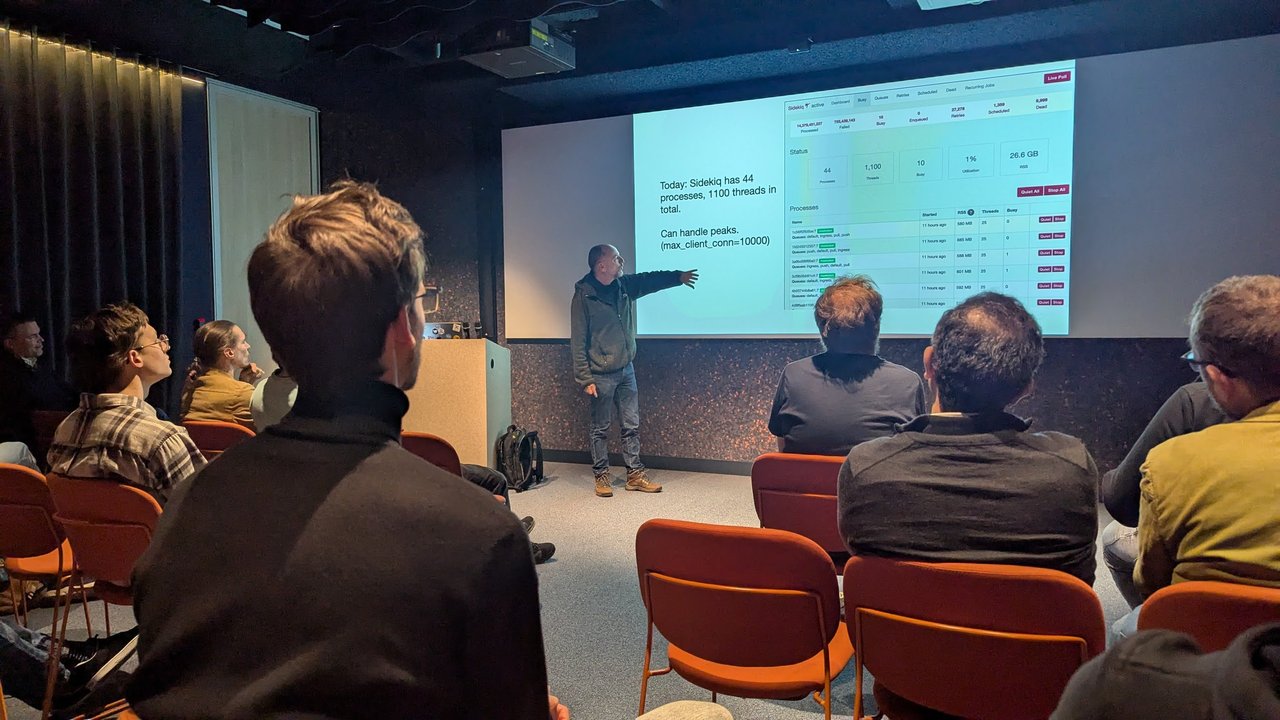
A slide from Ruud Schilders’ “Mastodon and PostgreSQL” talk at the PostgreSQL user meetup in Amsterdam: “Today: Sidekiq has 44 processes, 1100 threads in total. Can handle peaks. (max_client_conn=10000)”.
Then work out the server side, which is what Postgres actually pays for:
- Start with
max_connections(say 200). - Subtract
superuser_reserved_connections(default 3) and whatever you keep for migrations, monitoring, replication and humans (say 20). That leaves 177. - Divide by the number of PgBouncer instances. Each instance has its own pools, so 2 instances means about 88 each.
- Split that into
default_pool_size + reserve_pool_sizeand enforce it withmax_db_connections: for example60 + 15, capped at75. Two instances use at most 150.
My take: start the pool smaller than you think, at a low multiple of the database’s CPU cores, and grow it only while maxwait stays high and the database still has idle CPU. A bigger pool on a saturated database just moves the queue from PgBouncer into Postgres, where it costs more.
Running PgBouncer in Docker
The PgBouncer project only publishes source releases, so use a distribution package or an image you trust. This minimal image uses Debian’s package:
FROM debian:trixie-slim
RUN apt-get update \
 && apt-get install -y --no-install-recommends pgbouncer \
 && rm -rf /var/lib/apt/lists/*
# PgBouncer refuses to run as root
USER postgres
EXPOSE 6432
CMD ["pgbouncer", "/etc/pgbouncer/pgbouncer.ini"]
At the time of writing, Debian trixie ships 1.24.1 with backported security fixes. Check that your package or image includes the fixes for the CVEs listed in the 1.26.0 changelog.
The config, with the sizing from above:
[databases]
app = host=postgres port=5432 dbname=app

[pgbouncer]
listen_addr = 0.0.0.0
listen_port = 6432
auth_type = scram-sha-256
auth_file = /etc/pgbouncer/userlist.txt
admin_users = pgbouncer_admin
stats_users = pgbouncer_stats

pool_mode = transaction
max_client_conn = 1000
default_pool_size = 60
min_pool_size = 10
reserve_pool_size = 15
reserve_pool_timeout = 3
max_db_connections = 75

server_idle_timeout = 600
server_lifetime = 3600
query_wait_timeout = 30
max_prepared_statements = 200
ignore_startup_parameters = extra_float_digits
The lines that matter most for a spike:
pool_mode = transactionis what lets 1,000 clients share 75 backends.reserve_pool_sizeandreserve_pool_timeoutgive you up to 15 extra backends once a client has waited 3 seconds. In a spike, that’s the burst capacity.max_db_connectionsis the ceiling that protects Postgres, whatever the pool settings add up to.query_wait_timeout = 30fails clients after 30 seconds instead of the default 120. A job worker can retry, but a web request that hangs for two minutes is already lost.ignore_startup_parameters = extra_float_digits: PgBouncer rejects startup parameters it doesn’t track unless they’re listed here, and some drivers send this one at login.
For userlist.txt, copy the SCRAM secret from Postgres. PgBouncer can only use a SCRAM secret to log in to the server if it is identical to the one in pg_authid and the client also authenticates with SCRAM:
psql -U postgres -Atc \
  "SELECT format('\"%s\" \"%s\"', rolname, rolpassword) FROM pg_authid WHERE rolname = 'app'" \
> userlist.txtservices:
pgbouncer:
build: .
ports: ["6432:6432"]
ulimits:
nofile: { soft: 65536, hard: 65536 }
volumes:
- ./pgbouncer.ini:/etc/pgbouncer/pgbouncer.ini:ro
- ./userlist.txt:/etc/pgbouncer/userlist.txt:roAt startup PgBouncer logs the file descriptor limit next to the “max expected fd use”; check it. Change settings by editing the file and running RELOAD; as an admin user. Users listed only in stats_users get ERROR: admin access needed.
PgBouncer is single-threaded, so one process uses one CPU core. If it becomes CPU-bound, the docs describe running several processes on one port with so_reuseport.
Kubernetes: sidecar vs central pooler
Sidecar. One PgBouncer per application pod, as a native sidecar (an initContainers entry with restartPolicy: Always, on by default since Kubernetes 1.29). The app connects to 127.0.0.1:6432: no extra hop, nothing shared to fail. The catch is that pools multiply with replicas: 30 pods × default_pool_size 20 can open 600 server connections, and when the autoscaler adds pods in a spike it adds backends too. If you go this way, keep the per-pod pool tiny.
Central. A small Deployment of PgBouncer instances behind a Service. The backend count is instances × pool, and it doesn’t change when the app scales. With CloudNativePG this is the Pooler resource. I covered the basics in CloudNativePG: Production PostgreSQL on Kubernetes. Here’s a version tuned for spikes:
apiVersion: postgresql.cnpg.io/v1
kind: Pooler
metadata:
  name: app-pooler-rw
spec:
  cluster:
    name: app-db
  instances: 2
  type: rw
  pgbouncer:
    poolMode: transaction
    parameters:
      max_client_conn: "1000"
      default_pool_size: "60"
      reserve_pool_size: "15"
      reserve_pool_timeout: "3"
      max_db_connections: "75"
      query_wait_timeout: "30"
      max_prepared_statements: "200"
CloudNativePG reloads PgBouncer when the parameters change, and it doesn’t validate their values, so test changes in staging first. My take: use a central pooler by default, and use sidecars only when the per-hop latency really matters and the replica count is bounded.
Monitoring with SHOW POOLS and SHOW STATS
Connect to the admin console as a stats_users or admin_users member:
psql -h pgbouncer -p 6432 -U pgbouncer_stats pgbouncer -c 'SHOW POOLS;'
psql -h pgbouncer -p 6432 -U pgbouncer_stats pgbouncer -x -c 'SHOW STATS;'
In SHOW POOLS, check these columns:
cl_waiting: clients that sent a query and have no server yet. Zero is normal. A sustained non-zero value is your spike signal.maxwait/maxwait_us: how long the oldest waiting client has waited. The docs say that if this grows, either the server is overloaded or the pool is too small.sv_activevssv_idle: ifsv_activeis pinned atdefault_pool_size + reserve_pool_sizewithsv_idleat 0, the pool is saturated.
In SHOW STATS, watch avg_wait_time (microseconds clients waited for a server) next to avg_xact_time. When transaction time goes up along with wait time, the database is the bottleneck, and a bigger pool won’t help. total_client_parse_count vs total_server_parse_count shows how much prepared statement reuse you get. On 1.26+, total_client_login_count exposes clients that reconnect constantly instead of keeping their connection open.
On CloudNativePG, the Pooler pods export these on port 9127 as cnpg_pgbouncer_pools_cl_waiting, cnpg_pgbouncer_pools_maxwait and the cnpg_pgbouncer_stats_* series. Alert on maxwait staying above a second for a few minutes. Pair that with query-level visibility on the database side, which default exporters lack (see the PostgreSQL monitoring gap).
Common pitfalls
FATAL: query_wait_timeouton clients means they queued longer than the timeout. I reproduced it locally by sending 400 write-heavy pgbench clients through a 50-connection pool. Checkmaxwaitand database CPU before raising the pool.- Session features over transaction pooling.
SET,LISTEN,WITH HOLDcursors and session advisory locks behave unpredictably. The Rails guide says you might needadvisory_locks: falsebehind PgBouncer. Run migrations against Postgres directly or through a session-mode pool. - Forgetting per-instance math. Two PgBouncers with
default_pool_size = 100can open 200 backends. - Upgrades. Check pooler compatibility before a minor version upgrade, as in the RDS PostgreSQL deprecation guide.