The OpenTelemetry transform processor is where most Collector configs end up doing their real work: removing a secret before it leaves the cluster, fixing a span name that explodes cardinality, turning a JSON log line into structured fields. It runs statements written in OTTL, the OpenTelemetry Transformation Language, and its sibling, the filter processor, uses the same language to drop data. This post is a cookbook: 15 recipes I ran against a real Collector, then the parts that bite (contexts, error_mode, ordering, nil values) and how to test a statement before it touches production.
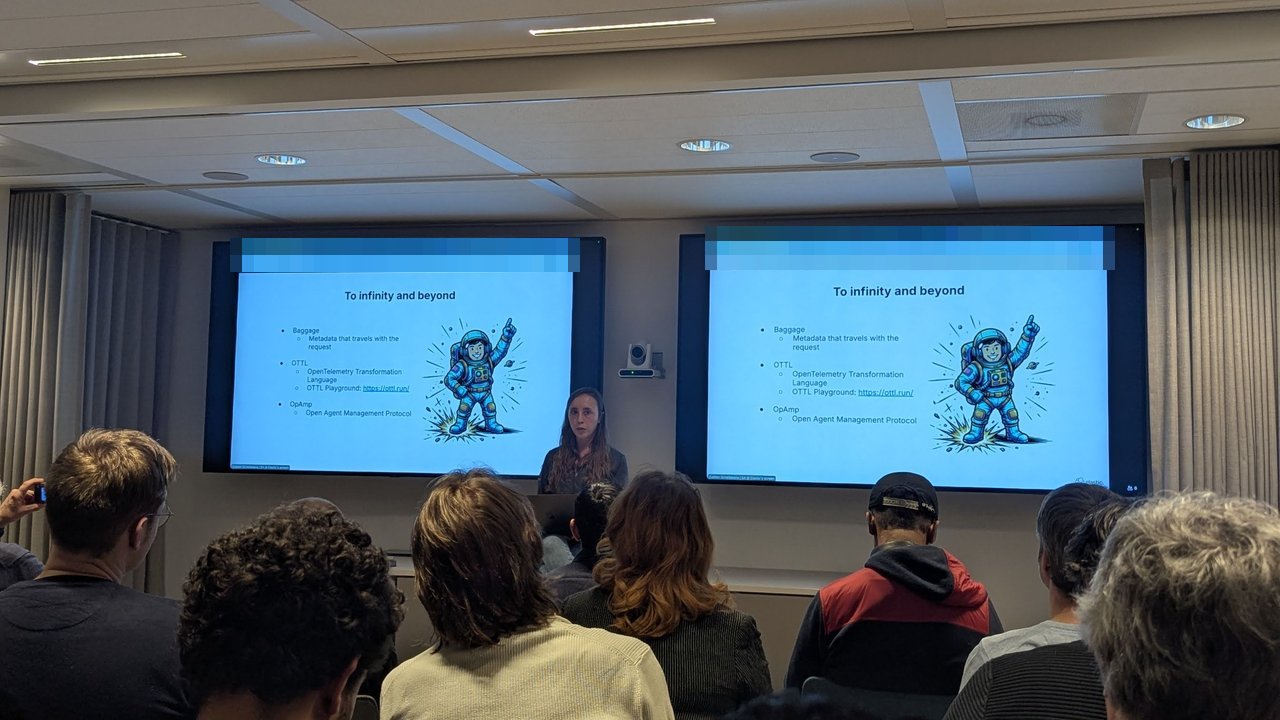
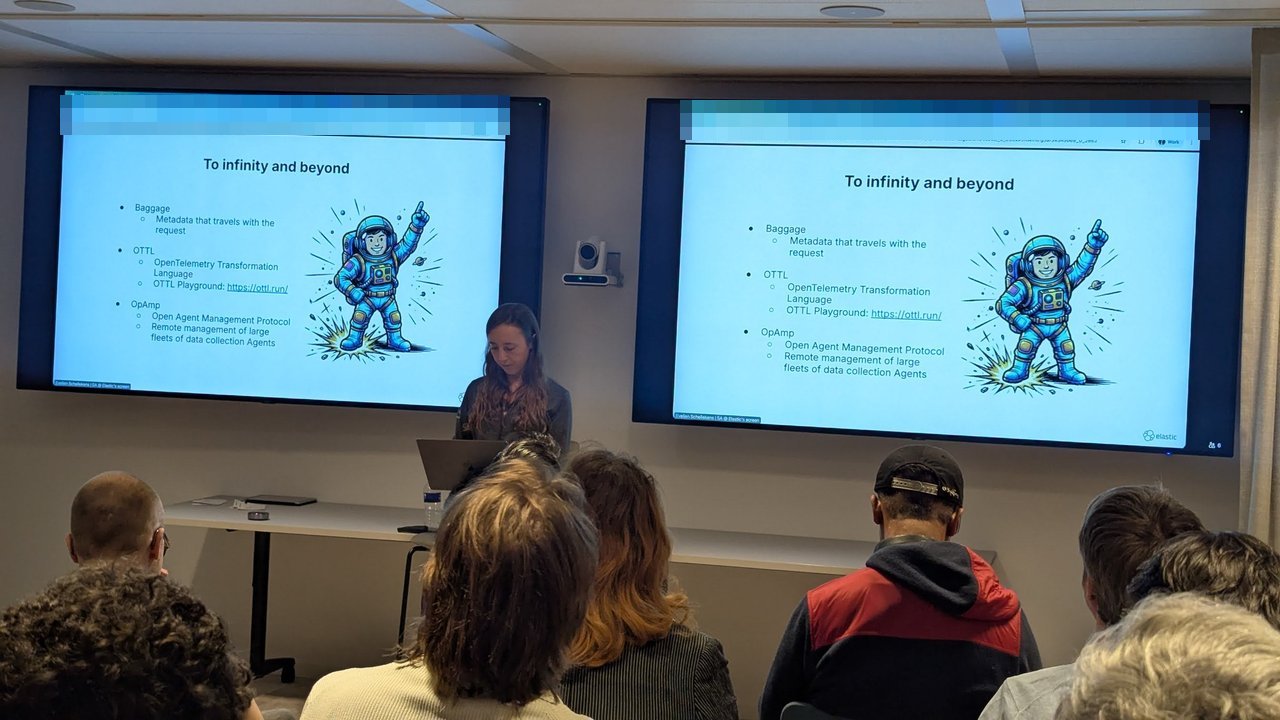
In February I was at the SRE NL meetup at Elastic Amsterdam. In the OpenTelemetry talk, Evelien Schellekens put OTTL on her “To infinity and beyond” slide, next to Baggage and OpAMP. She said it’s used in a processor or a connector to drop and add fields, and pointed to the community OTTL playground at ottl.run, which Elastic engineers help maintain. I’ve already written up OpAMP. This post covers OTTL.
Versions: I tested everything with the otel/opentelemetry-collector-contrib:0.161.0 Docker image (otelcol-contrib version 0.161.0), and checked every function and path against the v0.161.0 READMEs of the transform processor, the filter processor, the OTTL functions and the routing connector. The transform processor is beta for traces, metrics and logs. The filter processor and the routing connector are alpha.
How the OpenTelemetry transform processor runs OTTL
A statement is a function call with an optional where condition:
- set(span.attributes["team"], "payments") where resource.attributes["service.name"] == "checkout"- Editors change data:
set,delete_key,keep_keys,replace_pattern,merge_maps,truncate_all. - Converters return values:
SHA256,ParseJSON,Concat,Substring,IsMatch,Len. - Paths start with a context name:
resource.,scope.,span.,spanevent.,metric.,datapoint.,log.. The processor infers the context from those prefixes, so a statement that only usesresource.paths, such asset(resource.attributes["x"], "y"), runs once per resource, not once per span. - In the transform processor, statements under
trace_statements,metric_statementsandlog_statementsrun in the order you write them. In the filter processor, conditions undertrace_conditions,metric_conditionsandlog_conditionsare ORed, and anything that matches is dropped.
The test bench
Every recipe below ran in this loop: write a config, validate it, start the Collector with the debug exporter at verbosity: detailed, send a hand-written OTLP/HTTP JSON payload with curl, and read what came out.
# 1. Fail fast on syntax and context errors
docker run --rm -v "$PWD":/cfg otel/opentelemetry-collector-contrib:0.161.0 \
  validate --config=/cfg/logs.yaml

# 2. Run it, OTLP/HTTP on localhost only
docker run --rm --name ottl-lab -p 127.0.0.1:4318:4318 \
  -e OTTL_HASH_SALT=change-me \
  -v "$PWD":/cfg otel/opentelemetry-collector-contrib:0.161.0 --config=/cfg/logs.yaml

# 3. Send one payload and read the debug exporter output in the container logs
curl -s -H 'Content-Type: application/json' --data @logs.json \
  http://127.0.0.1:4318/v1/logs
A minimal logs.json with one JSON-formatted log line:
{"resourceLogs":[{"resource":{"attributes":[{"key":"service.name","value":{"stringValue":"auth"}}]},
 "scopeLogs":[{"scope":{"name":"app"},"logRecords":[
  {"body":{"stringValue":"{\"level\":\"error\",\"msg\":\"login failed: bad password\",\"user_id\":\"u-2002\",\"route\":\"/login\"}"}}
 ]}]}]}
The receiver and exporter around each recipe are the usual ones:
receivers:
  otlp:
    protocols:
      http:
        endpoint: 0.0.0.0:4318
exporters:
  debug:
    verbosity: detailed
Hand-written payloads beat a load generator here, because each recipe needs a specific shape: a query string with a token, a body that is JSON, a span with an ID in its name.
Trace recipes
1. Fill in missing resource attributes
transform/resource:
  error_mode: ignore
  trace_statements:
    - set(resource.attributes["service.name"], resource.attributes["k8s.deployment.name"]) where IsMatch(resource.attributes["service.name"], "^unknown_service") and resource.attributes["k8s.deployment.name"] != nil
    - set(resource.attributes["service.namespace"], "shop") where resource.attributes["service.namespace"] == nil
    - set(resource.attributes["cloud.region"], "eu-west-1") where resource.attributes["cloud.region"] == nil
The first statement replaces the SDK default unknown_service:java with the Deployment name, if k8sattributes added one. The other two set defaults without overwriting a value the SDK already sent. Result: service.name: Str(checkout), plus the two defaults.
2. Redact secrets in a query string
transform/spans:
  error_mode: ignore
  trace_statements:
    - context: span
      statements:
        - replace_pattern(span.attributes["url.query"], "(?i)(token|api_key)=[^&]*", "$$1=REDACTED")
        # recipes 3 to 6 continue in this same list
cart=42&token=s3cr3t&API_KEY=abc became cart=42&token=REDACTED&API_KEY=REDACTED. The $$1 is a capture group reference. The Collector expands $ in config files, so OTTL’s $1 must be written as $$1.
3. Hash one value in place
- replace_pattern(span.attributes["url.full"], "user=([^&]+)", "$$1", SHA256, "user=%s")replace_pattern accepts an optional converter and a format string. Here only the captured user name is hashed, and the rest of the URL stays readable: ...items?user=alice became ...items?user=2bd806c9...6e90, which matches printf alice | shasum -a 256.
This is the statement that taught me the first pitfall in this post. In a basic, ungrouped statement list, validate failed with inferred context "span" does not support the enum symbol "SHA256". The context inferrer reads a bare SHA256 as an enum. Putting the statements in a group with an explicit context: span, as above, fixes it.
4. Rename legacy attribute keys
        - replace_all_patterns(span.attributes, "key", "^http\\.status_code$$", "http.response.status_code")
        - replace_all_patterns(span.attributes, "key", "^http\\.method$$", "http.request.method")
In "key" mode the regex runs against attribute names, not values, so old semantic-convention keys from an outdated SDK land under the current names, with their values and types unchanged (http.response.status_code: Int(503)). Anchor the regex, or http.method would also match keys that merely contain it. Note the $$ again: it’s an escaped regex anchor.
5. Normalise client span names that contain IDs
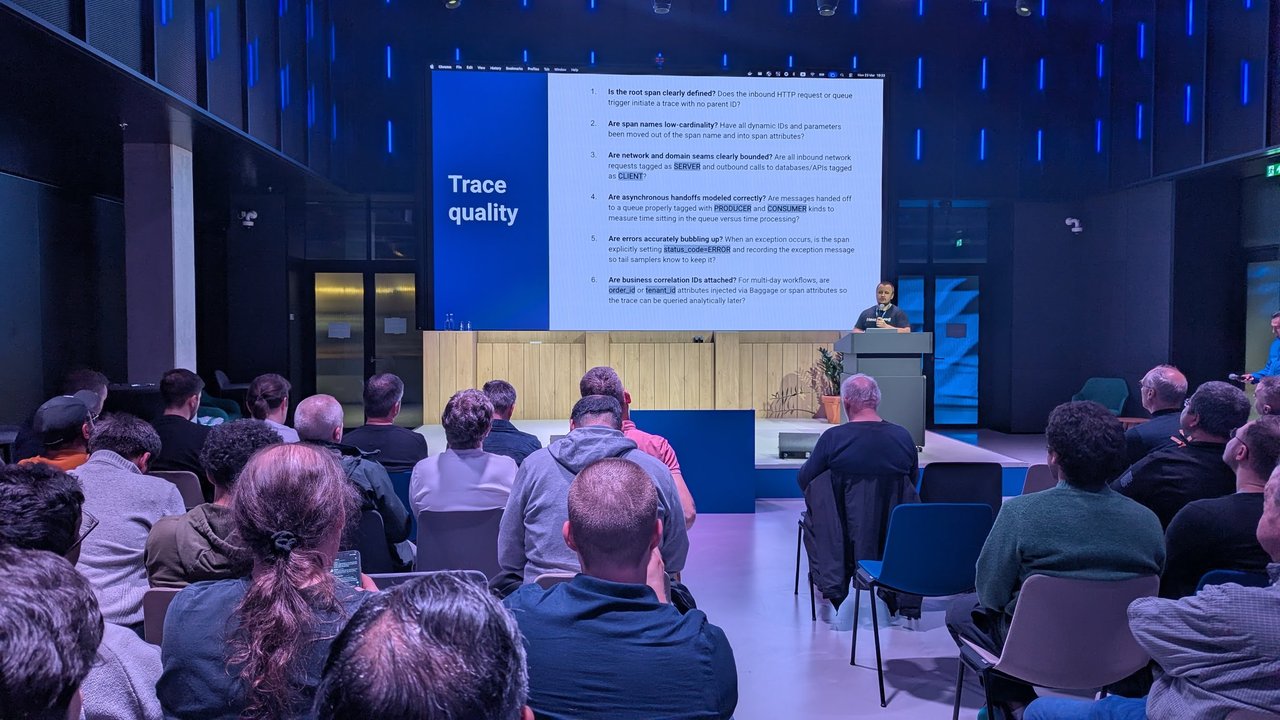
- replace_pattern(span.name, "/[0-9]+(/|$$)", "/{id}$$1") where span.kind == SPAN_KIND_CLIENTGET /api/orders/12345/items became GET /api/orders/{id}/items. My trace quality checklist rebuilds server span names from http.route. This is the fallback for client spans, which usually have no route to rebuild from.
6. Mark 5xx server spans as errors
- set(span.status.code, STATUS_CODE_ERROR) where span.kind == SPAN_KIND_SERVER and span.attributes["http.response.status_code"] >= 500Most instrumentation already does this. When a hand-rolled middleware doesn’t, error-based sampling and alerts miss those requests. This statement depends on recipe 4 running first, because it reads the new key name.
7. Drop health-check spans
filter/healthchecks:
  error_mode: ignore
  trace_conditions:
    - span.kind == SPAN_KIND_SERVER and IsMatch(span.attributes["url.path"], "^/(healthz|readyz|livez)$$")
The /healthz span never reached the exporter, and the other two spans in the payload did. The filter README warns that dropping a parent span orphans its children. Probe endpoints are usually single-span traces, so this is safe for them. For anything with children, use a tail-sampling drop policy instead, as in the checklist post.
Log recipes
The log recipes are one transform/logs processor. I show them in the order they run, because later statements read what earlier ones wrote.
8. Parse a JSON log body into attributes
transform/logs:
  error_mode: ignore
  log_statements:
    - merge_maps(log.cache, ParseJSON(log.body), "upsert") where IsString(log.body) and IsMatch(log.body, "^\\s*\\{")
    - set(log.attributes["user.id"], log.cache["user_id"]) where log.cache["user_id"] != nil
    - set(log.attributes["http.route"], log.cache["route"]) where log.cache["route"] != nil
    - set(log.severity_text, log.cache["level"]) where log.cache["level"] != nil
    - set(log.body, log.cache["msg"]) where log.cache["msg"] != nil
Parse into log.cache, a scratch map that isn’t exported, then copy only the fields you want. Merging the whole parsed object straight into log.attributes is shorter, but it lets any application add any number of attribute keys. The where guard skips plain-text lines, so ParseJSON never sees them. After this step the body is login failed: bad password, not the raw JSON.
Every set here has a != nil guard, and it isn’t decoration. See the nil pitfall below.
9. Map severity text to severity number
    - set(log.severity_number, SEVERITY_NUMBER_DEBUG) where log.severity_number == 0 and IsMatch(ToLowerCase(log.severity_text), "^(debug|trace)$$")
    - set(log.severity_number, SEVERITY_NUMBER_INFO) where log.severity_number == 0 and IsMatch(ToLowerCase(log.severity_text), "^info")
    - set(log.severity_number, SEVERITY_NUMBER_WARN) where log.severity_number == 0 and IsMatch(ToLowerCase(log.severity_text), "^warn")
    - set(log.severity_number, SEVERITY_NUMBER_ERROR) where log.severity_number == 0 and IsMatch(ToLowerCase(log.severity_text), "^(err|error)$$")
    - set(log.severity_number, SEVERITY_NUMBER_FATAL) where log.severity_number == 0 and IsMatch(ToLowerCase(log.severity_text), "^(fatal|critical|panic)$$")
Backends filter and alert on severity_number, not on whatever string the logging library printed. "INFO" became Info(9) and "error" became Error(17). The == 0 check leaves records that already had a number alone. OTTL also has a ParseSeverity converter, which maps strings or numeric ranges (such as "5xx") to a level name. It returns a string, so you still need statements like these to set the number.
10. Hash a user ID with a salt
- set(log.attributes["user.id"], SHA256(Concat([log.attributes["user.id"], "${env:OTTL_HASH_SALT}"], ""))) where log.attributes["user.id"] != nilMy OpAMP post hashed an email with plain SHA256 and then warned that an unsalted hash can be reversed with a list of known values. This is the salted version. The Collector expands ${env:OTTL_HASH_SALT} when it loads the config, so the salt is never in the file. With OTTL_HASH_SALT=lab-salt, u-2002 became 2d388ebf...2356, the same as printf 'u-2002lab-salt' | shasum -a 256. You can still count unique users and join on the hash across signals that use the same salt. Keep the salt out of git, and don’t put a " in it, because it’s inserted into a quoted OTTL string.
11. Truncate oversized log bodies
- set(log.body, Concat([Substring(log.body, 0, 8192, true), "...[truncated]"], "")) where IsString(log.body) and Len(log.body) > 8192truncate_all only works on maps, such as attributes, so a body needs Substring. Its optional fourth argument, utf8_safe, stops it from cutting a multi-byte character in half. The Len guard matters: Substring returns an error if the length runs past the end of the string. In the lab I used 64 instead of 8192 so a Python traceback got cut visibly, ending in line 4...[truncated].
12. Drop noisy logs
filter/noisy-logs:
  error_mode: ignore
  log_conditions:
    - scope.name == "sqlalchemy.engine" and log.severity_number < SEVERITY_NUMBER_WARN
    - IsString(log.body) and IsMatch(log.body, "\"GET /(healthz|readyz) HTTP/1\\.1\" 200")
The first condition targets one chatty library by its instrumentation scope and keeps its warnings. A DEBUG SELECT 1 was dropped, and a WARN pool exhausted from the same scope got through. The second drops successful probe lines from access logs. Both are narrower than dropping everything below INFO. The filter README’s advice is to make conditions as specific as possible, so you lower the risk of dropping the wrong data.
13. Tag records, then route them with a connector
    # last statement in transform/logs
    - set(log.attributes["route"], "security") where log.attributes["http.route"] == "/login" and log.severity_number >= SEVERITY_NUMBER_WARN

connectors:
  routing/logs:
    default_pipelines: [logs/default]
    table:
      - condition: log.attributes["route"] == "security"
        pipelines: [logs/security]

service:
  pipelines:
    logs/in:
      receivers: [otlp]
      processors: [filter/noisy-logs, transform/logs]
      exporters: [routing/logs]
    logs/default:
      receivers: [routing/logs]
      exporters: [debug]
    logs/security:
      receivers: [routing/logs]
      exporters: [debug/security]
The transform writes a routing hint, and the routing connector reads it. You could put the whole condition in the routing table instead. I prefer a hint attribute because it shows up in the data, so you can see later why a record went where it did. In the lab, debug/security received one record, the failed login, and debug received the other three. The default action is move. Use action: copy if the record should also continue through later routes.
Metric recipes
14. Rename a metric and convert its unit
transform/metrics:
  error_mode: ignore
  metric_statements:
    - set(metric.name, "http.server.request.duration") where metric.name == "http_server_duration_ms"
    - scale_metric(0.001, "s") where metric.name == "http.server.request.duration" and metric.unit == "ms"
A value of 250 in ms came out as 0.25 in s under the semantic-convention name. scale_metric supports Gauge, Sum, Histogram and Summary. My test metric was a gauge. The README’s identity-conflict warning applies here: a rename changes the series identity, so dashboards and alerts on the old name stop matching.
15. Drop a high-cardinality attribute without duplicate series
- aggregate_on_attributes("sum", ["http.route", "http.response.status_code"]) where metric.name == "http.server.requests"If you just delete_key a per-client attribute from a counter, you get several data points with identical attributes, and backends handle those badly. aggregate_on_attributes keeps only the listed keys and merges the points that now match. Three points (3 and 5 for status 200 from two client addresses, 1 for status 500) came out as two: 8 and 1. It only merges points that are in the same payload when they reach the processor.
Pitfalls I hit, or proved, in the lab
error_mode decides what one bad record costs. I sent two records, one plain text and one JSON, through an unguarded merge_maps(log.cache, ParseJSON(log.body), "upsert"). With ignore, which is the default in this version, the Collector logged failed to execute statement at warn and exported both records. With propagate, the client got HTTP 503 with invalid character 'p' looking for beginning of value, and neither record was exported, including the valid one. Use ignore, and use where guards so that errors stay rare. silent drops the warning too, which hides typos.
set with a missing value is no longer a no-op. The ottl.set.allowNil feature gate arrived in v0.158.0 and is beta, so enabled by default, in 0.161.0. Before I added the guards in recipe 8, set(log.attributes["user.id"], log.cache["user_id"]) gave every plain-text record an empty user.id: Empty() attribute. The OTTL README’s migration advice is to add where field != nil.
Order is execution order. I swapped the two statements in recipe 14, putting the scale before the rename. The metric was renamed but stayed at 250 ms. With service.telemetry.logs.level: debug, the Collector logs every statement with "condition matched": false/true and the full TransformContext. That’s how I saw the scale’s condition fail. The same applies between processors: the filter in recipe 13’s pipeline runs before the transform, so its conditions must use the raw, untransformed names.
Writing resource attributes from a log record. set(resource.attributes["tenant.id"], log.attributes["tenant"]) runs once per log record, because the log. path makes the context log. Two records under one resource, for tenants acme and globex, both ended up under tenant.id: globex, the last one written. Setting flatten_data: true and starting the Collector with --feature-gates=transform.flatten.logs, which is alpha, split them into two resources with the correct tenant each. Without that gate, copy into the resource only values that are identical for every record under it.
Context mistakes fail at startup, logic mistakes don’t. validate rejected set(log.attributes["x"], "y") under trace_statements with inferred context "log" is not a valid candidate. It can’t tell you that a regex never matches. Only sample data can.
Prototype on ottl.run, prove it locally
ottl.run is the OTTL Playground. It has panels for a processor config, an OTLP JSON payload and the result, a debugger that steps through statements one at a time, and a button that copies a shareable link. It is open source (elastic/ottl-playground, Apache-2.0) and runs the transform and filter processors compiled to WebAssembly. Two caveats. First, the site asks you not to submit confidential information, so use made-up payloads, not production logs. Second, when I checked, the repository pinned the contrib processors at v0.157.0, a few releases behind the 0.161.0 I tested with. That is before the ottl.set.allowNil gate, so the nil behaviour above may differ. Treat the playground as a fast way to draft a statement, and the local Collector as the test that counts.
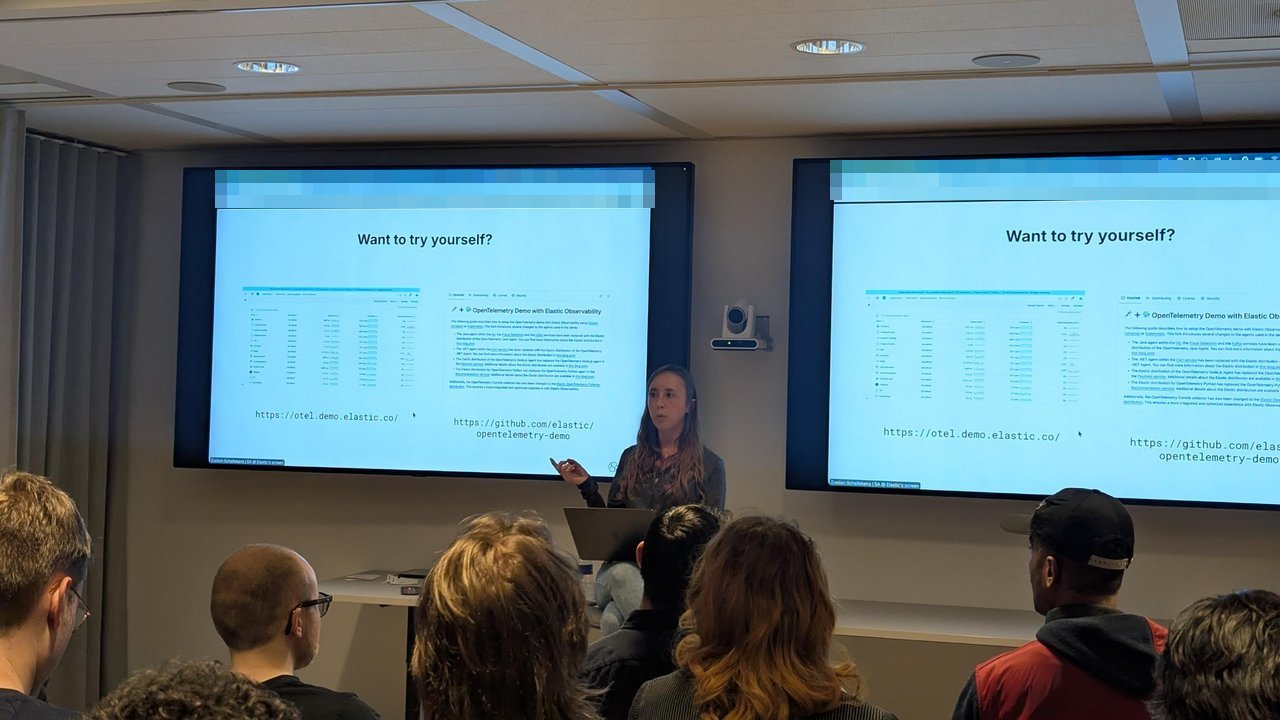
A slide from “Guide to Observability with OpenTelemetry” at SRE NL: “Want to try yourself?”, with the hosted demo and the demo repository.
My take: keep a folder of small payloads next to the Collector config, one per recipe, and run them in CI with validate plus the debug exporter. A config change that alters what comes out of the Collector is a behaviour change, and it deserves the same review as application code. If you run more than a handful of Collectors, ship the result through OpAMP or GitOps, not by hand.