OpenTelemetry trace quality is the difference between a trace that answers “why was this checkout slow?” in one click and a pile of disconnected spans you pay to store. Most teams I work with get OpenTelemetry installed in a week. Getting traces you can trust across hundreds of services takes much longer, because nothing fails loudly when the traces are bad. This post is the checklist I use, with a Collector config that enforces part of it.
During KubeCon Europe 2026 week I went to Signal Overflow, the SRE NL meetup at Booking.com. The talk Tracing for Grown-Ups: OpenTelemetry Best Practices for Large Systems closed with a six-point trace-quality checklist, and Andi Grabner’s talk later that evening had a slide on detecting bad patterns such as duplicated spans, excessive logs and N+1 queries. Both are written up in my co-located day recap. They got me to write down my own version.
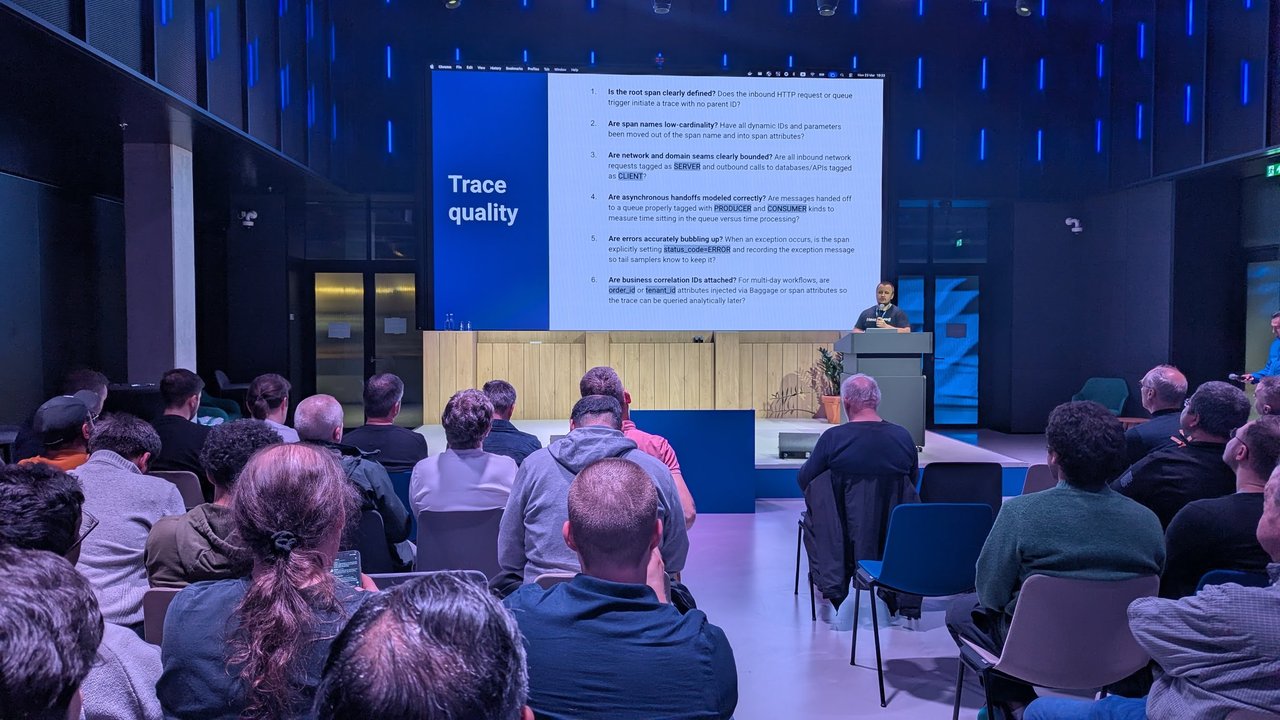
If you still need to deploy the Operator and Collector, start with OpenTelemetry on Kubernetes: The 2026 Observability Stack. This post assumes telemetry is already flowing and asks whether it is any good.
Versions: semantic conventions v1.44.0, OpenTelemetry Collector and Collector Contrib v0.162.0, Python SDK 1.45.0.
What good traces look like
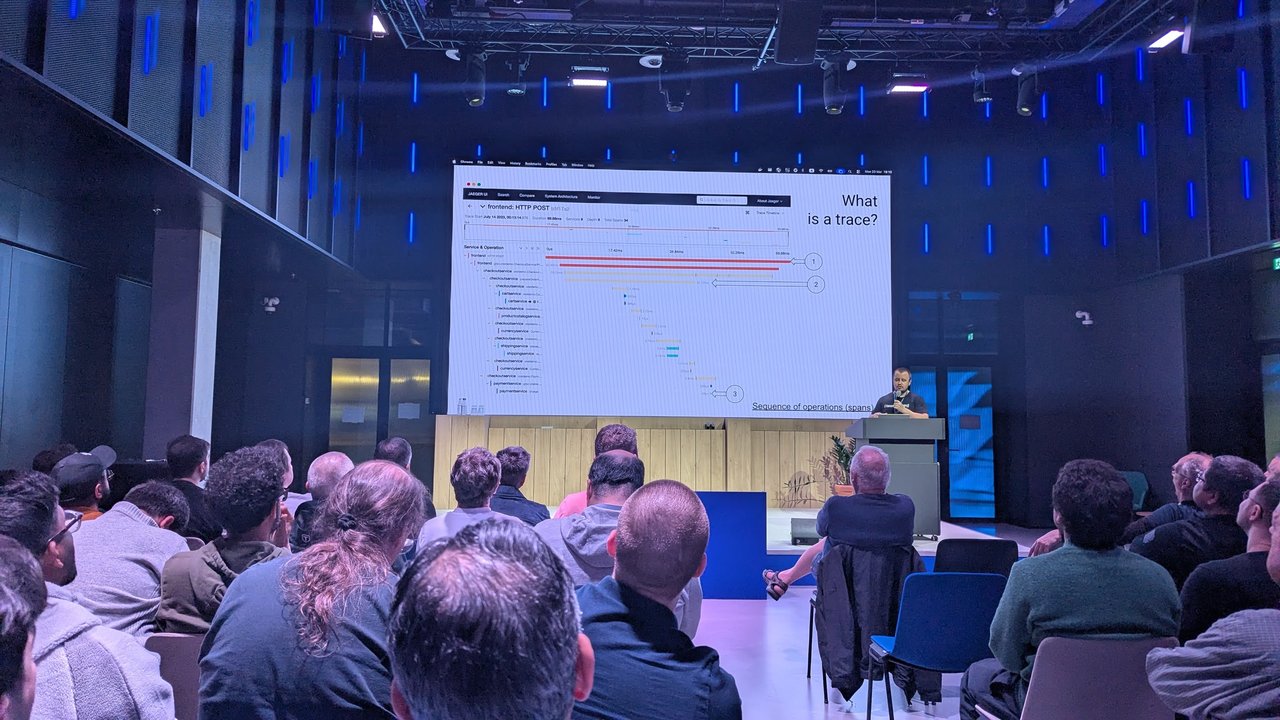
A slide from Tracing for Grown-Ups at Signal Overflow, the SRE NL meetup at Booking.com: a Jaeger timeline illustrating a trace as a sequence of operations (spans).
1. Context survives every hop, including async ones
A trace is only useful if the traceparent header (W3C Trace Context, the default propagator in the SDKs) reaches every service. HTTP and gRPC auto-instrumentation handle this. The gaps are almost always in four places:
- L7 proxies and gateways that strip unknown headers or start their own trace.
- Message queues, where the context has to travel in message headers.
- Thread pools and background jobs. In Python,
asynciotasks copycontextvars, but plain threads do not. Theopentelemetry-instrumentation-threadingpackage exists only to propagate context across threads. - Batch consumers, where one span processes many messages. A span has one parent, so the messaging conventions use span links to connect it to each message’s producer.
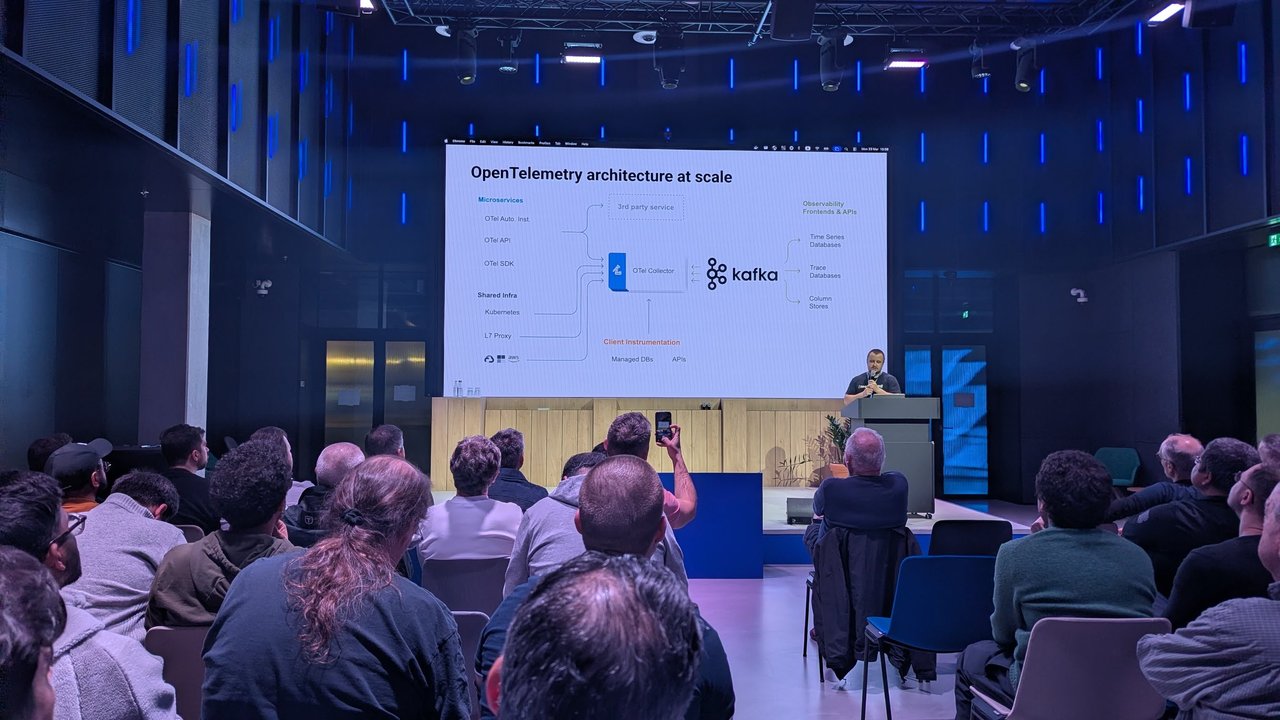
A slide from Tracing for Grown-Ups at Signal Overflow at Booking.com: an OpenTelemetry architecture where SDKs, shared infrastructure such as the L7 proxy, and client instrumentation feed the OTel Collector and Kafka.
2. Span kinds are correct
Span kind tells the backend how spans relate:
| Situation | Span kind |
|---|---|
| Inbound HTTP/gRPC request | SERVER |
| Outbound call, database query | CLIENT |
| Creating or sending a message | PRODUCER |
| Processing a delivered message | CONSUMER |
| In-process work | INTERNAL (default) |
PRODUCER and CONSUMER matter more than they look. With them, the gap between the send span ending and the process span starting is time spent in the queue, separate from processing time. If both sides are INTERNAL, the gap is still there but no tool knows what it means.
3. Attribute names follow current semantic conventions
Names have changed, and dashboards break quietly when half your fleet uses the old ones. The ones I check first:
- Resource:
service.name,service.version,deployment.environment.name. The olddeployment.environmentis deprecated, replaced bydeployment.environment.name, which is now stable. - HTTP:
http.request.method,http.route,http.response.status_code,url.path,server.address,error.type. - Messaging:
messaging.system,messaging.operation.type,messaging.operation.name,messaging.destination.name. These are still marked Development, so expect more changes.
For your own attributes, the naming guidance recommends a prefix from your company’s reverse domain or a unique application name, never an existing OpenTelemetry namespace. checkout.order_id is fine; http.order_id is not.
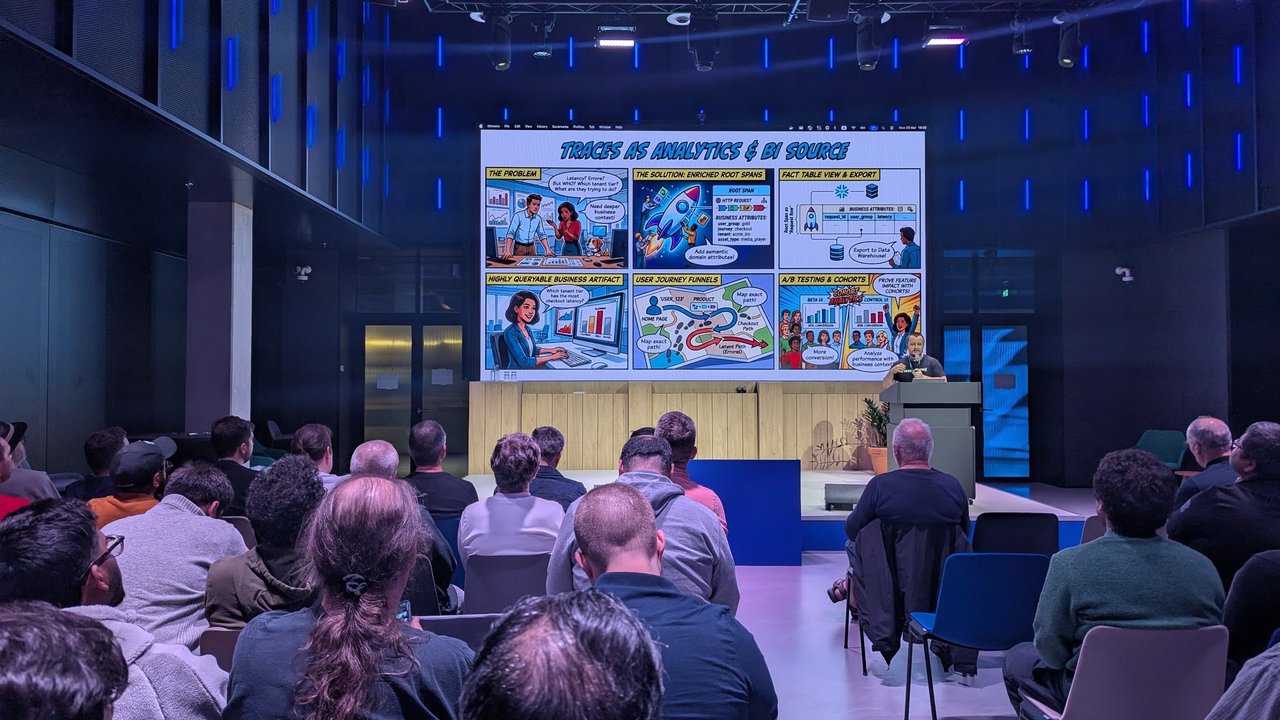
A slide from Tracing for Grown-Ups at Signal Overflow at Booking.com: “Traces as analytics & BI source”, enriching root spans with business attributes so traces become a queryable fact table.
A missing service.name is easy to spot: the Python SDK falls back to unknown_service: plus the interpreter name, for example unknown_service:python3. Search your backend for unknown_service and you will find the services that skipped configuration.
4. Span names are low-cardinality
The tracing API spec says a span name should identify a class of spans, not an instance: get_user, not get_user/314159. For HTTP, the conventions say server span names should be the method plus http.route (for example GET /users/:userID, with the route template the framework matched), and instrumentation must not fall back to the raw URI path. IDs go in attributes. High-cardinality names break grouping in every backend and inflate any span-metrics you derive from them.
5. Errors are marked so samplers can see them
The recording-errors conventions say a failed operation should set span status ERROR and the error.type attribute, which should be low-cardinality (an exception class name or an error code). Successful operations leave status unset. For HTTP, a 4xx stays unset on a SERVER span but should be ERROR on a CLIENT span. 5xx is ERROR on both.
One change to note: the conventions now deprecate recording exceptions as span events in favour of log records. Instrumentations are asked to offer an OTEL_SEMCONV_EXCEPTION_SIGNAL_OPT_IN variable for the migration, and the default is still span events. Span status and error.type are what tail sampling uses either way.
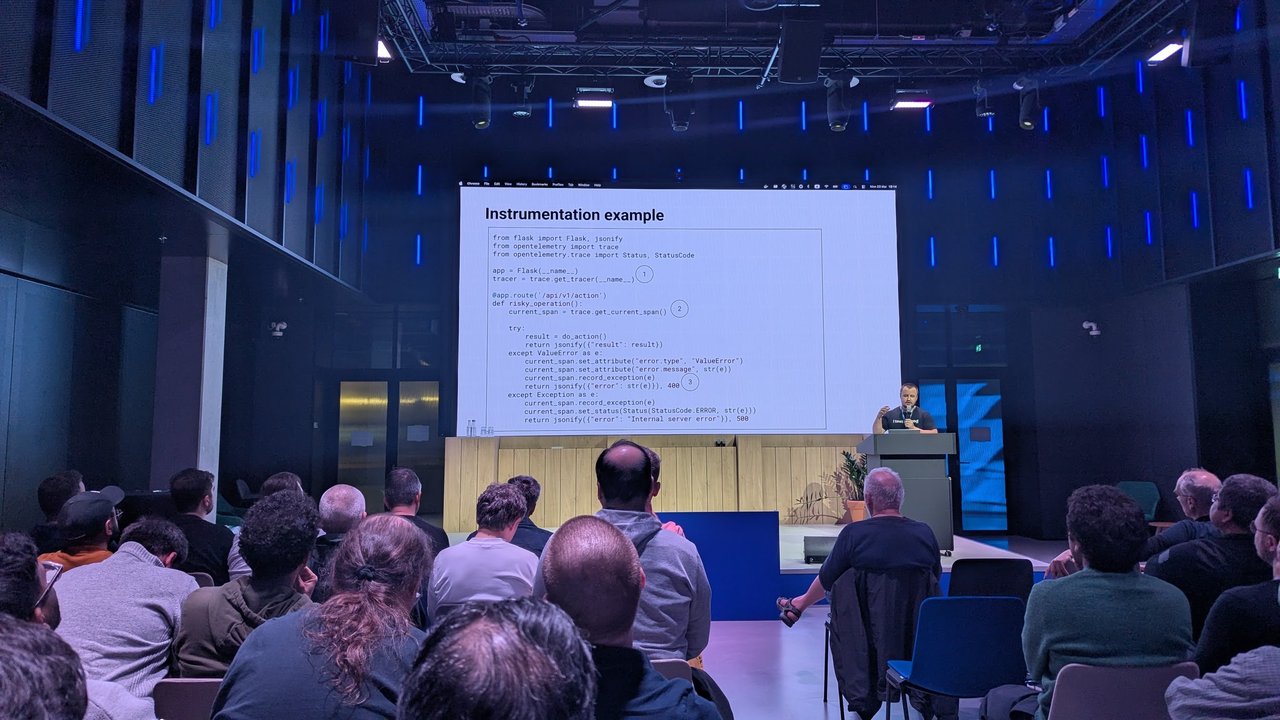
A slide from Tracing for Grown-Ups at Signal Overflow at Booking.com: a Flask instrumentation example that records exceptions and sets the span status to ERROR on failures.
6. Resources identify what produced the span
Every span should carry service.name, service.version and deployment.environment.name on its resource. Without the version you can’t answer “did this start with the 14:05 deploy?” Set them with OTEL_SERVICE_NAME and OTEL_RESOURCE_ATTRIBUTES from your deployment tooling, so developers don’t hard-code them.
Instrumenting an async handoff in Python
This snippet covers points 1, 2, 5 and 6 for a single-message queue handoff. broker.publish and message.headers stand in for your client library. If your client has an instrumentation package (opentelemetry-python-contrib ships them for kafka-python, confluent-kafka and aiokafka), use it; write this by hand only where none exists.
import os

from opentelemetry import trace
from opentelemetry.exporter.otlp.proto.grpc.trace_exporter import OTLPSpanExporter
from opentelemetry.propagate import extract, inject
from opentelemetry.sdk.resources import Resource
from opentelemetry.sdk.trace import TracerProvider
from opentelemetry.sdk.trace.export import BatchSpanProcessor
from opentelemetry.trace import SpanKind, Status, StatusCode

# Resource.create() also merges OTEL_RESOURCE_ATTRIBUTES and OTEL_SERVICE_NAME
resource = Resource.create({
    "service.name": "checkout",
    "service.version": os.environ.get("APP_VERSION", "dev"),
    "deployment.environment.name": os.environ.get("DEPLOY_ENV", "development"),
})
provider = TracerProvider(resource=resource)
provider.add_span_processor(BatchSpanProcessor(OTLPSpanExporter()))
trace.set_tracer_provider(provider)
tracer = trace.get_tracer("checkout.orders")


def publish_order(broker, order):
    with tracer.start_as_current_span(
        "send orders",                       # operation + destination, no IDs
        kind=SpanKind.PRODUCER,
        attributes={
            "messaging.system": "kafka",
            "messaging.operation.type": "send",
            "messaging.operation.name": "send",
            "messaging.destination.name": "orders",
            "checkout.order_id": order.id,   # the ID lives here, not in the name
        },
    ):
        headers = {}
        inject(headers)                      # writes traceparent (and baggage)
        broker.publish("orders", order.payload, headers=headers)


def handle_order(message):
    parent = extract(message.headers)        # rebuild the producer's context
    with tracer.start_as_current_span(
        "process orders",
        context=parent,                      # child of the send span
        kind=SpanKind.CONSUMER,
        attributes={
            "messaging.system": "kafka",
            "messaging.operation.type": "process",
            "messaging.operation.name": "process",
            "messaging.destination.name": "orders",
        },
    ) as span:
        result = charge(message.body)        # an exception here is recorded automatically
        if not result.ok:
            span.set_status(Status(StatusCode.ERROR, result.reason))
            span.set_attribute("error.type", result.code)   # e.g. "card_declined"
What matters here:
start_as_current_spandefaults torecord_exception=Trueandset_status_on_exception=True. Ifcharge()raises, the exception is recorded and status set toERRORas it leaves thewithblock. Don’t also callrecord_exceptionin anexceptthat re-raises, or you record it twice. The conventions recommend against recording the same exception more than once.- The manual
set_statuscovers failures that return an error instead of raising. - Making the process span a child of the producer context is allowed for single messages only. For batches, start the process span without that parent and pass
links=with onetrace.Linkper message context.
Detecting bad patterns
These are the patterns I look for in a trace sample before tuning anything:
- Duplicated spans from double instrumentation. Two spans with the same name and kind, nested parent-child, with almost identical durations. The usual cause is two layers instrumenting the same call: an auto-instrumentation agent plus a library instrumentation you enabled in code, or an Operator-injected agent on top of an SDK you already initialize. Fix it at the source. Filtering one copy in the Collector is risky because the dropped span is often the parent of the downstream
SERVERspan, and the filter processor warns that dropping a parent orphans its children. - N+1 spans. One request span with hundreds of identical
CLIENTdatabase or HTTP children in a row. That’s a code problem the trace makes visible. The tail sampler below keeps very large traces so you can find them. - Excessive span events. Debug logging written as span events. The SDK caps events per span at 128 by default (
OTEL_SPAN_EVENT_COUNT_LIMIT), so a busy span silently loses later events. Send logs as logs, correlated by trace ID. - Broken traces. Many single-span traces whose root is a
CONSUMERor a non-entrySERVERspan usually means a propagation gap upstream. Root spans named after proxies or withunknown_servicepoint straight at the hop that lost the context.
Sampling: head vs tail
Head sampling decides at the root, in the SDK. The default sampler is parentbased_always_on. Setting OTEL_TRACES_SAMPLER=parentbased_traceidratio and OTEL_TRACES_SAMPLER_ARG=0.1 keeps 10% of new traces, and child services follow the parent’s decision. It’s cheap, but the decision is made before anyone knows whether the request will fail.
Tail sampling decides after the spans arrive, in the Collector’s tail_sampling processor. You can keep every error and every slow trace and sample the rest. The cost: all spans of a trace must reach the same Collector instance, and the processor holds them in memory while it waits. The README’s recommended setup is two layers, a first tier with the load_balancing exporter routing by trace ID, and a second tier running tail_sampling.
My take: in large systems, use both. Keep head sampling at 100% (or high) where volume allows, so tail sampling sees complete traces, and let the gateway make the keep/drop call.
Enforcing quality with the OpenTelemetry Collector
First tier (agent or DaemonSet) routes spans by trace ID to a headless Service in front of the gateway:
exporters:
  load_balancing:
    routing_key: traceID           # the default for traces, stated for clarity
    protocol:
      otlp:
        tls:
          insecure: true           # use real TLS between tiers in production
    resolver:
      dns:
        hostname: otel-gateway-headless.observability.svc.cluster.local
        port: 4317
Second tier (gateway) normalizes attributes, drops noise and samples:
receivers:
  otlp:
    protocols:
      grpc:
        endpoint: 0.0.0.0:4317

processors:
  memory_limiter:
    check_interval: 1s
    limit_percentage: 80
    spike_limit_percentage: 20

  transform/trace-quality:
    error_mode: ignore
    trace_statements:
      # Resource group: migrate the deprecated environment attribute
      - statements:
          - set(resource.attributes["deployment.environment.name"], resource.attributes["deployment.environment"]) where resource.attributes["deployment.environment.name"] == nil and resource.attributes["deployment.environment"] != nil
          - delete_key(resource.attributes, "deployment.environment")
      # Span group: rebuild server span names from the route, cap attributes
      - statements:
          - set(span.name, Concat([span.attributes["http.request.method"], span.attributes["http.route"]], " ")) where span.kind == SPAN_KIND_SERVER and span.attributes["http.route"] != nil and span.attributes["http.request.method"] != nil and span.attributes["http.request.method"] != "_OTHER"
          - limit(span.attributes, 64, ["http.route", "http.request.method", "http.response.status_code", "error.type"])
          - truncate_all(span.attributes, 4096)

  filter/span-noise:
    error_mode: ignore
    trace_conditions:
      - spanevent.name == "debug"   # example: breadcrumb events your own code emits

  tail_sampling:
    decision_wait: 30s
    num_traces: 100000
    decision_cache:
      sampled_cache_size: 500000
      non_sampled_cache_size: 500000
    policies:
      - name: drop-health-checks
        type: drop
        drop:
          drop_sub_policy:
            - name: health-paths
              type: string_attribute
              string_attribute:
                key: url.path
                values: ["/healthz", "/readyz"]
      - name: keep-errors
        type: status_code
        status_code:
          status_codes: [ERROR]
      - name: keep-slow
        type: latency
        latency:
          threshold_ms: 2000
      - name: keep-oversized
        type: span_count
        span_count:
          min_spans: 1000
      - name: baseline
        type: probabilistic
        probabilistic:
          sampling_percentage: 5

exporters:
  otlp_grpc:
    endpoint: tracing-backend:4317

service:
  pipelines:
    traces:
      receivers: [otlp]
      processors: [memory_limiter, transform/trace-quality, filter/span-noise, tail_sampling]
      exporters: [otlp_grpc]
Line by line where it matters:
memory_limitercomes first. Its README calls this best practice, so backpressure can reach the receivers and less data is dropped. That matters here because the tail sampler holds spans in memory.- The transform is split into two statement groups. The processor infers the OTTL context from the paths in each group, so the resource group runs once per resource instead of once per span.
error_mode: ignorelogs failed statements and keeps going. - The span-name rewrite is a backstop, not the fix. It only fires on
SERVERspans that already carryhttp.route, and skips the_OTHERmethod placeholder. Custom spans with IDs in their names still need fixing in code. filteruses thetrace_conditionssyntax documented from Collector Contrib v0.146.0. A condition onspaneventdrops the matching events and keeps the span. I use it for span events, not spans, because of the orphan problem above.tail_samplingpolicies are ORed for keeping, butdropwins. If any policy returns drop, the trace is gone, even if it had an error. Health-check traces are dropped as whole traces, which avoids orphaning anything.decision_wait: 30sis the default, written out so it’s visible;num_tracesdefaults to 50000 and I doubled it. The README says to size the decision caches well abovenum_tracesso late spans get the same decision.otlp_grpcis the gRPC OTLP exporter’s name since Collector v0.144.0.otlpstill works as a deprecated alias on older configs.
Verifying it works
- Validate the config before rolling it out:
otelcol-contrib validate --config=gateway.yaml. - Temporarily add the
debugexporter withverbosity: detailedto the gateway pipeline and check that resources showdeployment.environment.nameand server spans have route-based names. - Watch the tail sampler’s own metrics.
otelcol_processor_tail_sampling_sampling_trace_dropped_too_earlyshould stay near zero; if it grows, raisenum_tracesor lowerdecision_wait.otelcol_processor_tail_sampling_count_traces_sampled, grouped bypolicyanddecision, shows which policy keeps or drops what. - In the backend, search for
unknown_service, single-spanCONSUMERroots and span names that contain digits. Each should trend to zero.
Common pitfalls
- Tail sampling behind a round-robin load balancer. Spans of one trace land on different gateways and each sees half a trace. Use the
load_balancingexporter. - Running
k8sattributesaftertail_sampling. The tail sampler reassembles batches and loses their original context, so context-dependent processors must come before it. Ideally run them on the first tier. - Low head sampling plus tail sampling. If the SDK keeps 1% of traces, the tail sampler can only keep errors from that 1%.
- Treating the Collector as the fix. It can rename, cap and drop. It can’t restore a context that a proxy threw away.
Related
- KubeCon Europe 2026 co-located day: Platform Engineering Day, Observability Day, ArgoCon and Signal Overflow
- OpenTelemetry on Kubernetes: The 2026 Observability Stack
- OpenTelemetry on Kubernetes: Complete Observability Stack
- AI Observability: Tracing LLM Calls with OpenTelemetry
- Dash0 at KubeCon EU 2026: Observability Without Lock-In