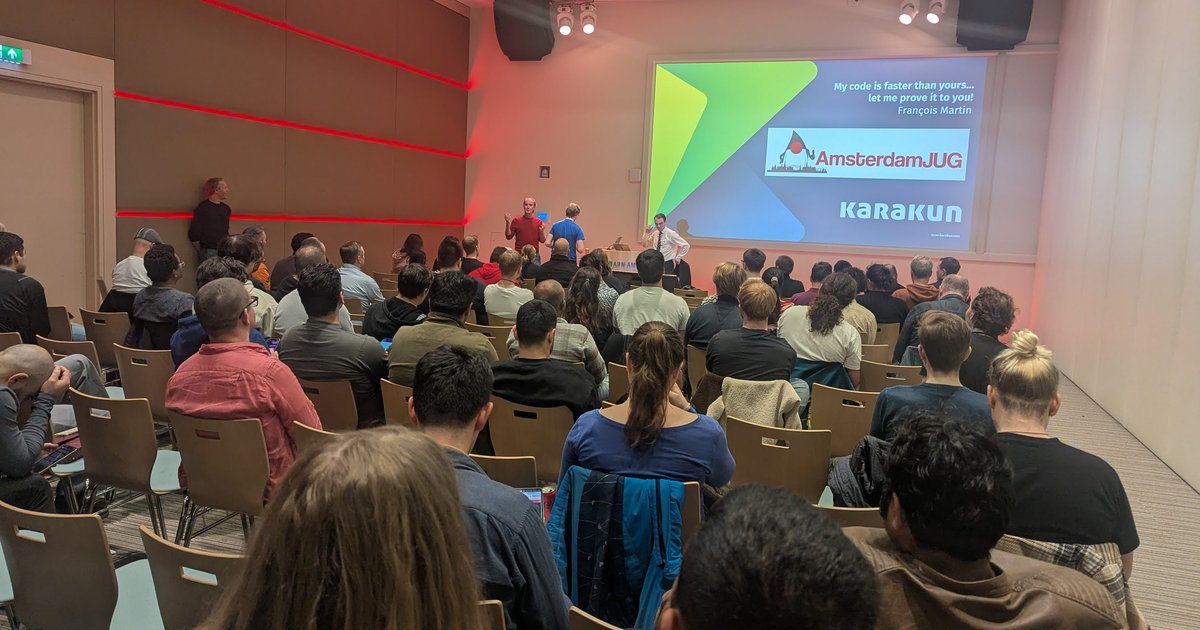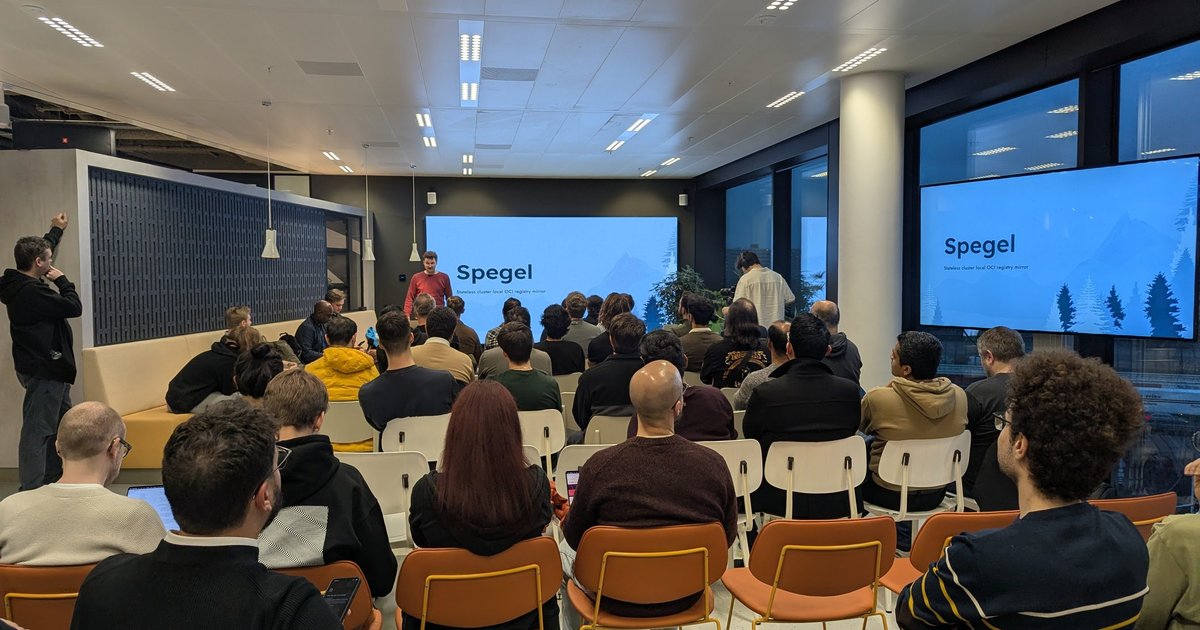
On Wednesday 30 September 2026 I went to “OTEL Meetup; What is IT, really?”, an OpenTelemetry evening presented by Dash0 at Mindspace Dam in Amsterdam, from 18:00 to 21:00. It was billed as a hands-on workshop: the Luma page asked people to bring a laptop, and a message to attendees on the day suggested a local Kubernetes cluster (kind or k3s) and, ideally, an application of your own. The agenda on the listing ran from “Observability, minus the buzzwords” and “OTel anatomy” to three labs: instrument a demo app, “From data to answers”, and “Break things on purpose”.
What I saw on the screen covered a lot more ground than that: semantic conventions, OpenTelemetry Weaver, sampling, a three-service Spring Boot lab, the new OpenTelemetry Packaging SIG, Go compile-time instrumentation, and no-touch instrumentation on Kubernetes. Here is the evening in order, as far as my photos show it.
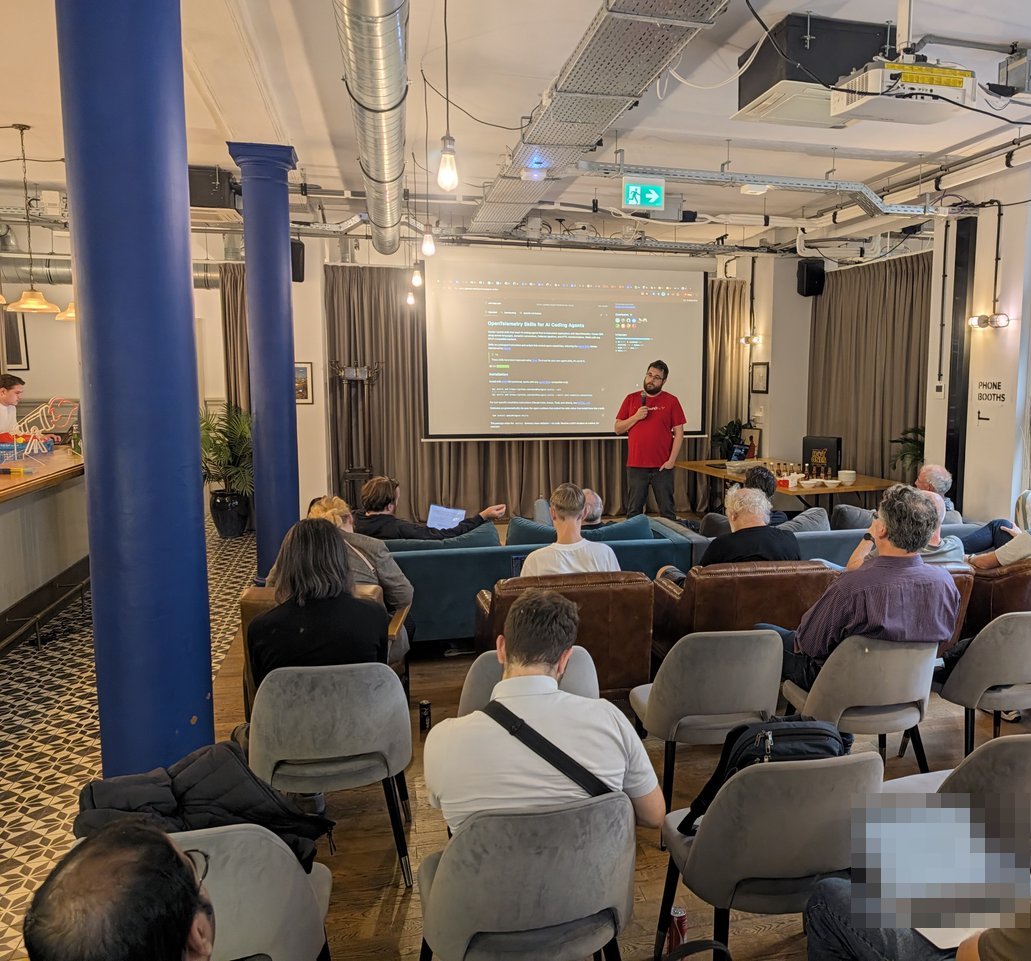
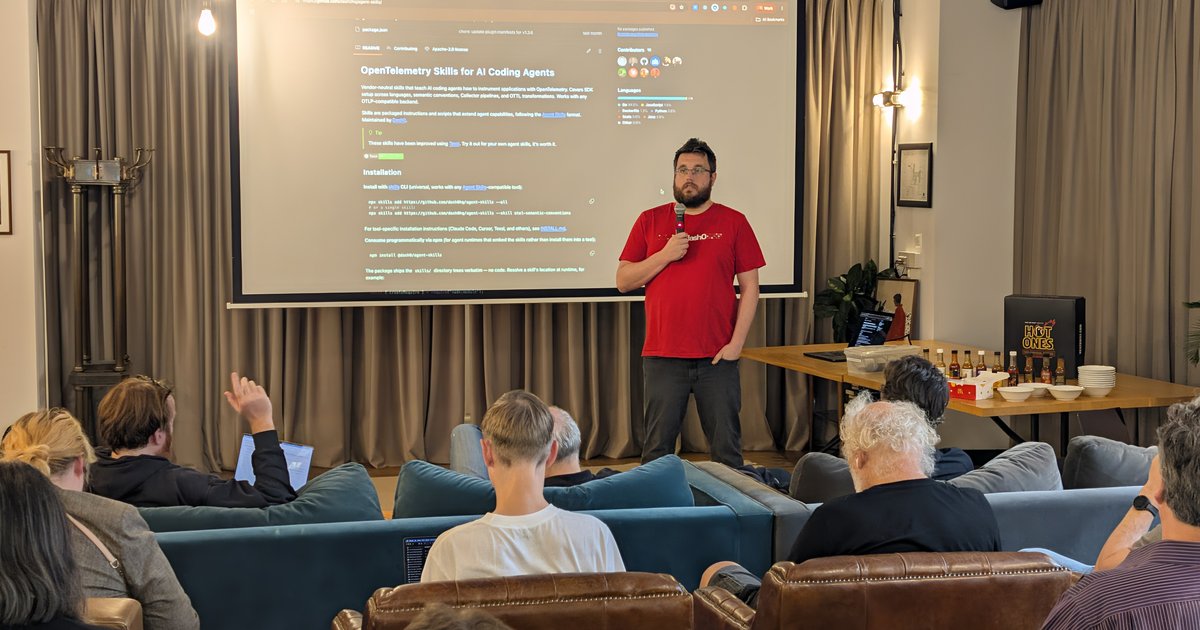
The room at Mindspace Dam, with the agent skills README on screen.
Opening: OpenTelemetry skills for AI coding agents
The first thing on the screen was not a slide but a GitHub README: OpenTelemetry Skills for AI Coding Agents, from dash0hq/agent-skills. The README describes them as “vendor-neutral skills that teach AI coding agents how to instrument applications with OpenTelemetry”, covering SDK setup across languages, semantic conventions, Collector pipelines and OTTL transformations, and working with “any OTLP-compatible backend”. The skills follow the Agent Skills format. You install them with the skills CLI (npx skills add https://github.com/dash0hq/agent-skills --all, or one skill at a time, such as otel-semantic-conventions) or as the npm package @dash0/agent-skills.
Next to the speaker sat a Hot Ones box (“The Official Sauces, by Heatonist”), a row of hot sauce bottles and a stack of OpenTelemetry For Dummies booklets, Dash0 Special Edition. The meetup had a theme.
Context before charts: resource semantic conventions
The talk proper opened with a slide asking “What are we looking at?” over an unlabelled line chart with two peaks. The next slide revealed the answer: “Cuteness vs. Number of Legs”, a chart from Reddit’s /r/funny, circa 2010. My take: it’s a neat way to show that a chart without context tells you nothing, and context is what OpenTelemetry resources give you.
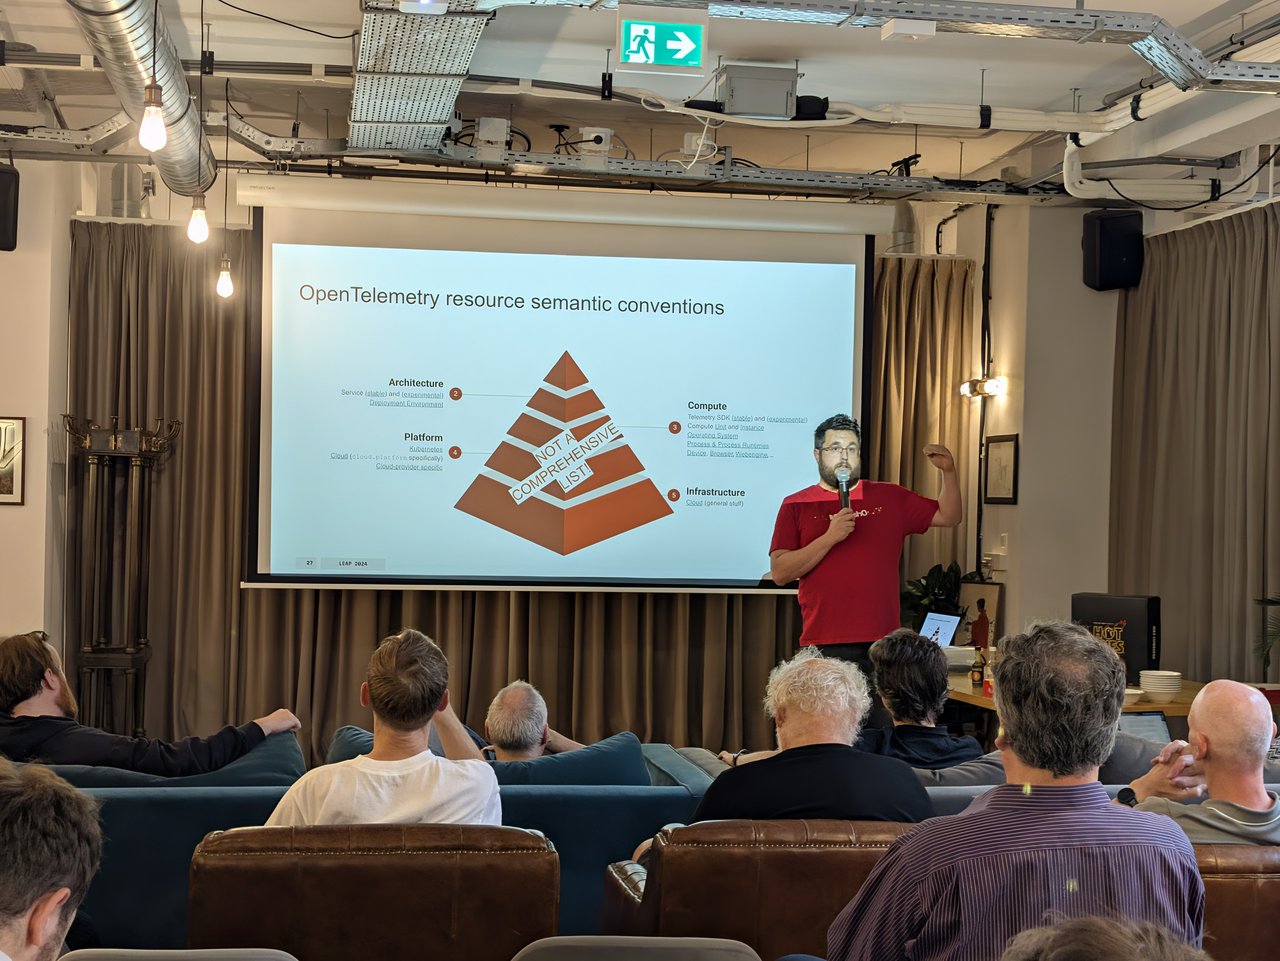
OpenTelemetry resource semantic conventions as a pyramid: “NOT A COMPREHENSIVE LIST!”
That led into the OpenTelemetry resource semantic conventions pyramid. The slide labelled four layers:
- Architecture: Service (stable and experimental attributes) and Deployment Environment.
- Compute: Telemetry SDK, Compute Unit and Instance, Operating System, Process and Process Runtimes, Device, Browser, Webengine and more.
- Platform: Kubernetes, Cloud (
cloud.platformspecifically), and cloud-provider-specific attributes. - Infrastructure: Cloud, “general stuff”.
A banner across the pyramid said “NOT A COMPREHENSIVE LIST!”, which is fair. The resource conventions keep growing.
OpenTelemetry Weaver: treat your telemetry like a public API
Then came the OpenTelemetry Weaver README, with the tagline “Observability by Design: Treat your telemetry like a public API”. Weaver “helps teams build observability by design, enabling consistent, type-safe, and automated telemetry through semantic conventions”. With it you define, validate and evolve your telemetry schemas.
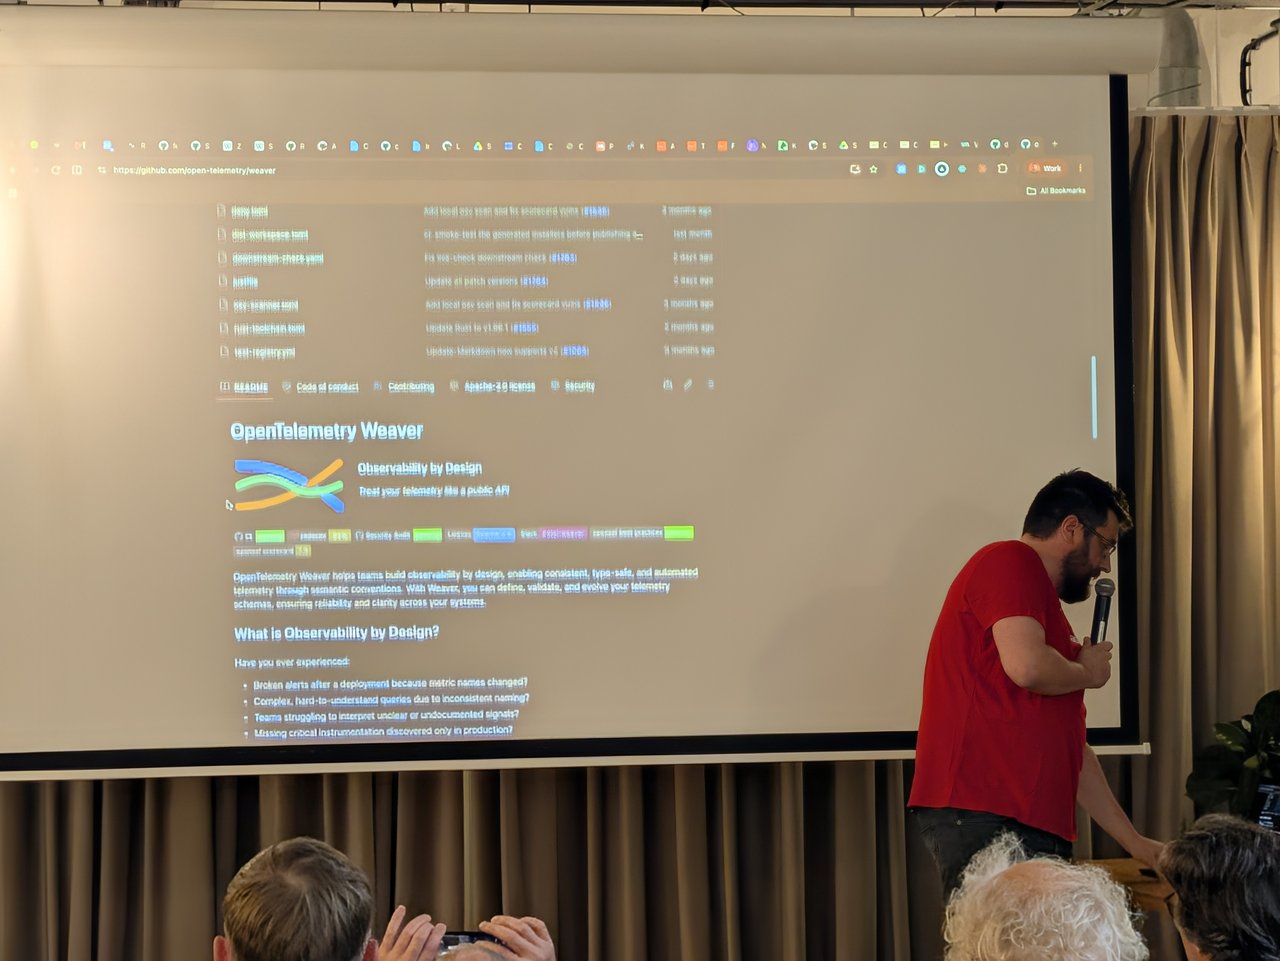
Weaver’s problem list, starting with broken alerts after a deployment because metric names changed.
The README’s “What is Observability by Design?” section asks a list of questions that anyone who has run a dashboard migration will recognise:
- Broken alerts after a deployment because metric names changed?
- Complex, hard-to-understand queries due to inconsistent naming?
- Teams struggling to interpret unclear or undocumented signals?
- Missing critical instrumentation discovered only in production?
Its answer is to treat observability signals (metrics, traces, logs) as a first-class public API that requires the same quality standards as your code. The official introduction is the opentelemetry.io post Observability by Design: Unlocking Consistency with OpenTelemetry Weaver. When I checked GitHub after the meetup, the latest Weaver release was v0.26.1 (September 2026), so it is still pre-1.0.
Before the labs there was a short detour into sampling, using slides from a PlatformCon talk titled “The theory and practice of sampling in OpenTelemetry”. I didn’t get a usable photo of that part.
Cake & Candles: learn OpenTelemetry from scratch
The first lab was Cake & Candles: Learn OpenTelemetry From Scratch, a GitHub repository whose README sums up the idea: “Instead of reading about spans and attributes in the abstract, you’ll run a small three-service Spring Boot application, send it a request, and watch that one request turn into a real distributed trace, with business context, custom metrics, correlated logs, and a few deliberate failures to investigate.”
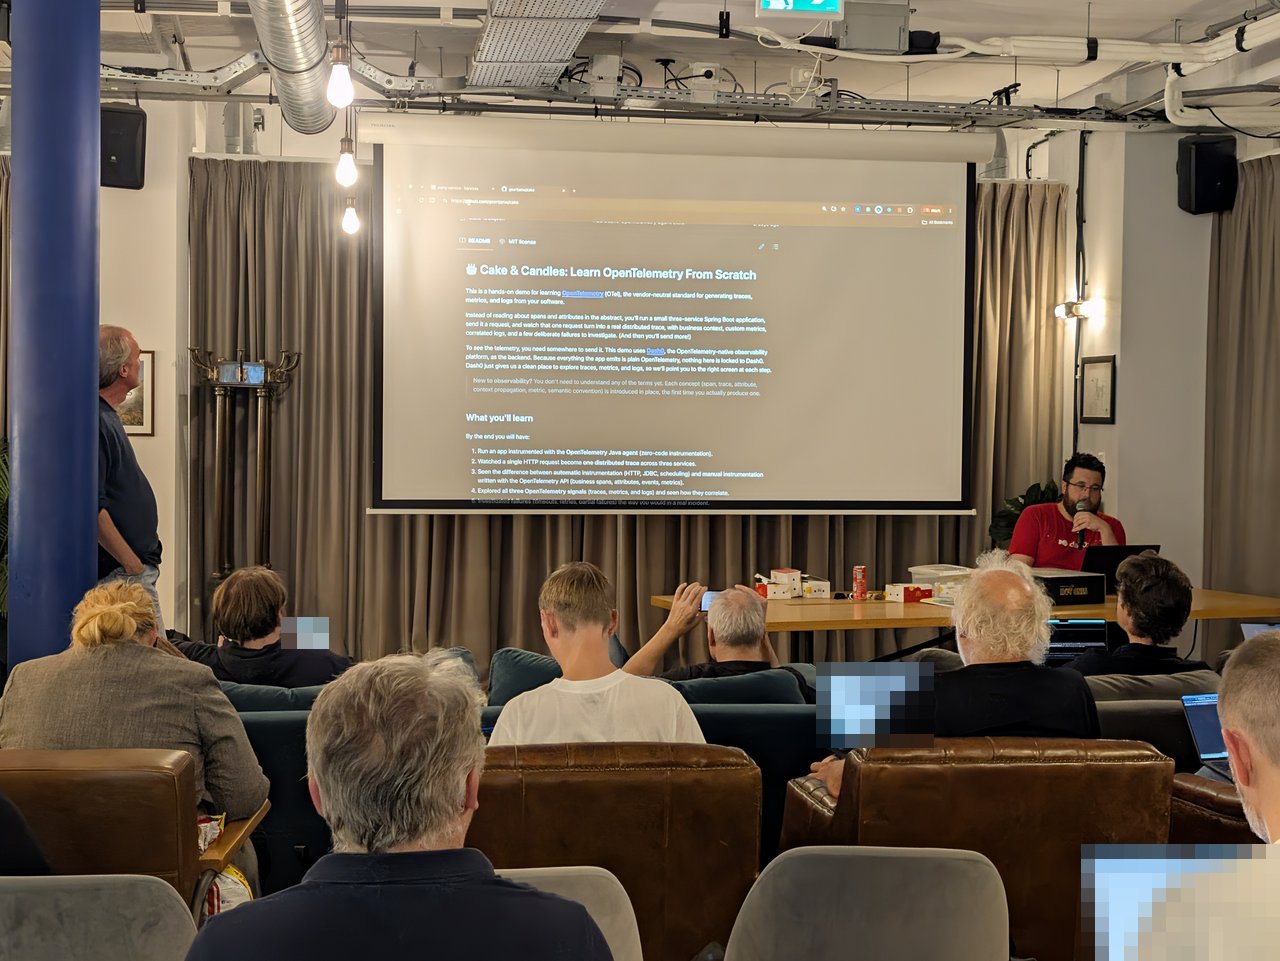
Cake & Candles: a three-service Spring Boot app, one request, one distributed trace.
The demo sends data to Dash0, but the README is explicit that “because everything the app emits is plain OpenTelemetry, nothing here is locked to Dash0”. Its “What you’ll learn” list:
- Run an app instrumented with the OpenTelemetry Java agent (zero-code instrumentation).
- Watch a single HTTP request become one distributed trace across three services.
- See the difference between automatic instrumentation (HTTP, JDBC, scheduling) and manual instrumentation written with the OpenTelemetry API (business spans, attributes, events, metrics).
- Explore all three signals (traces, metrics and logs) and see how they correlate.
- Investigate failures (timeouts, retries, partial failures) the way you would in a real incident.
The live trace on screen made point 3 concrete. A POST /parties request fanned out to POST /cakes, a “bake cake” span, two database spans against a flavor_inventory table (a SELECT ... FOR UPDATE, then an UPDATE ... SET stock = stock - ?), an “oven” span, and POST /invitations with two “send invitation” spans. The service map showed party-service, cake-service and bakery.
Two configuration details from the Kubernetes version of the lab are worth copying:
- The OTLP exporter settings live in one shared ConfigMap, injected into every service with
envFrom, using the same variables as thedocker-compose.yaml. The auth token lives in a Secret, never in that ConfigMap. - In the Dash0 operator’s
Dash0Monitoringresource, workload instrumentation is set tonone, because the three services already carry the OpenTelemetry Java agent in their images. Kubernetes event collection is on. Pod log collection is off, “because the services export their own logs over OTLP”; turning it on would duplicate them. Prometheus scraping is on for pods with theprometheus.io/scrape: "true"annotation.
From data to answers: triaging logs
For the “data to answers” part, the screen switched to logs from an OpenTelemetry Demo environment. The view filtered on service.name = productcatalogservice, grouped by otel.log.severity.range, and used a triage view to “Compare logs with severity ERROR & FATAL versus the rest”. The header read “Showing 946K of 2M log records (53.9%)”.
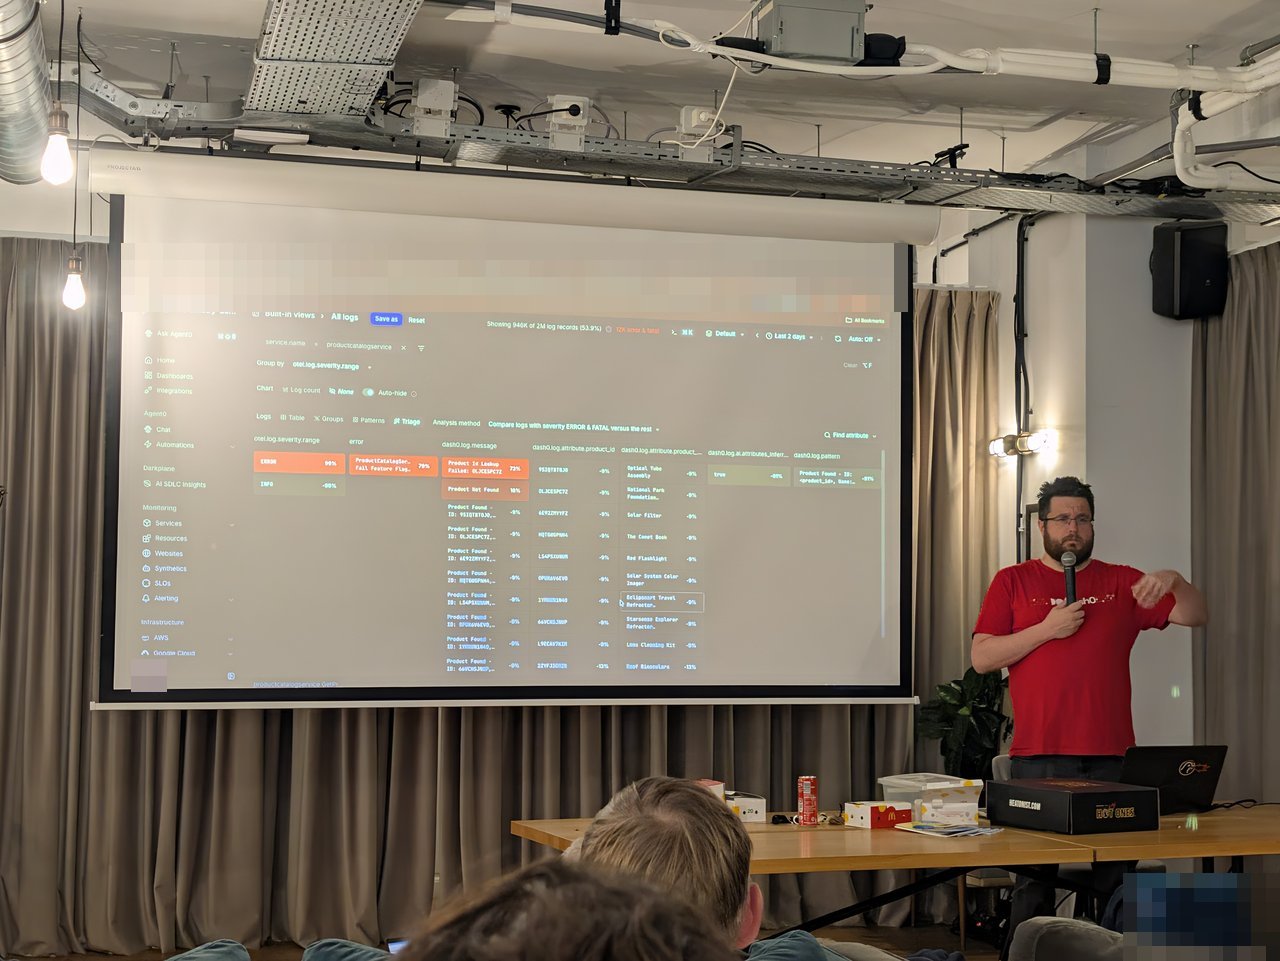
Comparing error logs against the rest: one failing product ID and a feature flag stand out.
The comparison did the work. One message, “Product Id Lookup Failed” for a single product ID, dominated the error side. The error column pointed at a product catalog “Fail Feature Flag”. That is the OpenTelemetry Demo’s deliberate failure scenario, and a good example of why structured attributes beat grepping message text.
The OpenTelemetry Packaging SIG
Next on screen: the opentelemetry-packaging repository. Its README says the Packaging SIG “delivers a streamlined, product-like experience for monitoring applications on virtual Linux hosts”. It combines three pieces into modular system packages: the OpenTelemetry Injector, OpenTelemetry eBPF Instrumentation (OBI), and the OpenTelemetry Collector. The goal is observability through a single command:
apt install opentelemetry   # Debian, Ubuntu
dnf install opentelemetry   # Fedora, RHEL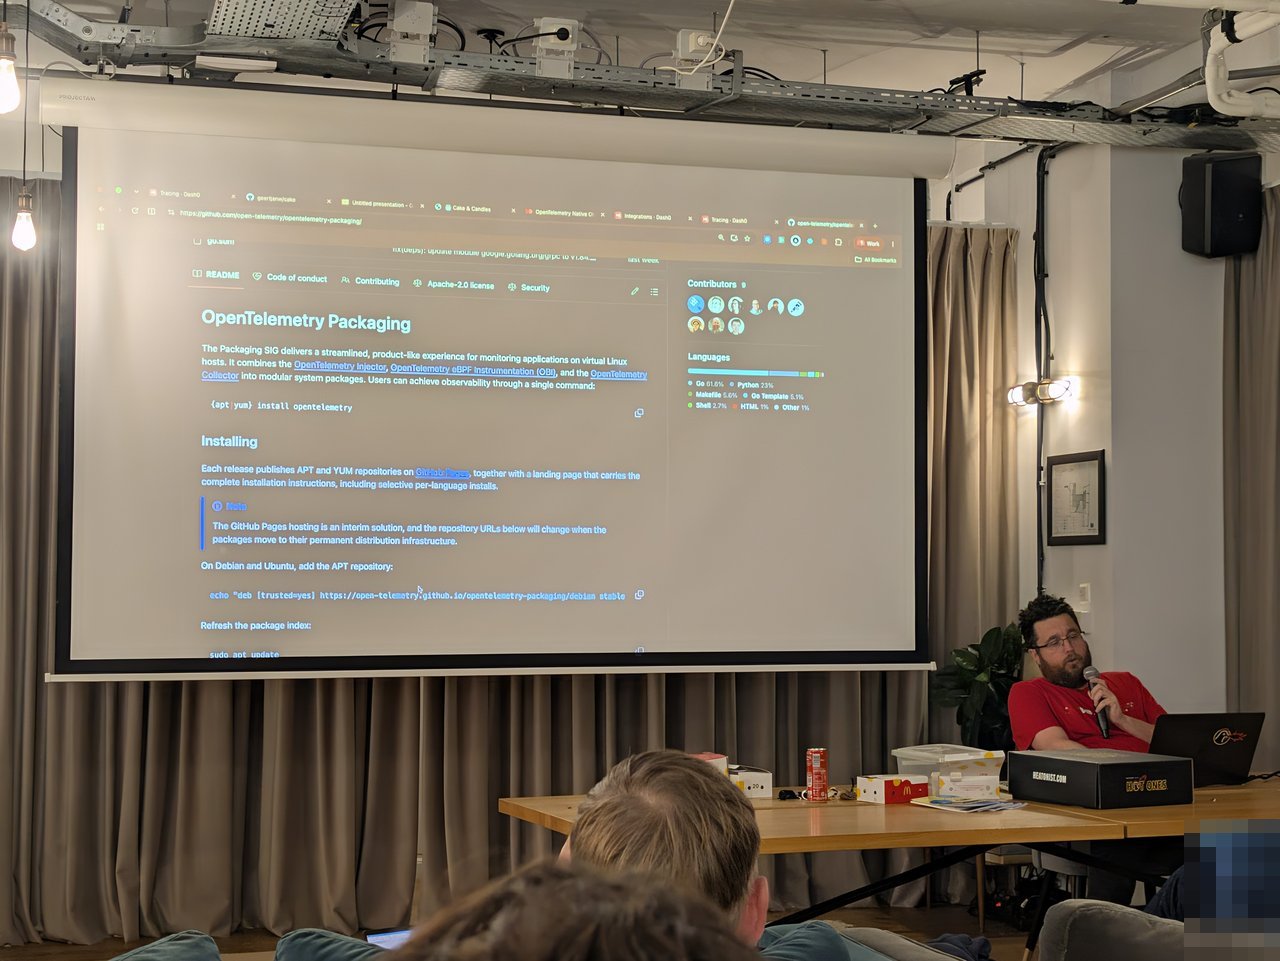
The Packaging SIG: Injector, OBI and the Collector as APT and YUM packages.
Each release publishes APT and YUM repositories on GitHub Pages. A note in the README (on screen, and still there when I checked) warns that “the GitHub Pages hosting is an interim solution”. The repository URLs will change when the packages move to permanent distribution infrastructure. So pin nothing to those URLs yet. This is the same “install it like any other package” direction Ted Young described at the “How to roll out OpenTelemetry at scale” event three weeks earlier.
OBI itself is Linux-only. The OBI docs list Linux 5.8+ (or RHEL-family 4.18+ with the eBPF backports), BTF support, amd64 or arm64, and root or the matching Linux capabilities.
Go compile-time instrumentation
Go has long been the awkward case for zero-code instrumentation, because a compiled Go binary has no VM to attach an agent to. The screen showed the opentelemetry.io page for Go compile-time instrumentation: “Instrument Go applications at build time, without code changes.”
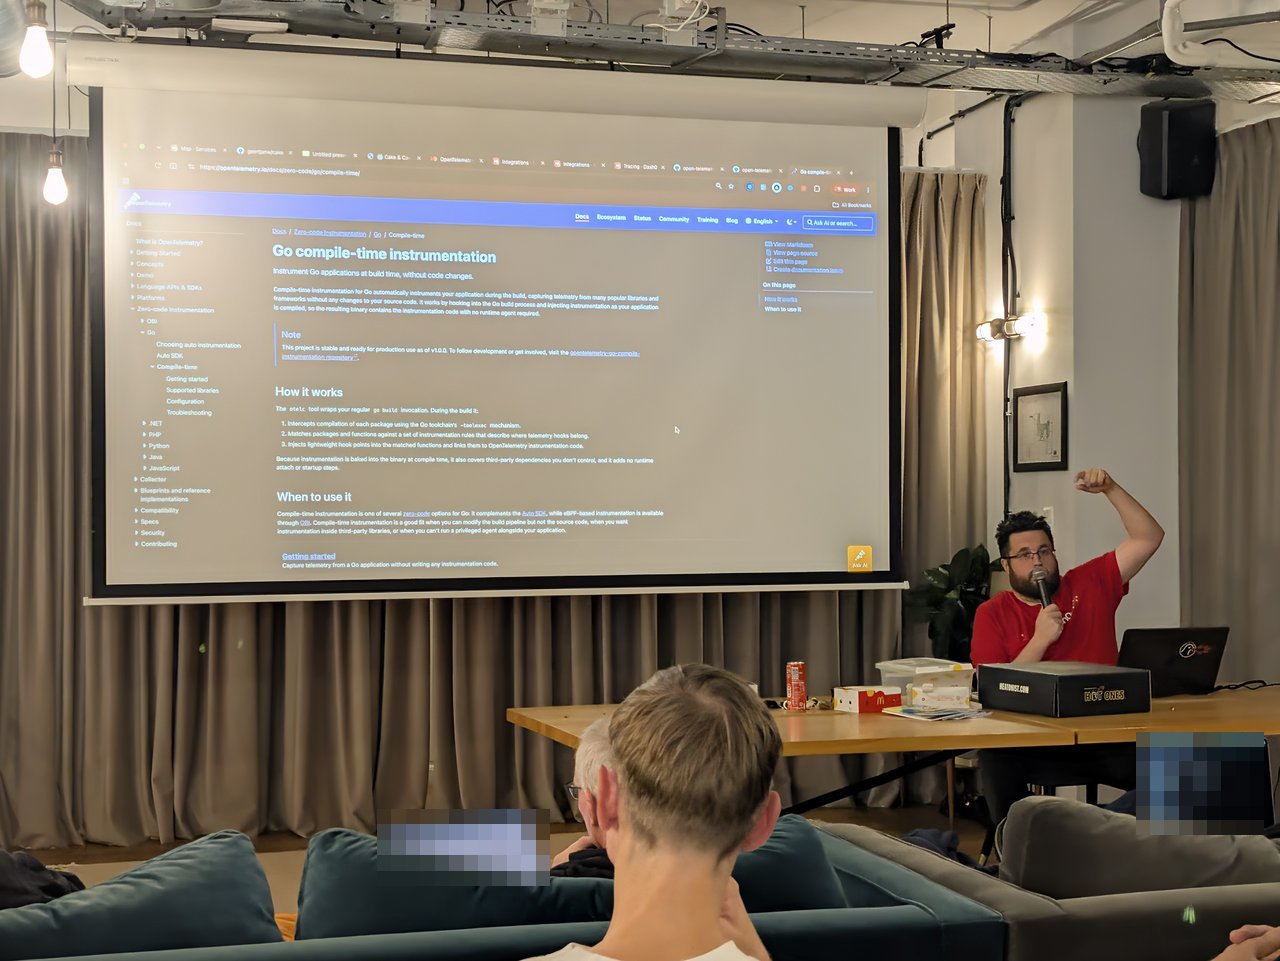
Go compile-time instrumentation: the binary carries the instrumentation, no runtime agent required.
The otelc tool wraps your regular go build. During the build it:
- Intercepts compilation of each package using the Go toolchain’s
-toolexecmechanism. - Matches packages and functions against instrumentation rules.
- Injects lightweight hook points into the matched functions and links them to OpenTelemetry instrumentation code.
Because the instrumentation is baked in at compile time, it also covers third-party dependencies you don’t control, with no runtime attach or startup step. The page’s note says the project is “stable and ready for production use as of v1.0.0”. On GitHub, opentelemetry-go-compile-instrumentation had reached v1.1.0 by August 2026.
Here is where it sits next to the other Go options, as of early October 2026:
- Compile-time (
otelc): stable since v1.0.0. A good fit when you control the build pipeline but not the source code, or can’t run a privileged agent. - eBPF via OBI: no code or build changes, but needs a Linux kernel with BTF and elevated privileges (see above).
- The original eBPF project, opentelemetry-go-instrumentation: still described in its README as “currently work in progress”. Its Auto SDK lets you join manual spans with the zero-code eBPF spans.
The docs have a choosing auto-instrumentation guide for exactly this decision.
No-touch instrumentation with a mutating webhook
The last section, using slides from a talk titled “The art and craft of no-touch instrumentation” (Observability Day 2025, London), showed how Kubernetes can add instrumentation without anyone touching the application. A diagram showed the Kube API calling a mutating webhook that rewrites the Pod YAML on admission. The next slide put the original and mutated pod specs side by side.
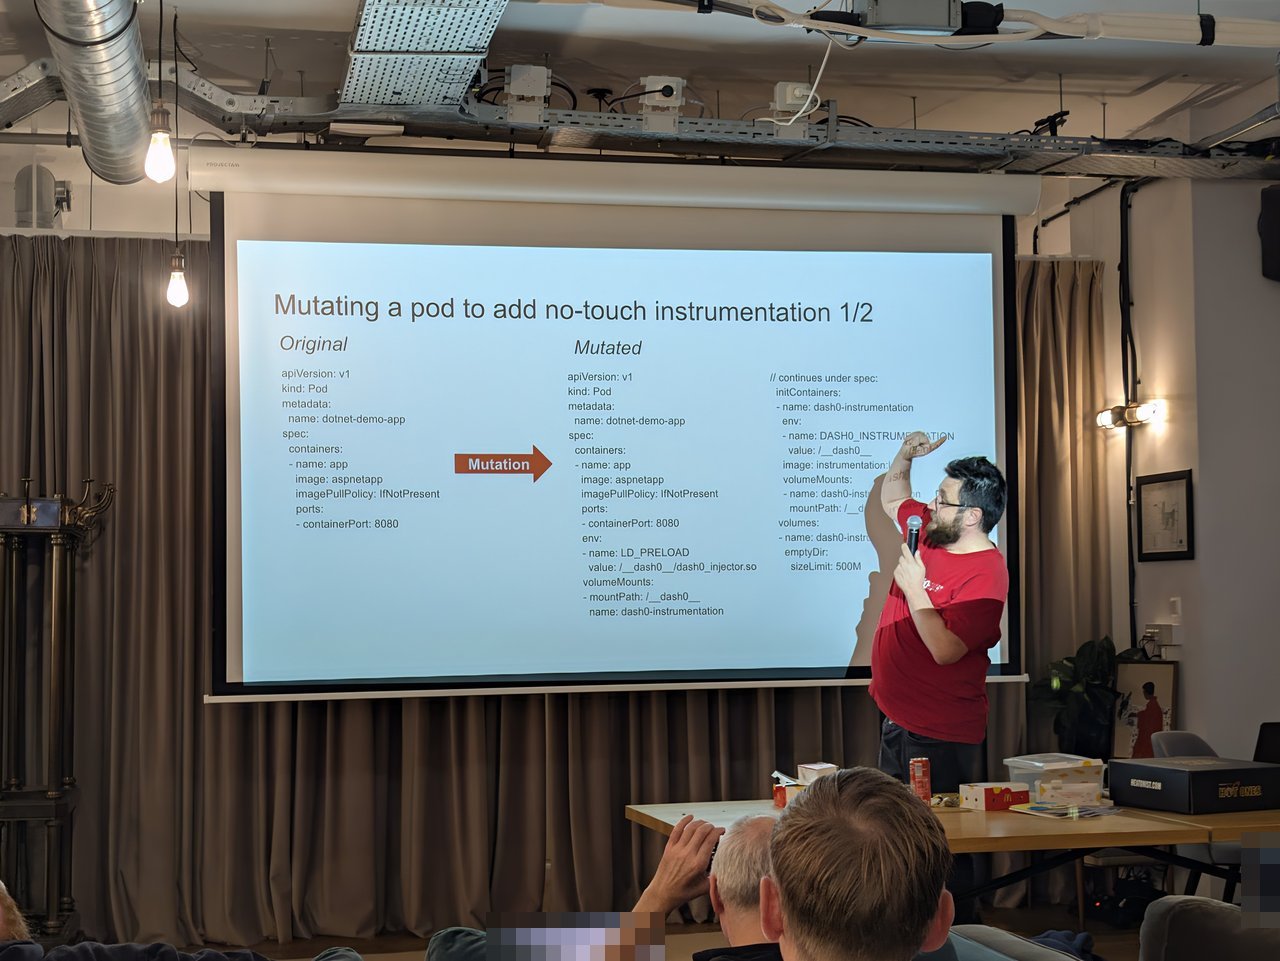
Mutating a pod for no-touch instrumentation: same app container, plus an init container, a volume and LD_PRELOAD.
The original pod spec was a plain dotnet-demo-app running an aspnetapp image. The mutated version added:
- An init container,
dash0-instrumentation, that copies the instrumentation files into a shared volume. - An
emptyDirvolume (sizeLimit: 500M) mounted at/__dash0__. - An
LD_PRELOADenvironment variable pointing at/__dash0__/dash0_injector.so.
The application image itself is unchanged. That is the same injector idea the Packaging SIG is bringing to plain Linux hosts.
My take
Three things stood out for me, as someone who helps teams roll OpenTelemetry out.
Naming is the real work. Weaver and the resource pyramid are about the same problem: telemetry only answers questions if attribute names and resources are consistent. I’d start with the trace quality checklist and move to Weaver schemas once you have a few teams. Until then, the transform processor and OTTL is how you fix names in the Collector. It works, but fixing at the source is better.
Zero-code is splitting by platform, and that’s fine. Java agent in the image, mutating webhook on Kubernetes, Injector plus OBI as apt install on VMs, otelc in the Go build. Each fits a different constraint: who owns the image, who owns the cluster, whether you can run privileged. Pick per workload, not per company. However you install it, a fleet of Collectors needs managing, which is where OpAMP comes in.
Context propagation needs the same discipline as resources. The Cake & Candles trace worked because context flowed across three services. Once teams start adding business context, decide what is allowed to propagate. My Baggage in Python post covers how not to leak it.