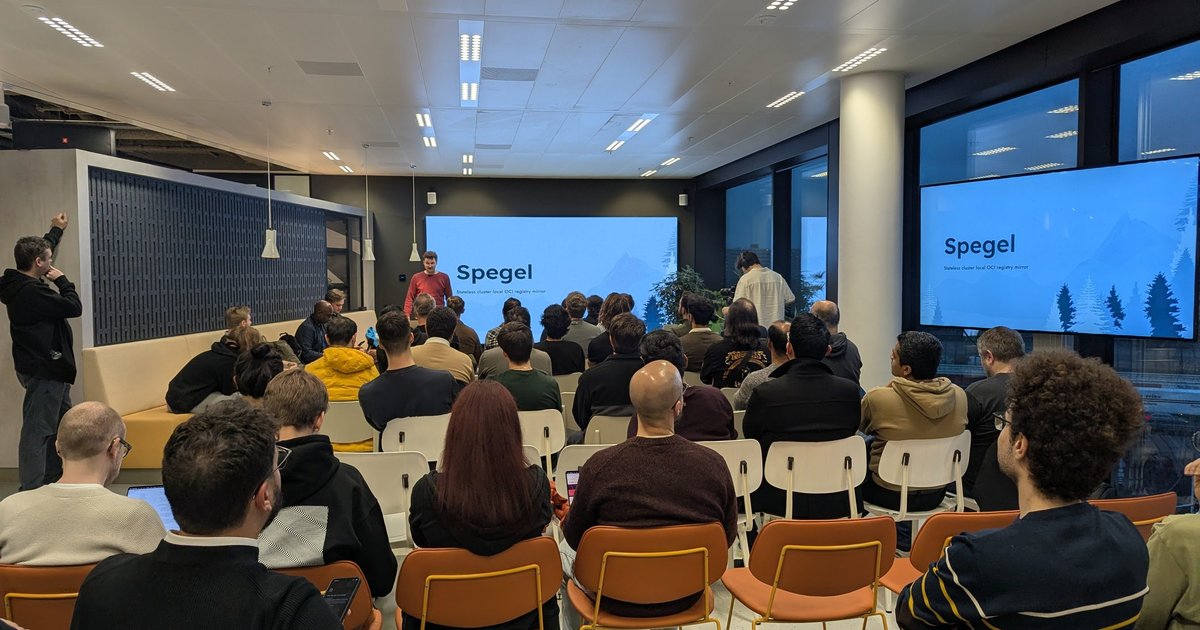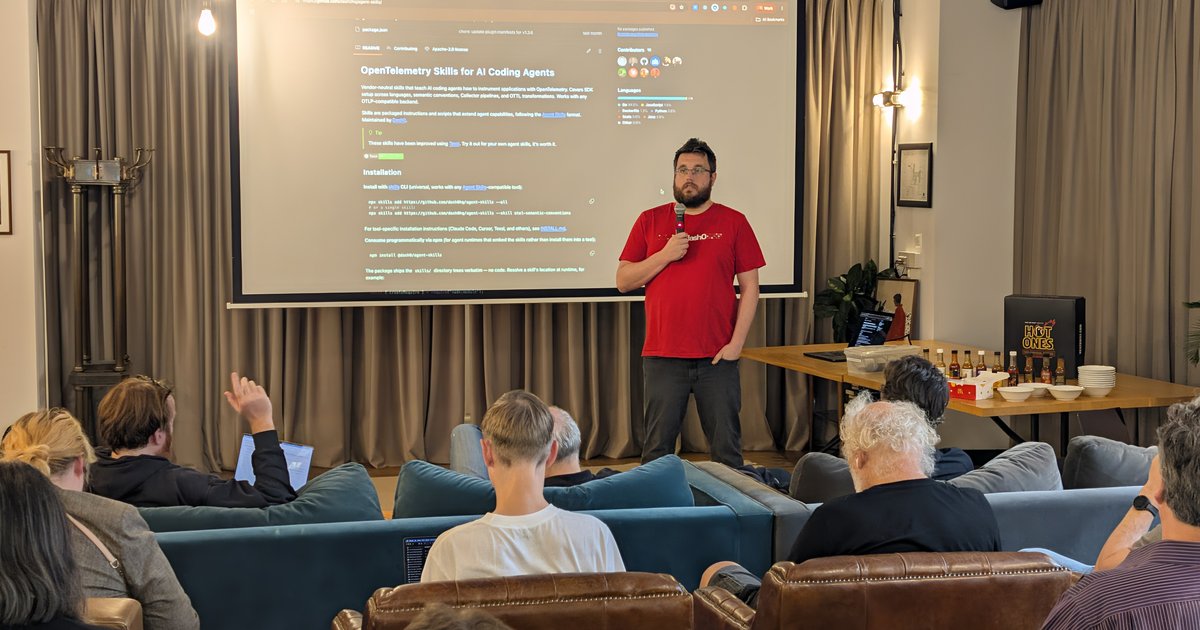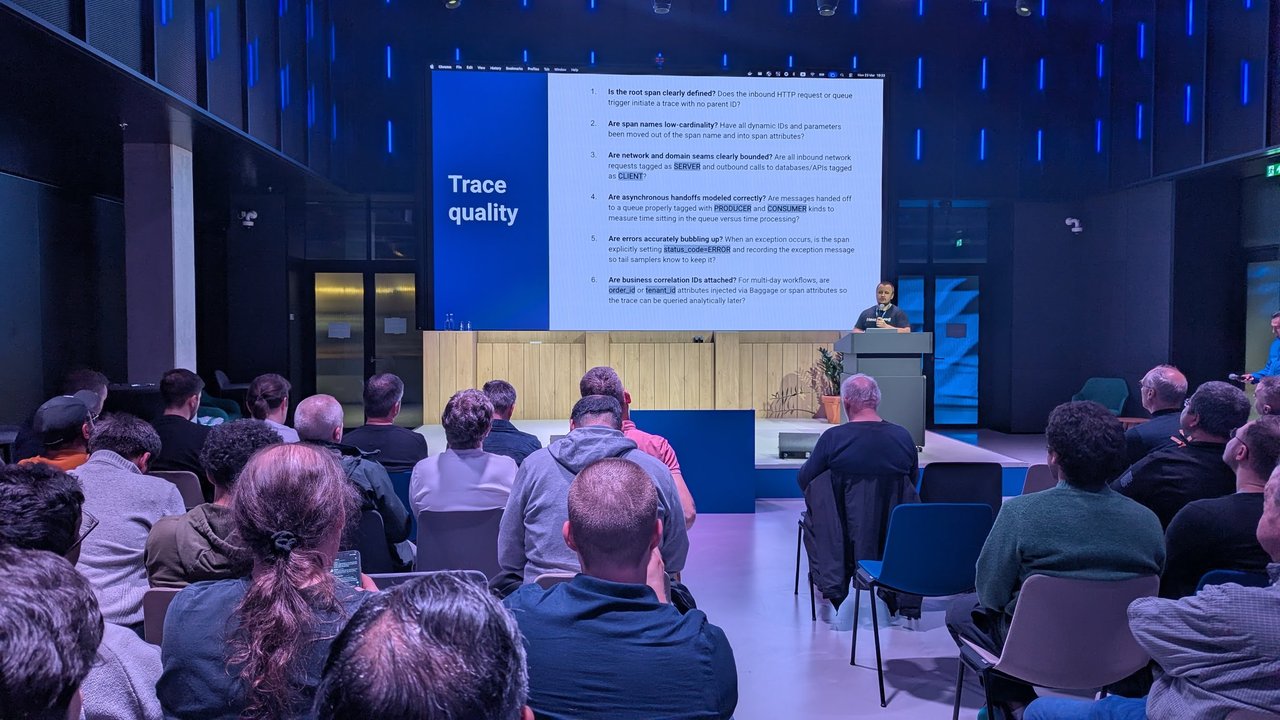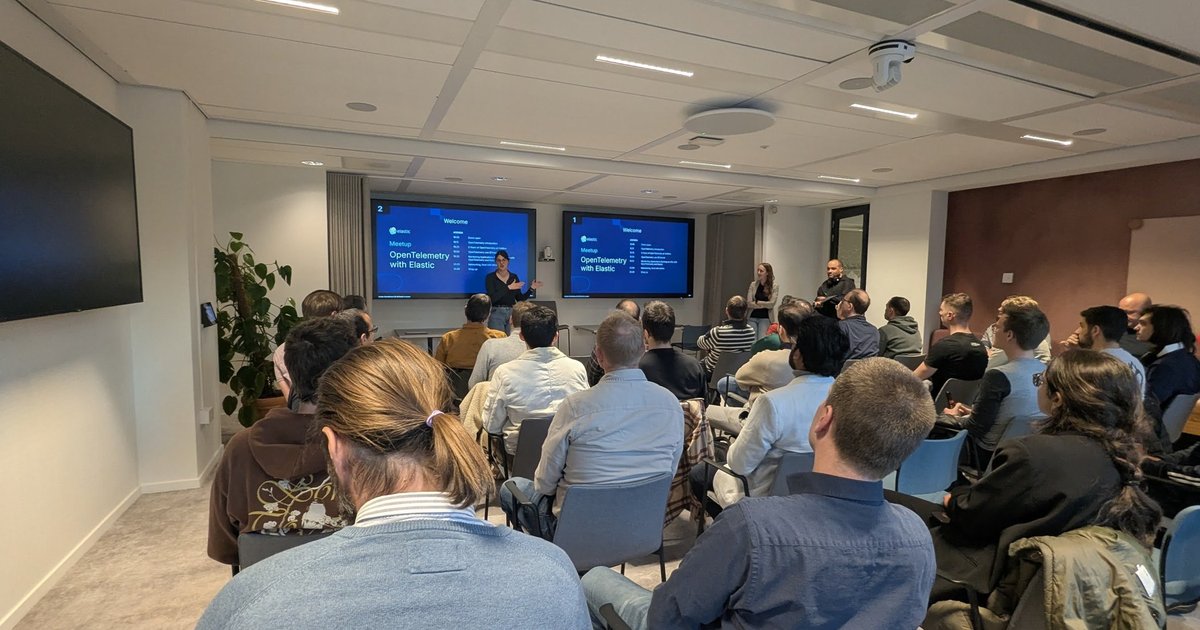
On Thursday 27 March 2025 I spent the evening at OpenTelemetry with Elastic, a meetup in Amsterdam. The welcome slide listed an agenda that ran from an OpenTelemetry introduction to a talk titled “5 Years of OpenTelemetry at Collibra”, a third user talk, a session on monitoring applications running on Kubernetes with OpenTelemetry and Elastic, and then networking with food and drinks. This post follows the talks in that order, as my photos and the recordings I made show them.
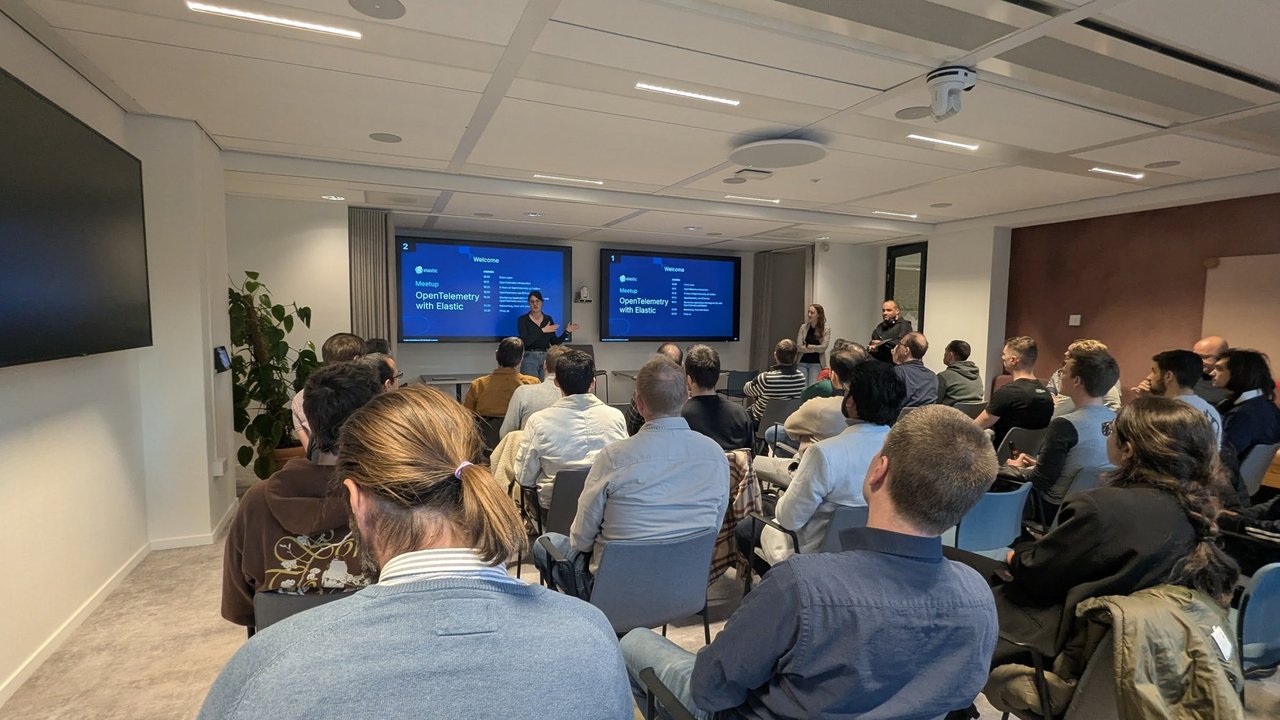
The room before the first talk: the “Meetup: OpenTelemetry with Elastic” welcome slide on both screens.
OpenTelemetry in one slide, and what EDOT adds
The Elastic presenters opened with the basics. OpenTelemetry is a vendor-neutral way to collect traces, metrics and logs and send them to any backend, so the instrumentation stays the same and you pick the observability platform separately. The talk described it as one of the fastest-growing CNCF projects, second only to Kubernetes, and compared its ambition to what Kubernetes did for container orchestration: becoming the common standard.
The ecosystem slide laid out the moving parts: language APIs and SDKs (with auto-instrumentation) sending OTLP to a Collector made of receivers, processors and exporters, with signals (traces, metrics, logs, and profiling still marked as in progress) tied together by semantic conventions. I read the OpenTelemetry documentation as the reference for all of that.
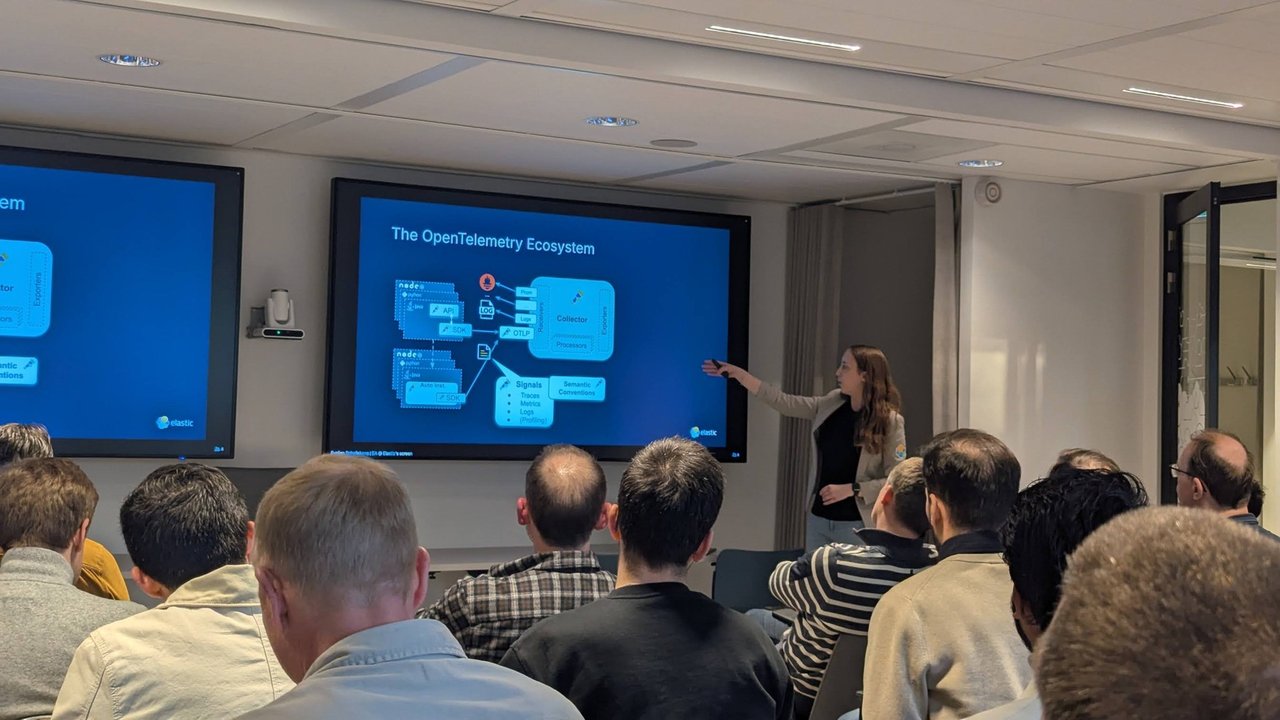
The OpenTelemetry Ecosystem slide: SDKs and auto-instrumentation, OTLP, the Collector, and signals with semantic conventions.
Two Elastic-specific points followed:
- Naming conventions matter. The speaker used the Elastic Common Schema (ECS) as the example: if one team writes
container.idand anothercontainer_id, correlating logs from a host with metrics from its pods gets hard, so a shared schema lets you jump between data sources in one platform. - EDOT, the Elastic Distribution of OpenTelemetry. According to the speaker, Elastic builds a layer on top of the upstream open-source components, using extension points so the data fits Kibana better, adds opinionated configuration, offers technical support, and can ship releases faster than waiting for upstream, while contributing changes back. Elastic’s EDOT documentation lists the collector, language SDKs for Java, Python, Node.js, .NET and more, and cloud forwarders. If a component you need is missing, you can still build your own Collector, which is what the next speaker had done.
There was also a short mention of Elastic’s continuous profiler, built with eBPF at kernel level: it samples what the CPU is doing, shows where time is spent, and, since CPU on cloud costs money, can estimate the CPU and CO2 savings after a code fix. That is the presenter’s description of the product, not something I tested.
5 Years of OpenTelemetry at Collibra
The longest talk came from Alex Van Boxel, whose slide introduced him as someone with almost 30 years in the sector, mostly as a software engineer. He described himself as a system architect at Collibra, a data governance company, and a contributor to the Collector, including the Google Cloud pieces.
The reason for adopting OpenTelemetry was commercial as much as technical. Collibra had been on a proprietary observability contract priced per environment or host, and as the customer base grew, the cost grew too. They wanted an open model where they stayed in control of the data and of where it ends up. Traces were the first signal they moved over.
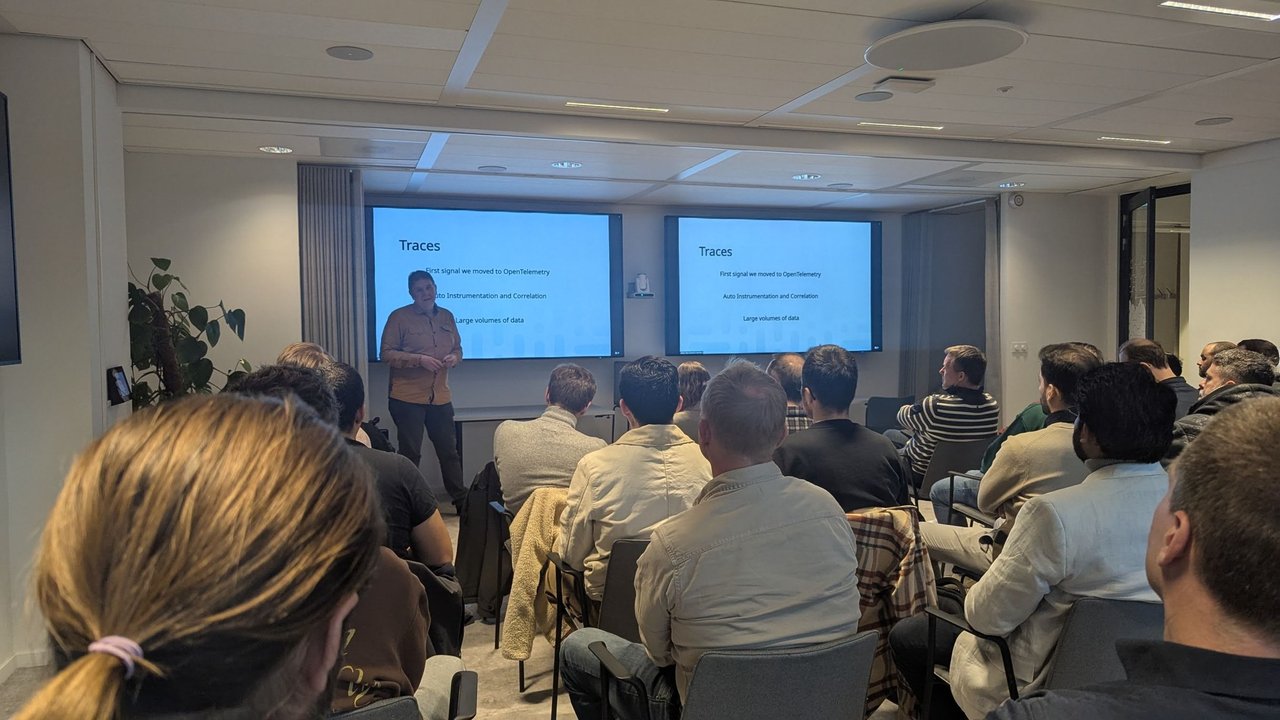
The Traces slide: the first signal Collibra moved to OpenTelemetry, with auto-instrumentation, correlation and large volumes of data.
A few ideas from the talk that I took away:
- Telemetry as business data. Beyond observability, he talked about cost tracking (a cost model built from telemetry for the infrastructure provisioned per customer) and security-style audit events for tenants.
- Own semantic model on top. Because the platform is multi-tenant, they add attributes such as a tenant environment ID and build their own semantic layer over the OpenTelemetry one, so any backend that understands the model knows what is what.
- Events instead of pre-aggregated metrics. His argument was that once you aggregate, for example into an average, you lose the raw detail, so he prefers to send raw events with attributes and create metrics later. In OpenTelemetry’s semantic conventions, an event is a log record with an event name, which is why he called it “built on top of logs” and complained it is under-advertised.
- A real dashboard. He showed one API call plotted per tenant over about ten weeks of raw data in Elastic, where weekends and the Christmas period show up as gaps, as an example of what raw data buys you for performance analysis.
The pipeline: queue first
The architecture slide section was the part I found most useful. His advice, “you really need a queueing system in the middle”, came from running a large, multi-region platform where backends sometimes choke. Their design, as described:
- Collectors in every region send OTLP over gRPC and HTTP to one telemetry backbone endpoint. These are Collectors built from the open-source one plus some custom code.
- The first step is to get the data into a queue, Google Pub/Sub, for which they contributed a receiver and exporter. He noted Pub/Sub retention is limited to seven days, which is enough for them, while Kafka users could keep data much longer.
- The data is also backed up to Google Cloud Storage so business processes can build daily reports in BigQuery.
- Streaming jobs (the slide says Apache Beam does streaming calculations on the OTLP data) derive metrics, for example from Istio load balancer logs mapped back to their OpenAPI specs, giving per-API latency and call counts.
- A second Collector stage enriches (tenant master data), filters (logs that are not events are not sent to Elastic) and then writes to several backends, which he listed as Google logging and tracing, Elastic and Datadog. Adding another backend means adding another consumer.
He was frank that this processes some things twice, but said it is cheaper than storing everything in Pub/Sub, and that observability costs money so it is all about the right trade-off for their use case.
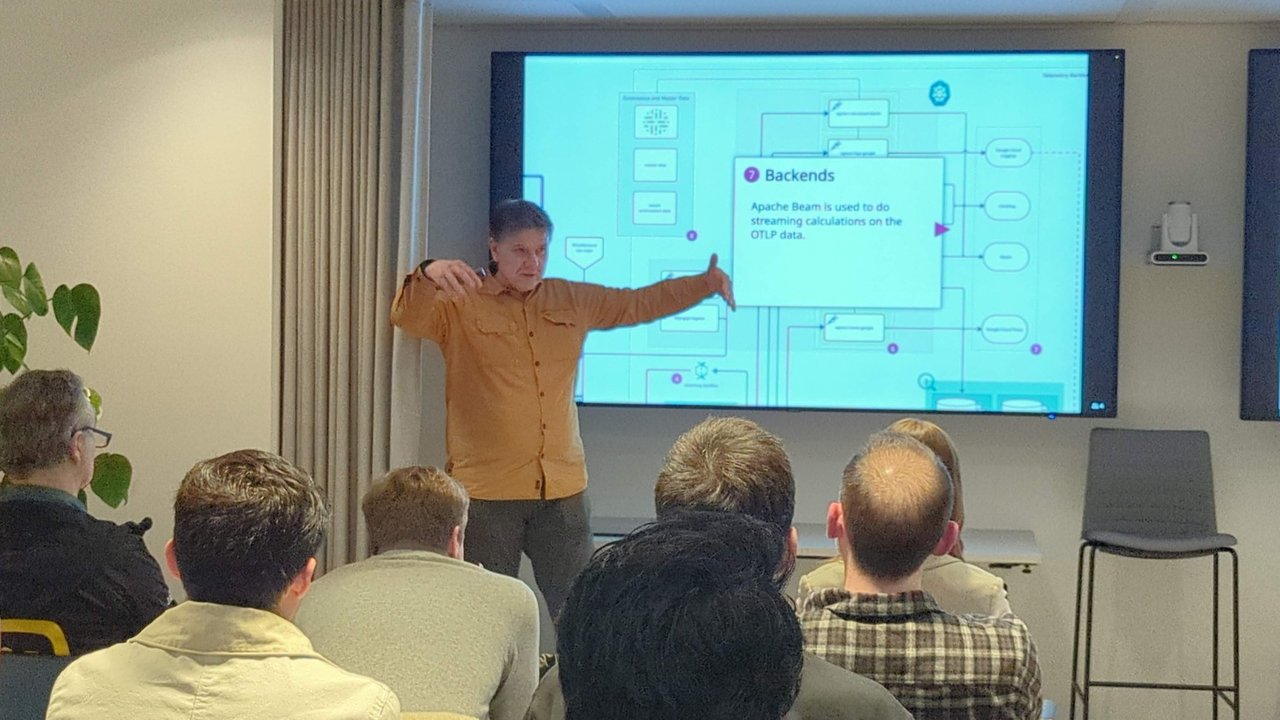
The Collibra telemetry pipeline diagram, with the Backends step: Apache Beam streaming calculations on OTLP data.
On Kubernetes, he said they run different Collector variants for different jobs rather than one DaemonSet and one Collector, split out heavy sources, and scrape Prometheus data per node because their clusters are too big for a single cluster-wide scraper. My take: that is a good reminder that the default “one DaemonSet plus one gateway” layout is a starting point, not a rule, once volumes grow.
Telenet: Day 0 for OTEL, and a Kafka-based log pipeline
The next speaker, whose “About me” slide gave the name Jo De Troy, presented the third user talk. A slide in it was titled “Day 0 for OTEL @Telenet”, so this was Telenet’s story of starting with OpenTelemetry. It answered the question “why OpenTelemetry?” with workloads that traditional APM agents handle badly:
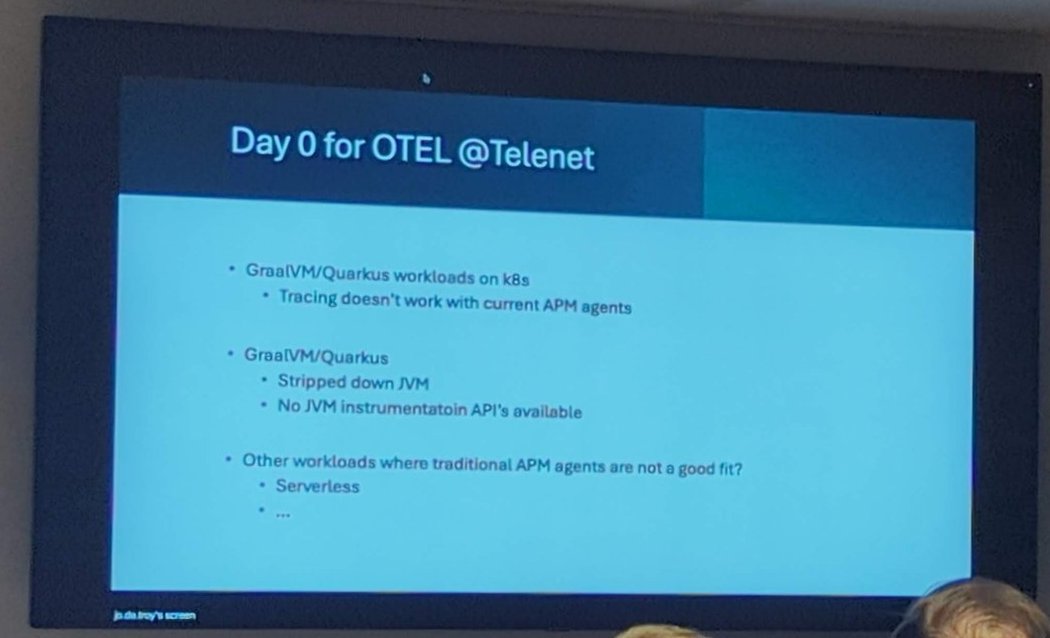
The “Day 0 for OTEL @Telenet” slide.
- GraalVM and Quarkus workloads on Kubernetes: the slide says tracing does not work with the current APM agents.
- A stripped-down JVM: no JVM instrumentation APIs are available. In the room the speaker explained they had looked at the instrumentation APIs of the JVM, found they are not there on GraalVM Quarkus, and concluded there is no real alternative to OpenTelemetry for getting tracing out of that kind of workload.
- Other workloads where agents do not fit: the slide asks the question, and serverless is the example it lists. In the speaker’s words from my recording, native agents are not really going to work there.
The same talk then moved to how logs get into Elastic. His slides showed a “Log Data flow” and a “Future Data flow”: sources such as load balancers and agents feed a shipper layer (Logstash, which mainly decides which Kafka topic a message goes to), Kafka acts as the buffering layer, a second layer does the heavy parsing, and Elastic with Kibana sits at the end. He said the data is mostly JSON so little parsing is needed, that for bare-metal hosts or network appliances where you cannot install an agent you still need other ways to get data in, and that Kafka makes it easy to forward the same data to other vendors or use cases.
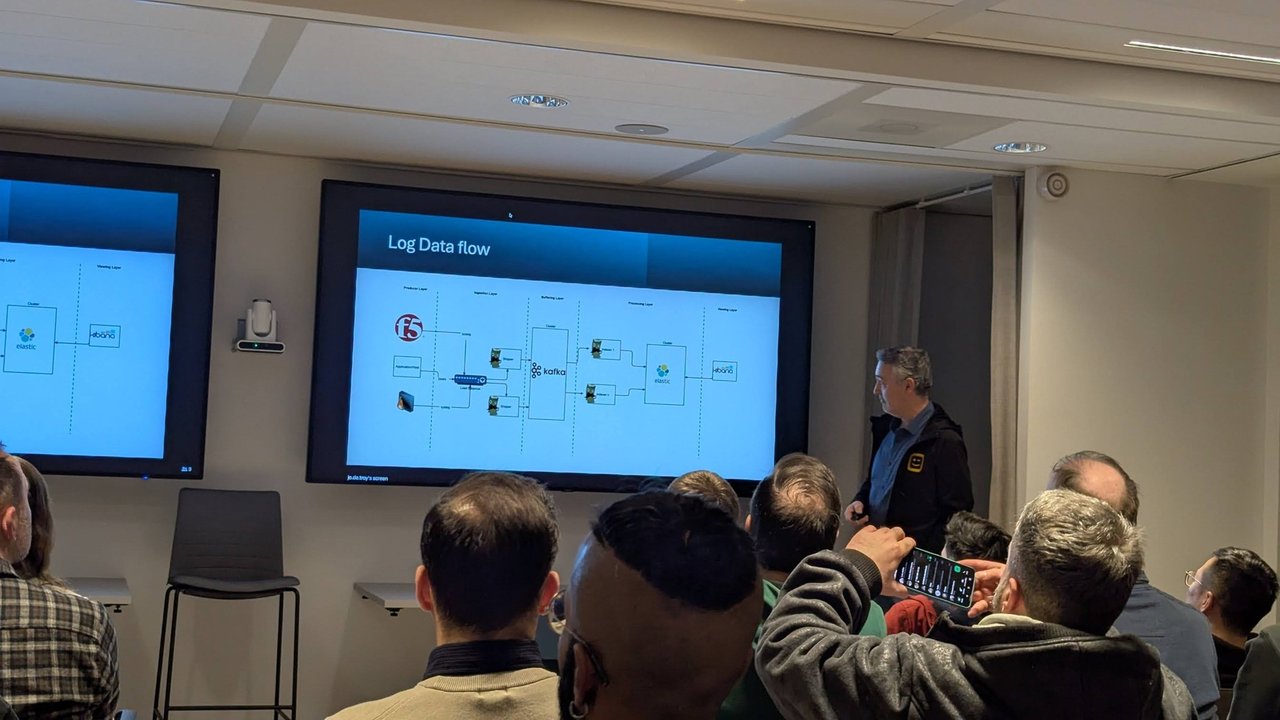
The Log Data flow slide: producers, ingestion, a Kafka buffering layer, processing and Elastic with Kibana.
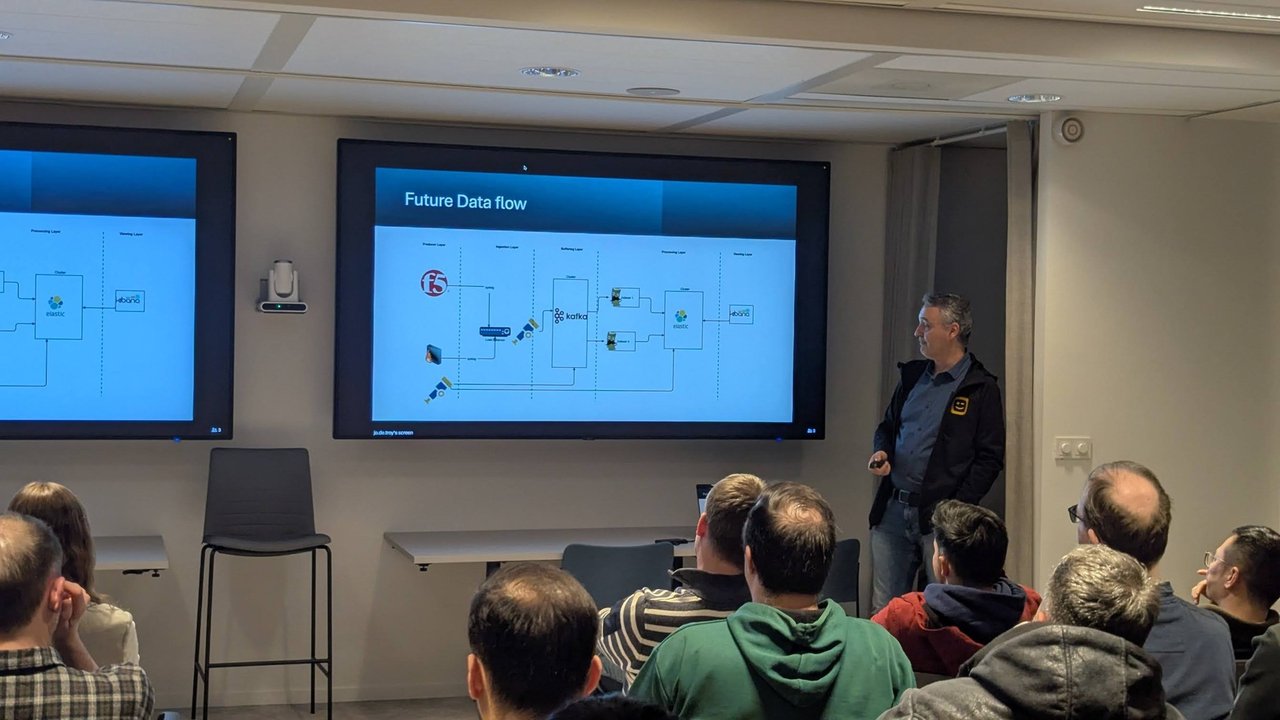
The Future Data flow slide: producers, ingestion, a Kafka buffering layer, two processing nodes, Elastic and Kibana.
My take: Telenet’s case is a good test for any observability choice. If your fleet includes native-compiled or serverless workloads, check how you will trace them before you standardise on an agent.
Elastic’s Kubernetes demo: the OTel Operator and EDOT
The closing session was a live demo from the Elastic side, with a disclaimer up front: the speaker did not recommend running this path in production yet, and Elastic supports it through onboarding in technical preview.
The OpenTelemetry Operator is an upstream project, not an Elastic product. It manages two things on Kubernetes:
- Collectors, through an
OpenTelemetryCollectorcustom resource that runs in four modes: Deployment, DaemonSet, StatefulSet or sidecar. - Auto-instrumentation, through an
Instrumentationresource that says where to export (endpoint, API key), plus an annotation on the workload. For a Java app,instrumentation.opentelemetry.io/inject-javadoes it; if the config lives in another namespace you reference it as namespace/name.
The demo flow, as shown:
- Start from an empty Kibana, choose Add data, then Kubernetes, and pick the new OpenTelemetry route in technical preview instead of the classic Elastic Agent route.
- Add the Helm repository and install the Operator with values prefilled with the API key and endpoint, which tell it to use the EDOT Collector instead of the vanilla one. The speaker stressed the configuration is public.
- The Operator created a DaemonSet for node-level logs and metrics and a single Deployment for cluster-wide metrics (cluster stats only need collecting once). The cluster was minikube, so one node.
- Annotate a Java deployment with the inject-java annotation, roll it out again so the agent is injected, and watch the APM overview, service map, SDK version, Kubernetes metadata, latency, throughput and transactions appear in Kibana.
- Create an SLO from that data, such as 99.9 percent availability, and get notified when it is breached.
The speaker also pointed out this is GitOps-friendly because everything is a manifest, and self-service: teams add an annotation and get instrumentation. You can still instrument at packaging time or add span attributes in code, for example a flag for a feature under test, so that you can later link an issue to it in Elastic.
An earlier Kibana example in the same session showed a spike in network logs from a customer that turned out to be a DDoS attack, and the host involved was found without trawling through all the data.
Before you leave: the closing slide
The last slide pointed to Elastic’s observability labs and its EMEA workshops, both linked from QR codes: Elastic Observability Labs and the workshop sign-up at ela.st/emea-workshops.
What I took from the evening
- OpenTelemetry’s value shows up when you treat it as a pipeline you own: collectors, a queue and several backends, not a single vendor agent.
- A shared schema (ECS, or OpenTelemetry’s own semantic conventions) is what makes correlation possible across teams.
- Queue first is a design worth copying if you collect globally, because backends will have bad days.
- Operator-based auto-instrumentation is a strong self-service story for Kubernetes platform teams, even if the Elastic-specific path was still in technical preview at the time.
If you are planning an observability stack, my OpenTelemetry on Kubernetes guide covers the practical side.