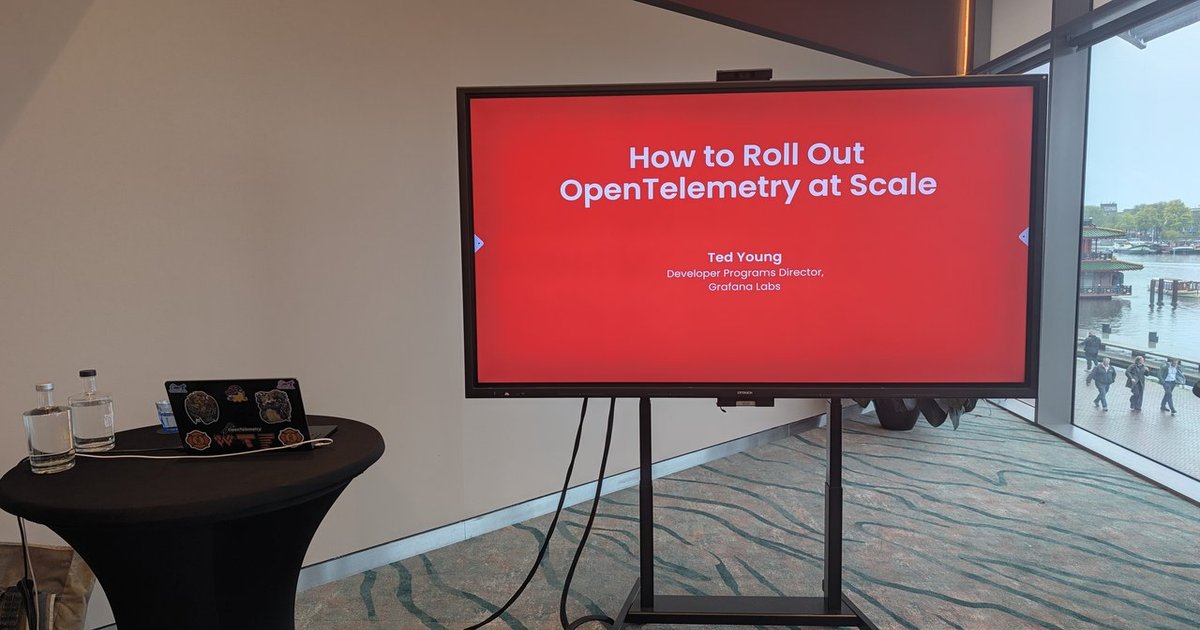
After you’ve solved the “installing everything by hand sucks” problem and deployed OpenTelemetry across your organization, a new challenge emerges: maintaining everything forever.
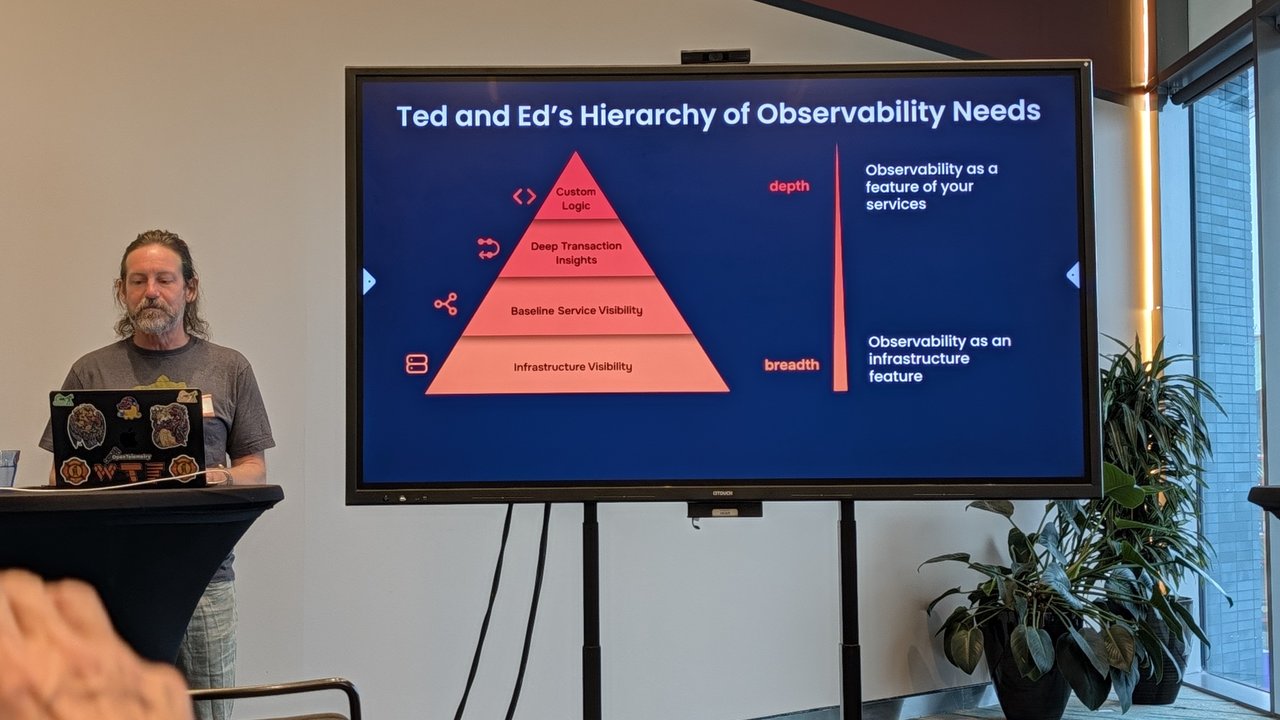
“Maintaining everything forever.” — The hidden operational cost of observability at scale.
The Three Silent Killers
The slide laid out three ongoing concerns that quietly erode the value of your observability investment:
- Complexity at scale — As you add more services, the Collector configuration grows exponentially. Sampling strategies that worked for 10 services become unwieldy at 100, and impossible at 1,000.
- Hard to track things — Which services are emitting which signals? Which pipelines are actually in use? Which dashboards matter? Metadata debt accumulates silently.
- Costs grow faster than you can control — Telemetry volume grows with user traffic, but the marginal cost per signal is rarely linear. Cardinality explosions, trace tail-sampling misses, and unbounded log emission can turn a $500/month bill into a $5,000/month crisis overnight.
The Scale Reality
At small scale, OpenTelemetry is straightforward. A single Collector instance, a few auto-instrumentation libraries, and you’re done. The dashboards are clean, the costs are negligible, and everyone’s happy.
At scale — hundreds of services, thousands of hosts, millions of requests per second — the story changes. The Collector itself becomes a distributed system that needs its own observability. The sampling strategy that saved you money at 100 RPS is now dropping the traces you need to debug a production incident. And the cost per request doesn’t decrease — it increases — as you try to maintain the same level of signal quality.
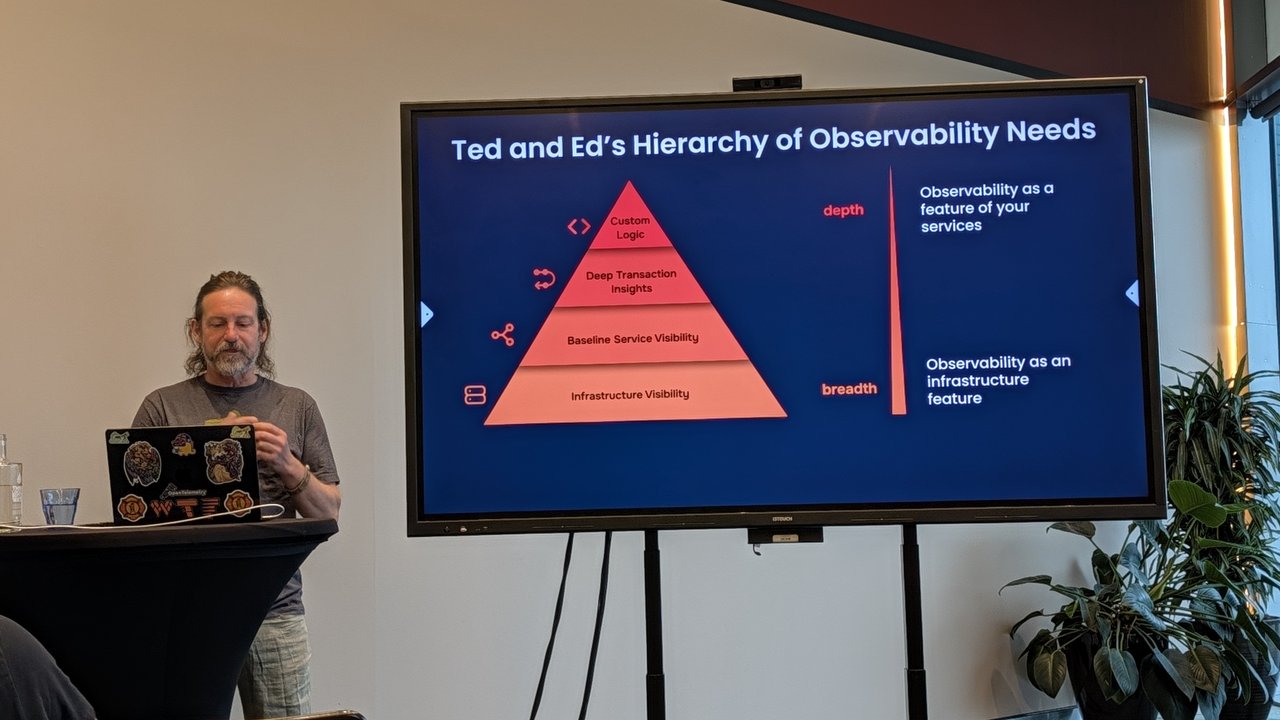
Attendees discussing cost and maintenance strategies during a coffee break — these are the conversations that never make it into the slides.
The Tracking Problem
One of the most underappreciated challenges is metadata tracking. When you have 200 microservices, all emitting telemetry through OpenTelemetry, how do you know:
- Which services are actually sending data?
- Which pipelines are processing which signals?
- Which dashboards are still relevant vs. orphaned?
- Which alerts have been tuned, and which are still firing on defaults?
Without a systematic approach, you end up with what one attendee called “observability sprawl” — a growing pile of dashboards, alerts, and pipelines that nobody can fully account for.
Cost Control Strategies
The event surfaced several practical strategies for keeping costs manageable:
1. Cardinality Budgets
Set hard limits on the number of unique attribute combinations per service. If your HTTP route tag can take 10,000 unique values, the cost explodes. Enforce limits at the library level.
2. Tail-Based Sampling
Don’t sample at fixed rates — sample smarter. Drop successful health-check traces, keep error traces, and use adaptive sampling that adjusts based on throughput.
3. Tiered Storage
Not all telemetry is equal. Route high-cardinality debug traces to cheap storage, and keep production SLO metrics in premium real-time dashboards.
4. Regular Audits
Schedule quarterly reviews of your observability pipelines — decommission abandoned dashboards, tune noisy alerts, review sampling strategies.
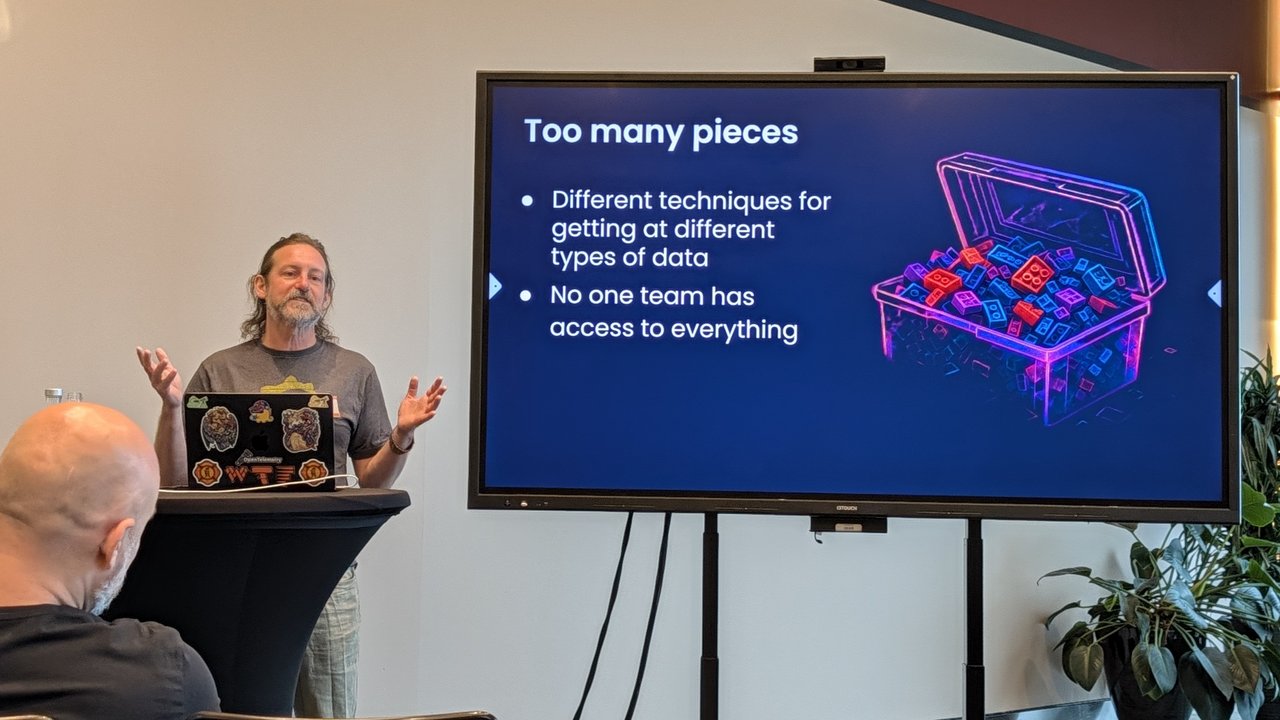
The coffee break conversations were where teams shared their cost-management war stories — often the most valuable part of any event.
The Patchwork Tax
One recurring theme throughout the day was the cost of fragmentation — the “too many pieces” problem applied to maintenance:
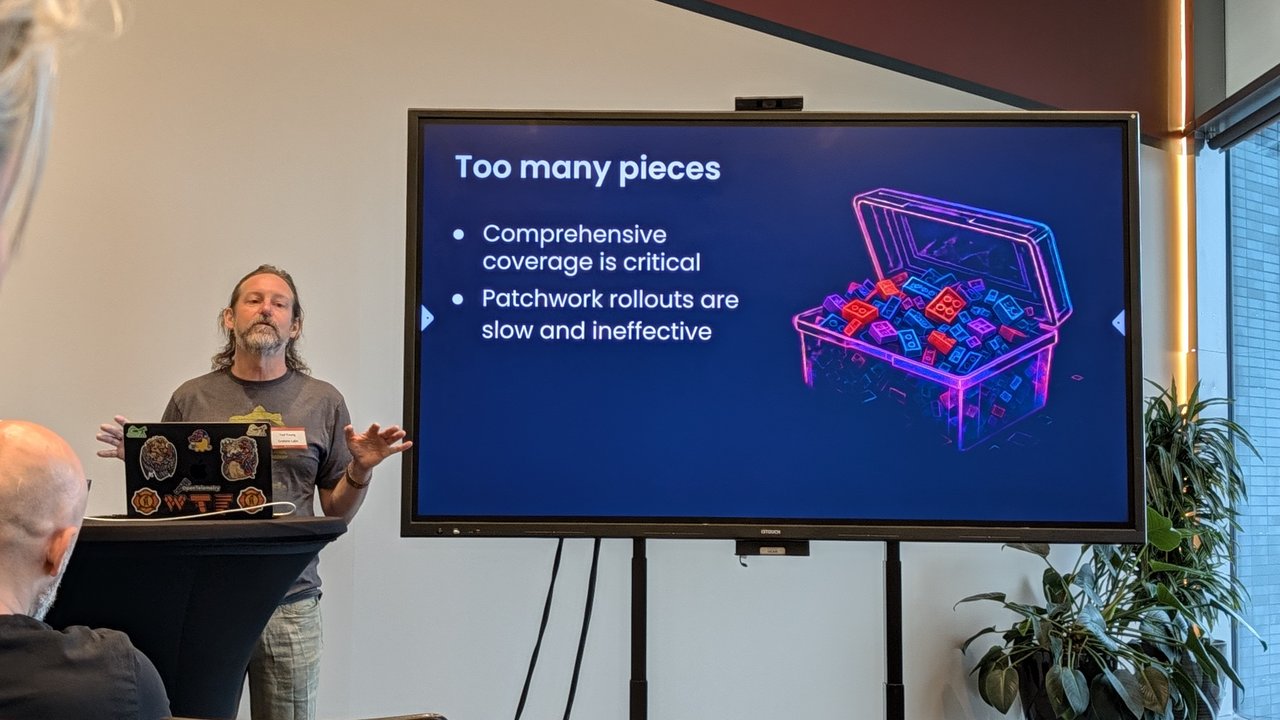
When you use different techniques for getting at different types of data, and no single team has access to everything, every piece becomes a maintenance burden. A metrics pipeline in one tool, logs in another, traces in a third, profiling in a fourth — each needs its own upgrade cycle, its own cost model, its own on-call rotation.
Building for the Long Haul
The most forward-thinking teams at the event were already thinking about operational debt — not just technical debt, but the accumulated complexity of running observability infrastructure over time.
Their approach:
- Component ownership — assign teams to own specific layers of the observability stack
- Version pinning with automated upgrades — lock versions in staging, test upgrades before production
- Documentation as code — every pipeline, every dashboard, every alert has an owner and a runbook
- Cost attribution — every service knows its telemetry budget and is alerted when it’s exceeded
The Balance
The tension is real: you need enough observability to debug production issues, but not so much that the cost and complexity of maintaining it becomes the problem. The goal isn’t to minimize telemetry — it’s to maximize signal-to-noise ratio.
As one attendee put it: “We spend more time maintaining our observability platform than our actual application. At what point does the cure become worse than the disease?”
The answer, the event suggested, is: when you lose sight of the goal. The goal isn’t more telemetry — it’s better decisions, faster. Every component of your observability stack should contribute to that goal, or it should be retired.
Related Reading
- How to Roll Out OpenTelemetry at Scale: Grafana Labs Amsterdam Recap
- Installing Everything by Hand Sucks: The Automation Imperative
- Ted and Ed’s Hierarchy of Observability Needs
About the Author
I am Luca Berton, AI and Cloud Advisor. I work at the intersection of cloud security, platform engineering, and enterprise AI deployments. Book a consultation.