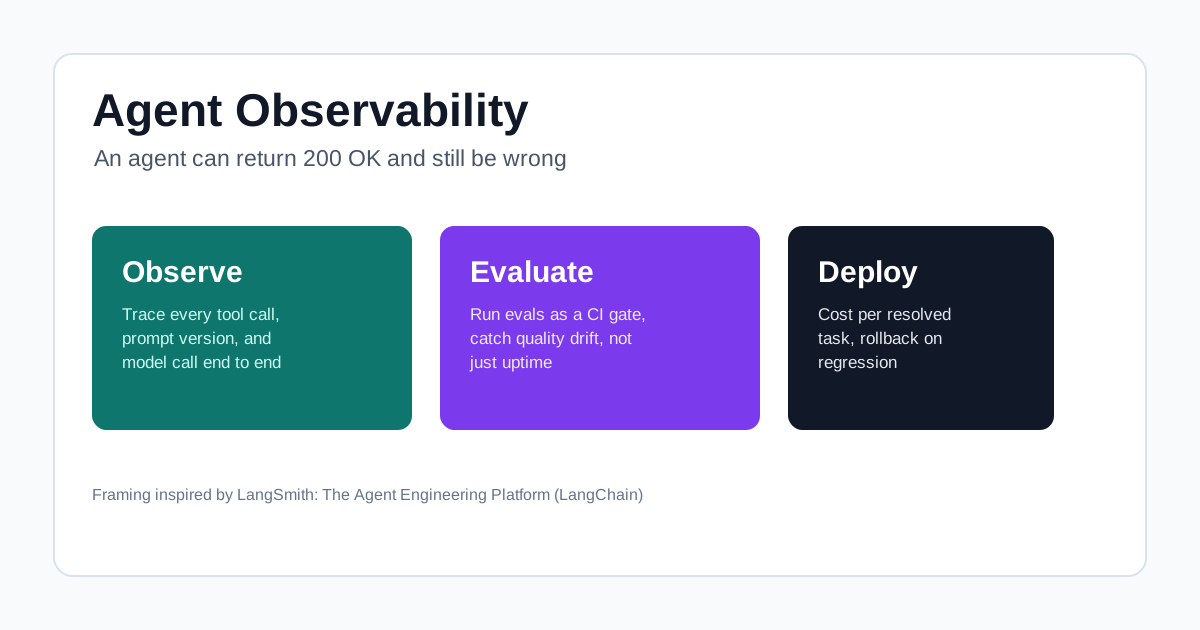
LangChain’s LangSmith now bills itself as “the agent engineering platform” — for observing, evaluating, and deploying agents, framework-agnostic. Whatever you think of the LangChain ecosystem, that three-word split — observe, evaluate, deploy — is a genuinely useful way to describe what’s missing from most teams’ first production agent, and I want to pull it apart from an infrastructure angle rather than a product one.
The Failure Mode Nobody’s Dashboard Catches
Here’s the uncomfortable fact about running agents in production: an agent can be “up” in every sense your existing monitoring cares about — 200 status code, acceptable latency, no exceptions in the logs — and still be quietly wrong. It picked the wrong tool. It hallucinated a plausible-sounding answer. It followed an outdated prompt version that someone shipped without a review. None of that shows up as downtime. It shows up as a customer complaint, or worse, it doesn’t show up at all.
This is why “agent engineering” needs its own layer, distinct from classic APM. The thing you’re watching for isn’t service health, it’s semantic correctness — and that requires instrumenting things most infrastructure teams have never had to instrument before.
The Three Verbs, for Real
Observe. Trace every tool call and model call end to end, not just the request/response at the edge. When an agent takes five steps to answer one question, you need visibility into all five, because the failure is usually in step three, not the final output. Version your prompts the same way you version code — a prompt change is a behavior change, and if you can’t correlate a quality dip with the prompt version that shipped that week, you’re debugging blind.
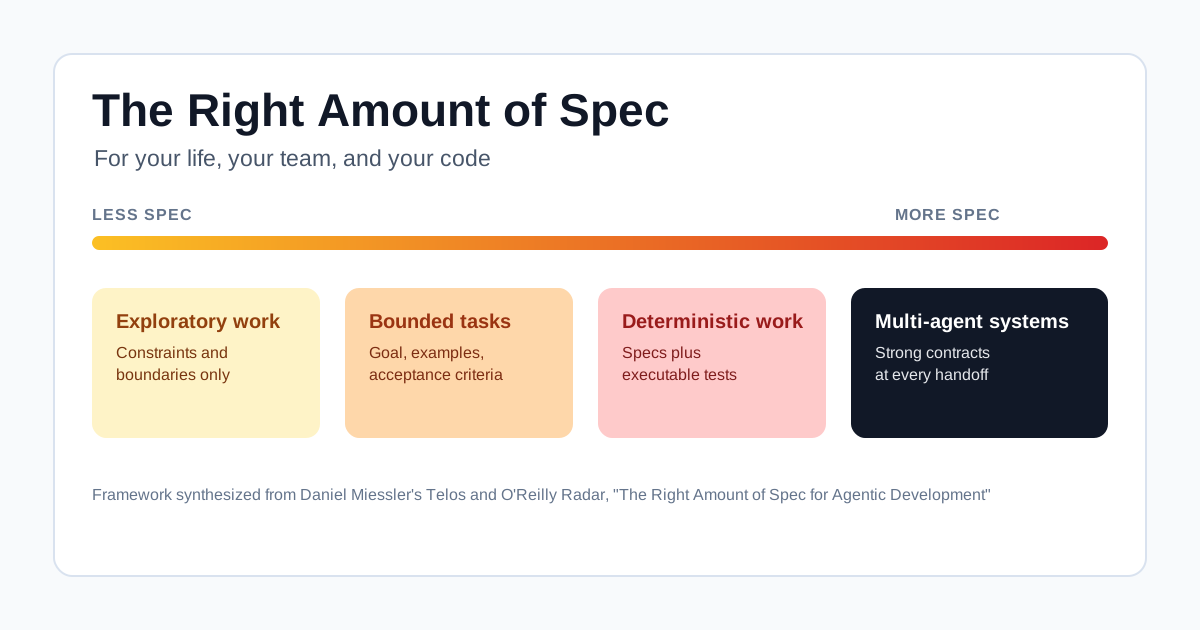
Evaluate. This is the one teams skip longest, and it’s the one that matters most. Evals are how you catch quality regressions before a customer does — running a fixed test set against every prompt or model change and blocking the ones that regress, the same way a CI pipeline blocks a failing unit test. The O’Reilly framing I wrote about here applies directly: an eval set is an executable spec for what “correct” means for this agent. Without it, you’re shipping vibes.
Deploy. Once you can observe and evaluate, deployment questions change shape. Cost per resolved task matters more than cost per request, because a cheap agent that fails and retries three times isn’t actually cheap. Rollback has to be as fast for a prompt or model version as it is for a container image — if a new model release degrades quality, you need the same one-command rollback muscle you’d use for a bad deploy, not a manual prompt-editing fire drill.
My Take: This Is Microservices Observability, One Layer Up
I’ve watched this exact pattern before. A decade ago, the hard-won lesson of microservices was that traces, metrics, and logs weren’t optional extras — they were the only way to debug a system where a single request touched a dozen services. Agent observability is the same lesson at a new layer: the “services” are now tool calls and model calls, and the new signal you have to track is quality, not just latency.
If you’re running inference on Kubernetes already — GPU scheduling, autoscaling, the usual production concerns — the honest gap for most teams isn’t the infrastructure layer, it’s this one. You can have a beautifully autoscaled inference cluster serving a model that’s been quietly degrading in quality for two weeks because nobody’s watching for that.
Whichever platform you pick — LangSmith or otherwise — the requirement is the same: treat evals as a release gate, not a nice-to-have dashboard, before you scale an agent past a demo.
Related Reading
- AI Observability on Kubernetes: LLM Monitoring
- LLM Observability and Monitoring in Production
- Observability for AI on Kubernetes: Three Layers
- GPU on Kubernetes: Getting Started with NVIDIA
Go Deeper
Observability is one of the four pillars in the AI Platform Engineer Bootcamp’s Week 3 — building an observability dashboard and operational runbook for a real deployment, not a slide about best practices.
- 🎯 AI Platform Engineer Bootcamp — four weeks from infrastructure experience to AI-platform capability
- 📋 AI Platform Engineer Readiness Scorecard — free, 10 minutes, no signup