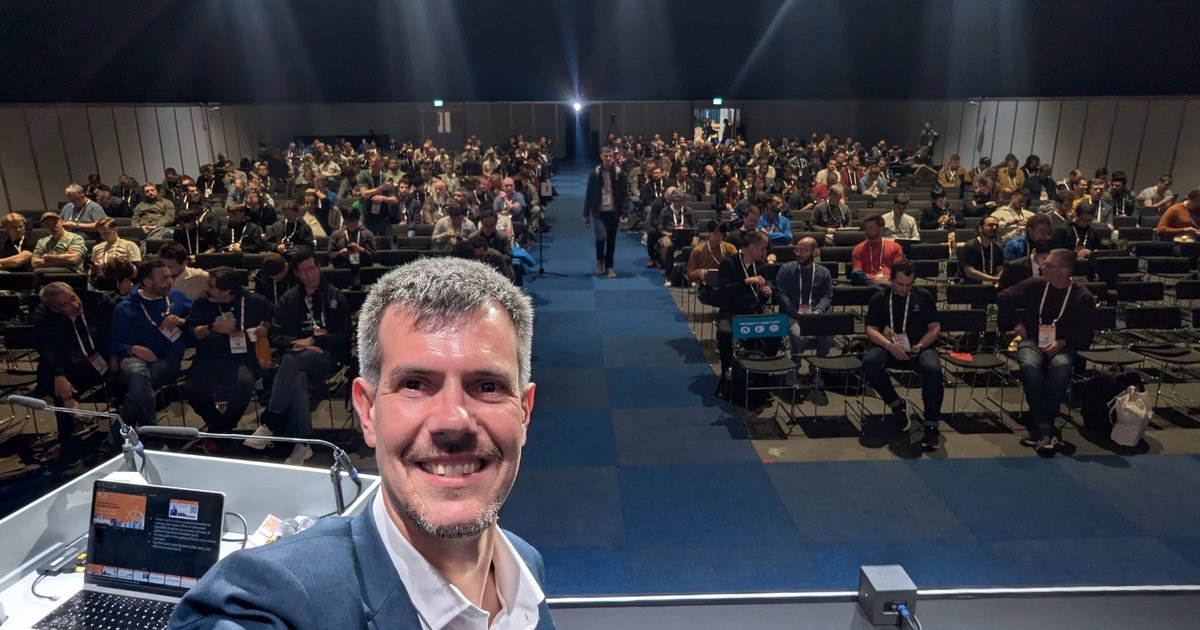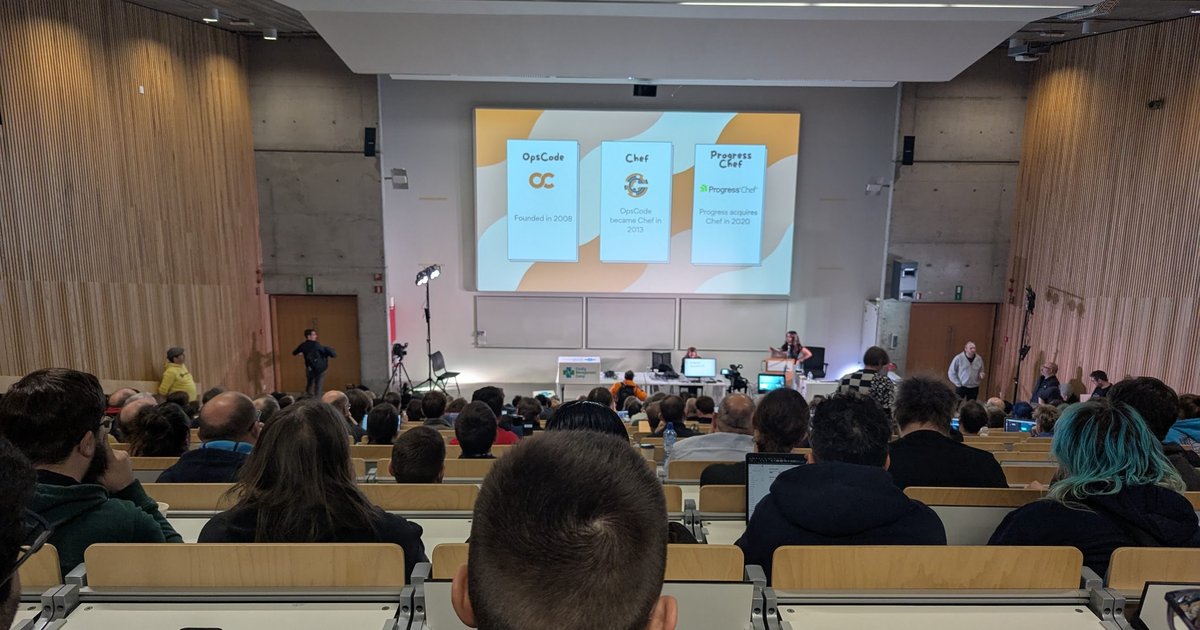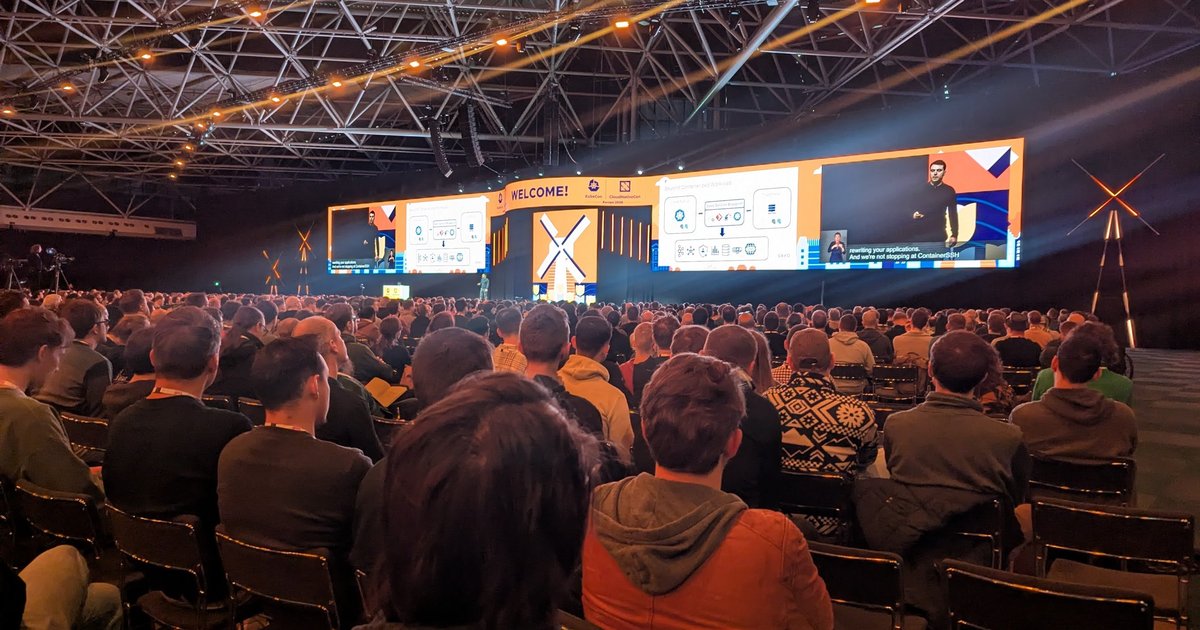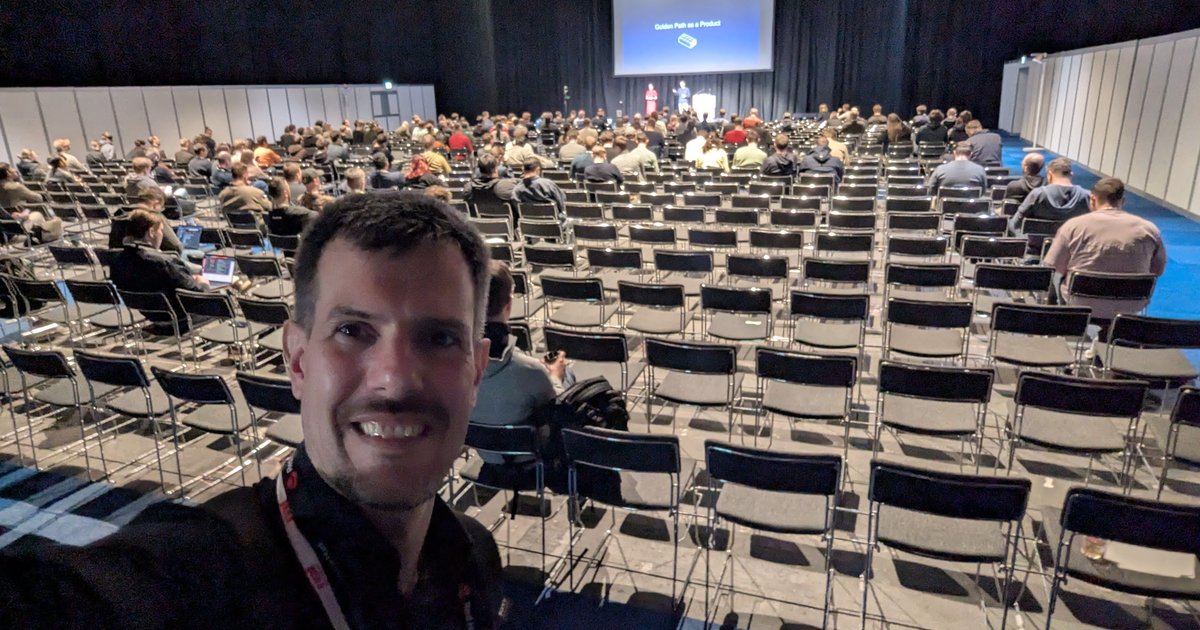
KubeCon + CloudNativeCon Europe 2026 opened on Monday 23 March with the co-located events at RAI Amsterdam. My week-in-photos recap gives that day two photos and one paragraph. This post covers the talks themselves: what was on the slides at Platform Engineering Day Europe, Observability Day Europe and ArgoCon Europe, and then at Signal Overflow, the SRE NL meetup at Booking.com that evening.
Platform Engineering Day: Golden Path as a Product
The first session I caught in the Platform Engineering Day hall was Golden Path as a Product, presented by two speakers. The summary slide boiled it down to four ideas:
- Start small
- Community first
- Defeat bureaucracy
- Solve shared pain
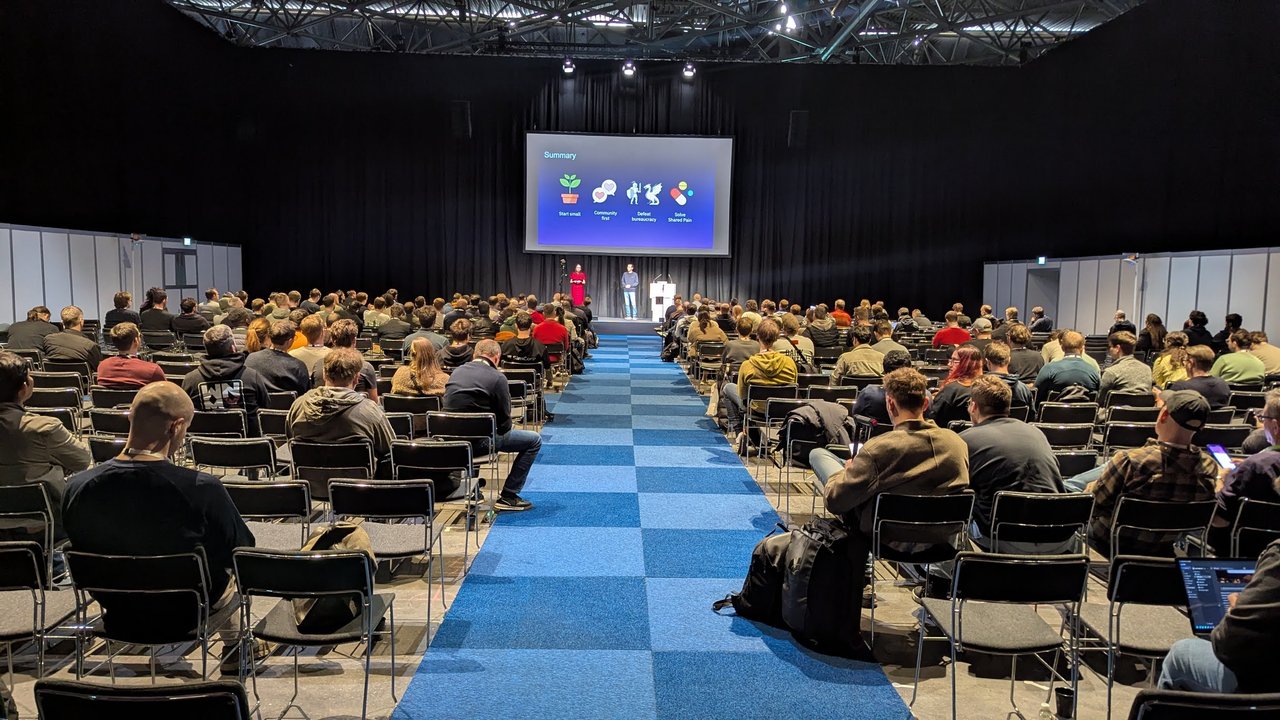
The summary slide of Golden Path as a Product, with a full hall on the blue-carpet aisle.
The closing slide was a QR code for InfraKitchen, described as an “OSS Developer Platform”. The code links to electrolux-oss/infrakitchen on GitHub.
My take: “solve shared pain” is the one teams skip most often. A golden path that fixes a problem only the platform team has is a roadmap item, not a product.
Platform Engineering To The Rescue: zero-day preparation
Next came a panel: Platform Engineering To The Rescue: A Practical Guide To Zero Day Preparation. The title slide listed five panellists:
- Hannah Foxwell, Co-Founder, BIMP
- Josh Bressers, VP Security
- Erika Heidi, DevRel, Chainguard
- Justin Cormack, Independent, Ex-CTO Docker
- Sal Kimmich, Security Lead, GadflyAI
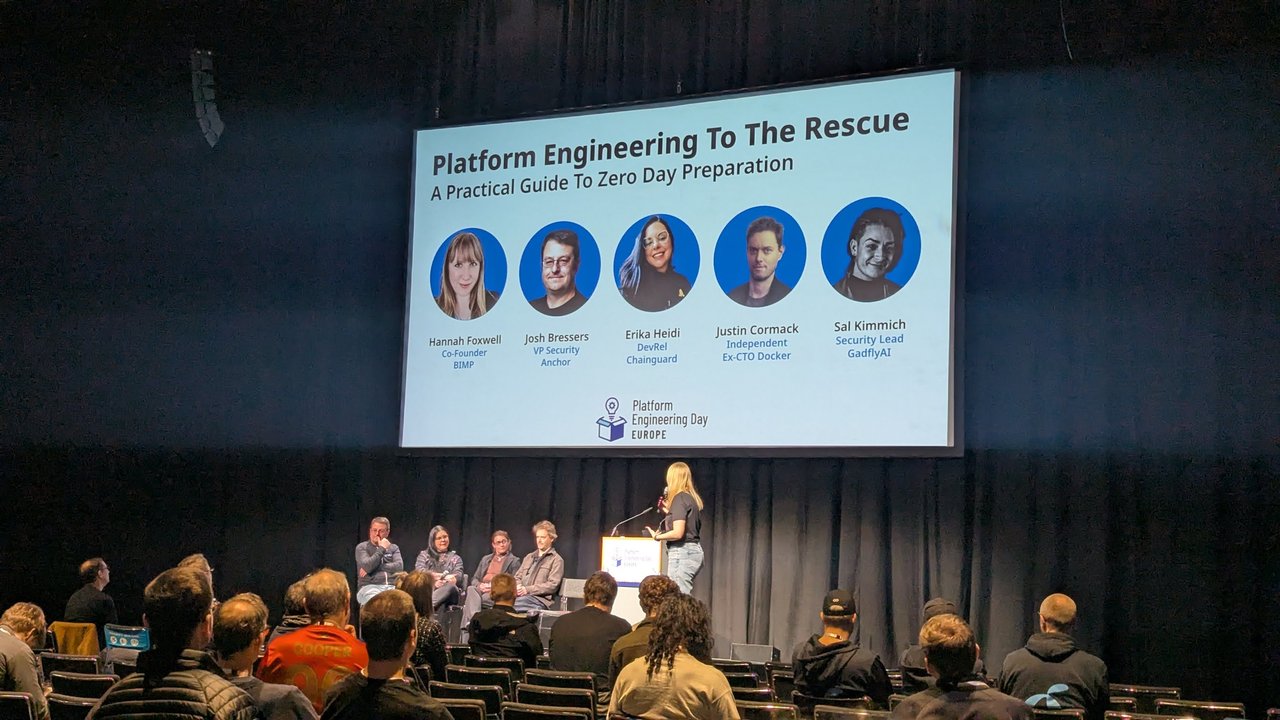
The zero-day preparation panel getting under way.
My take: a panel of security people at a platform conference says a lot. When the next big CVE drops, the platform is where you find out which images, clusters and teams are affected, and how quickly you can roll a fix everywhere.
Backend-First IDP: a production roadmap
Back in the same hall, Backend-First IDP: A Production Roadmap with Argo CD, Crossplane & OPA carried KodeKloud branding on every slide. It started with a slide called “The Developer Burden: 2026 Reality Check”:
- 75% of developers lose 6–15 hours weekly to tool sprawl
- On average, developers now juggle 7.4 different tools for basic operational tasks
- 78% of engineering teams wait 24 hours or more for SRE/DevOps assistance
- 76% of organisations admit that architectural complexity is a primary driver of developer stress and low productivity
The source link at the bottom of that slide pointed to Port’s state-of-internal-developer-portals report.
Next came The Portal-First Trap, told in two slides. The first was a cartoon: “Click to Run Jenkins Job” leads to Jenkins, then to an “Old Scripted Pipeline”, and finally “It’s Just a Website”. The second put a Backstage Catalog screenshot labelled “Sleek, Polished UI” next to a “Microscopic View” labelled “Piles of mismatched code snippets”.
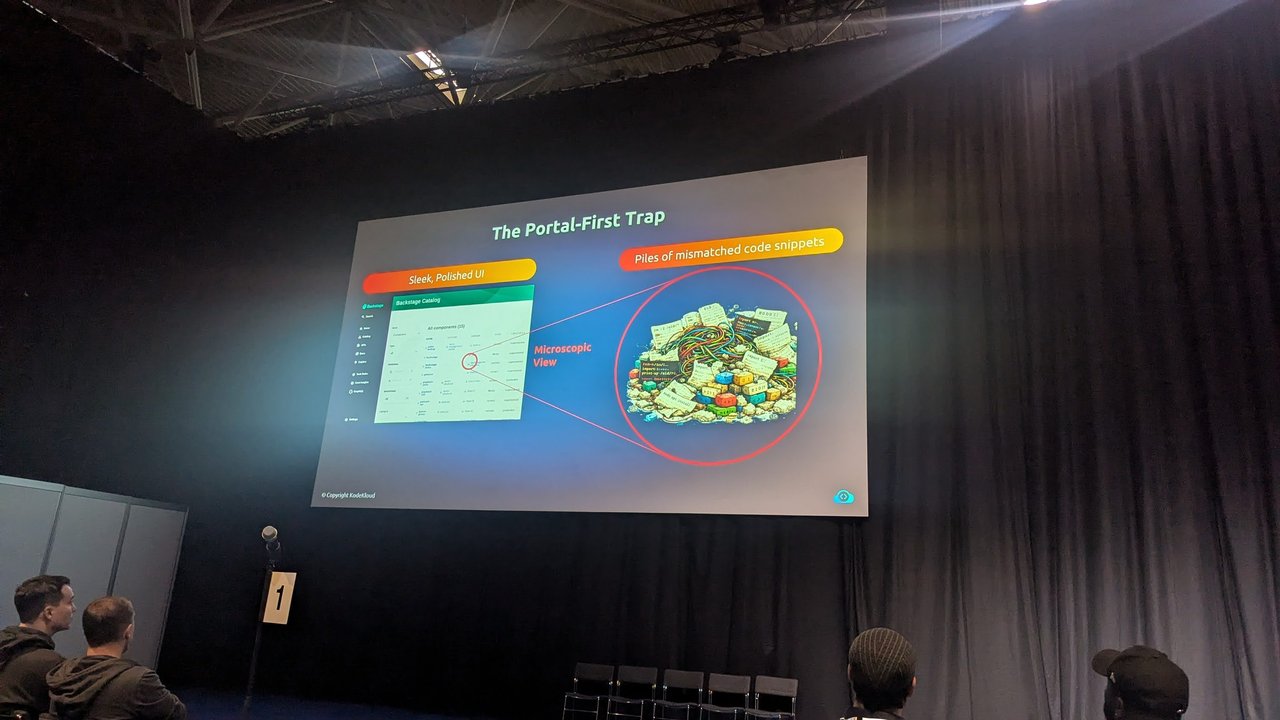
The Portal-First Trap: a polished catalog in front, mismatched code snippets behind it.
My take: this matches what I see with customers. A portal is only as good as the APIs and automation behind it. Build the backend first (GitOps, infrastructure composition, policy), and the portal becomes a thin layer on top instead of a facade.
Between sessions I stopped at the vCluster table, where a screen advertised Build a Multi-Tenant Kubernetes Platform for Internal Teams: isolated Kubernetes per tenant, self-service cluster access, centralised governance and policy, and fewer clusters to operate. Copies of Kubernetes Recipes were already on the table ahead of the signing the next day.
Observability Day: Let Me Be Your OpenTelemetry Champ
In the afternoon I moved over to the Observability Day room. The screens showed the next talk: Let Me Be Your OpenTelemetry Champ, credited to Red Hat and OllyGarden. Next to the stage, the sponsor board thanked Chronosphere and Dynatrace (Diamond), with ClickHouse, Coralogix and OpenSearch among the Platinum sponsors.
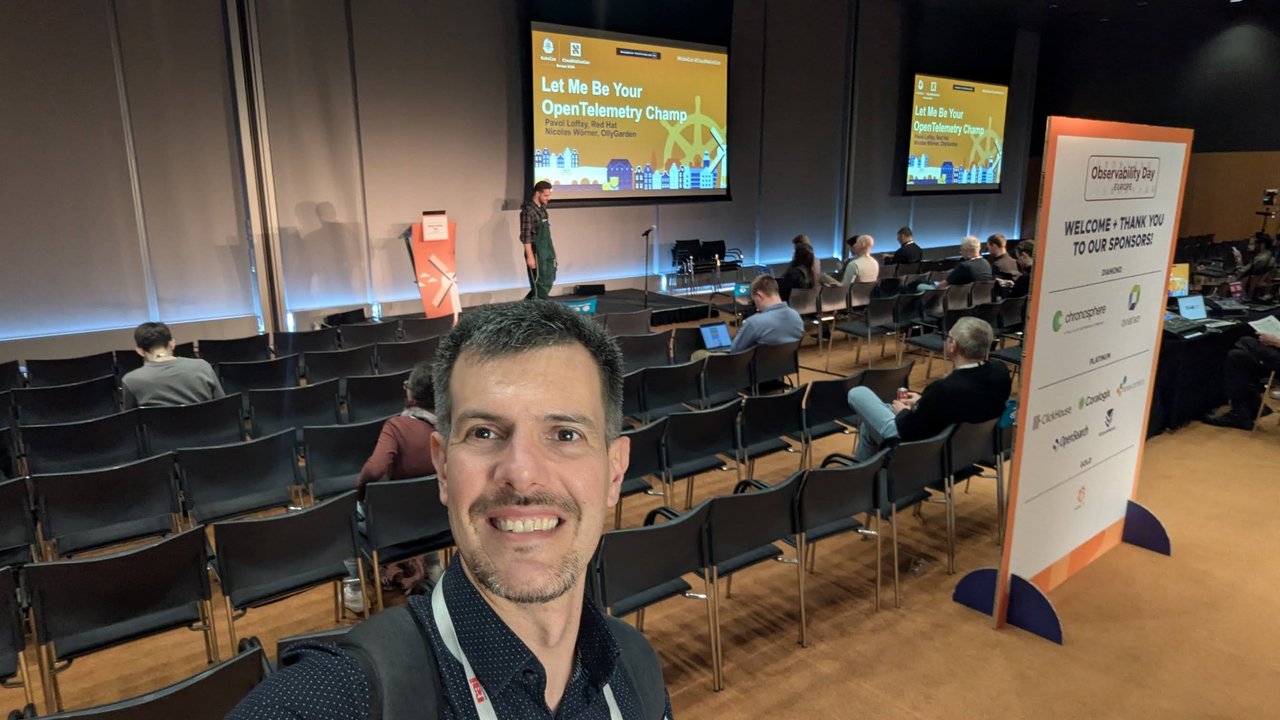
Observability Day, just before Let Me Be Your OpenTelemetry Champ.
For other OpenTelemetry conversations from the same week, see my posts on Dash0 and OpenObserve.
ArgoCon: The $10,000 Argo CD Mistake
My last co-located session was at ArgoCon Europe, in its auditorium at the RAI: The $10,000 ArgoCD Mistake: Eliminating Phantom Syncs and Scaling the Repo Server, presented by Aditya Soni. It was the most concrete talk of my day. The slides numbered four fixes:
- Reduce polling (“Relax… check later”). The
argocd-cmexample raised the reconciliation timeout to180s, which “drastically reduce[s] the number of API calls to Git providers and internal processing load”. - Event-driven webhooks (“Ping me only when needed”). Argo CD only wakes up when the Git provider notifies it of a change. The slide claimed this eliminates 99% of requests by removing the polling loop.
- Use ApplicationSet. Instead of managing 500 individual Application manifests, you define one pattern, and the ApplicationSet controller generates and maintains the Applications from the Git directory structure.
- Architect for scale. I didn’t photograph the fourth fix, but the lessons slide summed it up as “shard your repo server early”.
The results slide showed the same workload before and after: average CPU load from 3.8 cores to 0.9 cores (down 75%), peak repo-server memory from 12 GB to 2.5 GB across three shards (“No OOM”), and mean sync time from 600 s to 60 s (“10x faster”).
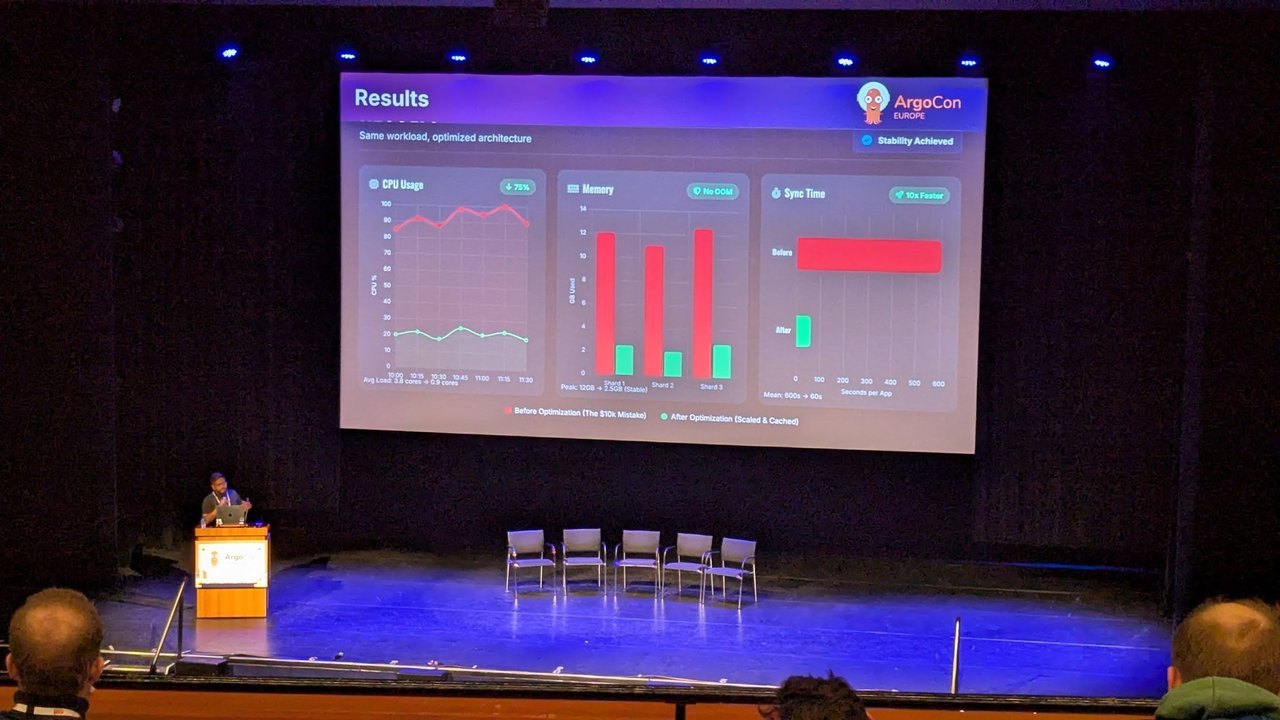
Before and after: same workload, optimised architecture.
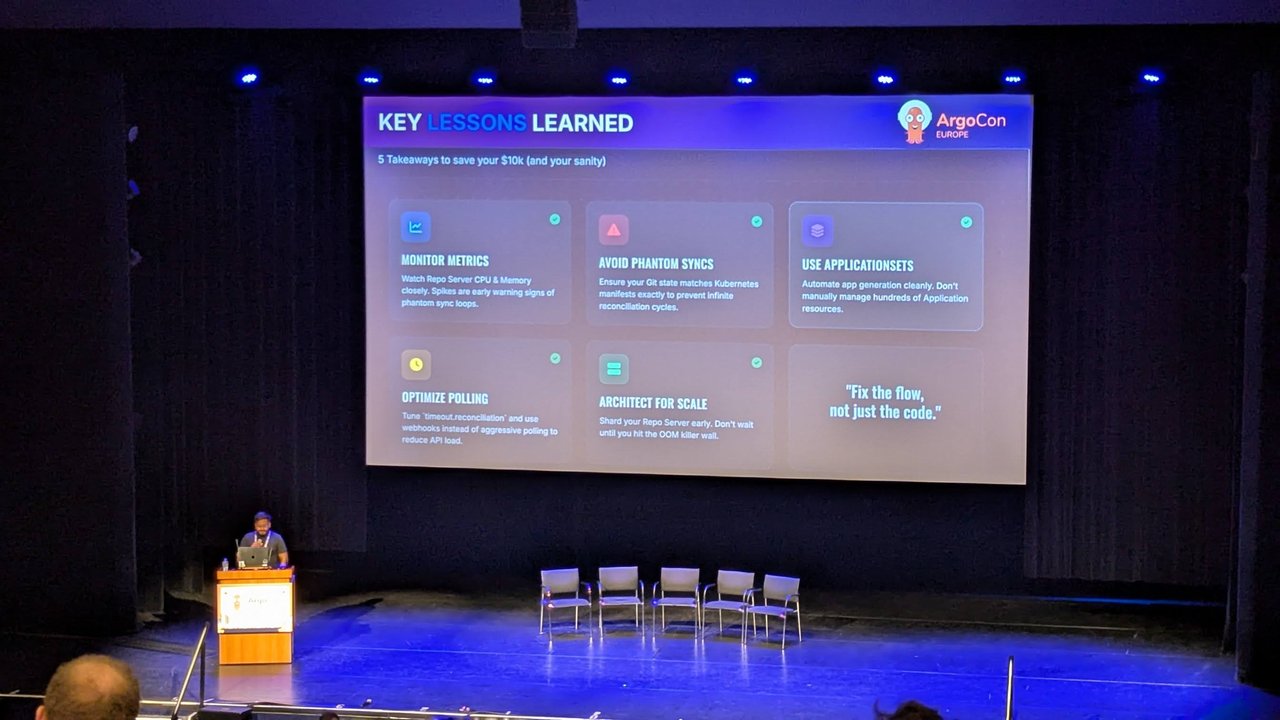
“5 takeaways to save your $10k (and your sanity)”.
The closing slide offered five takeaways: monitor repo-server CPU and memory (spikes are early warnings of phantom sync loops), make sure Git state matches the Kubernetes manifests exactly to avoid endless reconciliation, use ApplicationSets, tune timeout.reconciliation and use webhooks, and shard the repo server before you hit the OOM killer. The tagline was “Fix the flow, not just the code.”
My take: almost every large Argo CD installation I’ve reviewed runs on default polling with hundreds of hand-written Applications. These four changes are cheap, and they’re the first things I’d check. For another GitOps view from the same week, see Artem Lajko on GitOps with Kubara.
Evening: the talks at Signal Overflow
In the evening I went to Booking.com for Signal Overflow: Observability in the Age of AI, the SRE NL meetup. The book signing is covered elsewhere; here are the two talks.
Tracing for Grown-Ups: OpenTelemetry Best Practices for Large Systems began with a reference architecture: OTel SDK and auto-instrumentation, an L7 proxy, shared infrastructure, Kafka, managed databases and the OTel Collector. It then went through a Flask instrumentation example. One section, “Traces as analytics & BI source”, argued for enriching root spans with business attributes. That turns traces into a queryable fact table you can export to a data warehouse and use for user-journey funnels, A/B testing and cohort analysis. The talk closed with a six-point trace-quality checklist:
- Is the root span clearly defined?
- Are span names low-cardinality, with dynamic IDs moved into attributes?
- Are inbound requests tagged
SERVERand outbound calls taggedCLIENT? - Are queue handoffs tagged
PRODUCERandCONSUMER, so time in the queue is separate from processing time? - Do errors set
status_code=ERRORand record the exception, so tail samplers keep them? - Are business correlation IDs such as
order_idortenant_idattached via Baggage or span attributes?
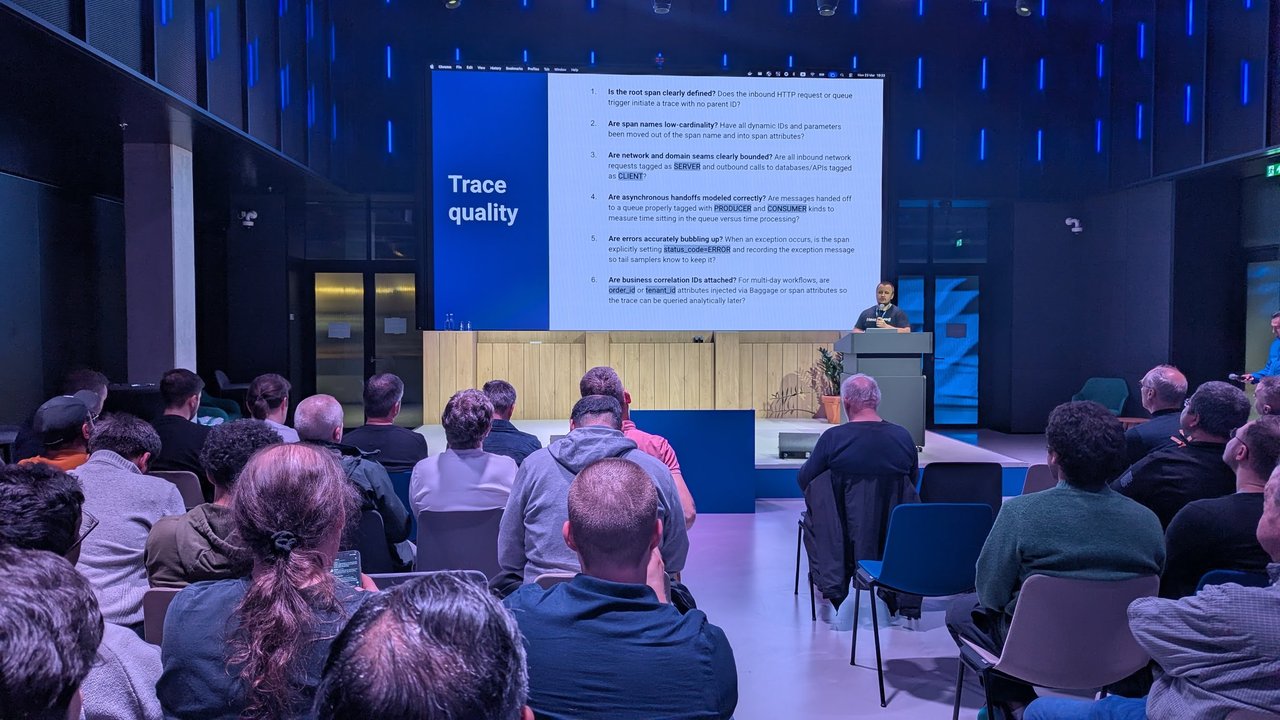
The trace-quality checklist. I’d print this one out.
The second talk was The AI Delivery Lifecycle: Observability for and with AI by Andi (Andreas) Grabner of Dynatrace. Its slides covered:
- “3 lenses on AI usage, cost and guardrails”: models, MCPs and agents
- MCP usage observability: which agents call your MCP server, which tools are popular, and where the errors are
- Coding-agent insights: coding agents that export OTel metrics and logs, configured with the standard
OTEL_EXPORTER_OTLP_*variables (including delta temporality andhttp/protobuf) - OTel-based GitHub Actions and workflow analytics
- Detecting bad patterns in observability data, such as duplicated spans, excessive logs and N+1 queries
- A demo of an agent with proper instructions, which the slide said queried 50% less data: “Reduces costs, is faster, more predictable!”
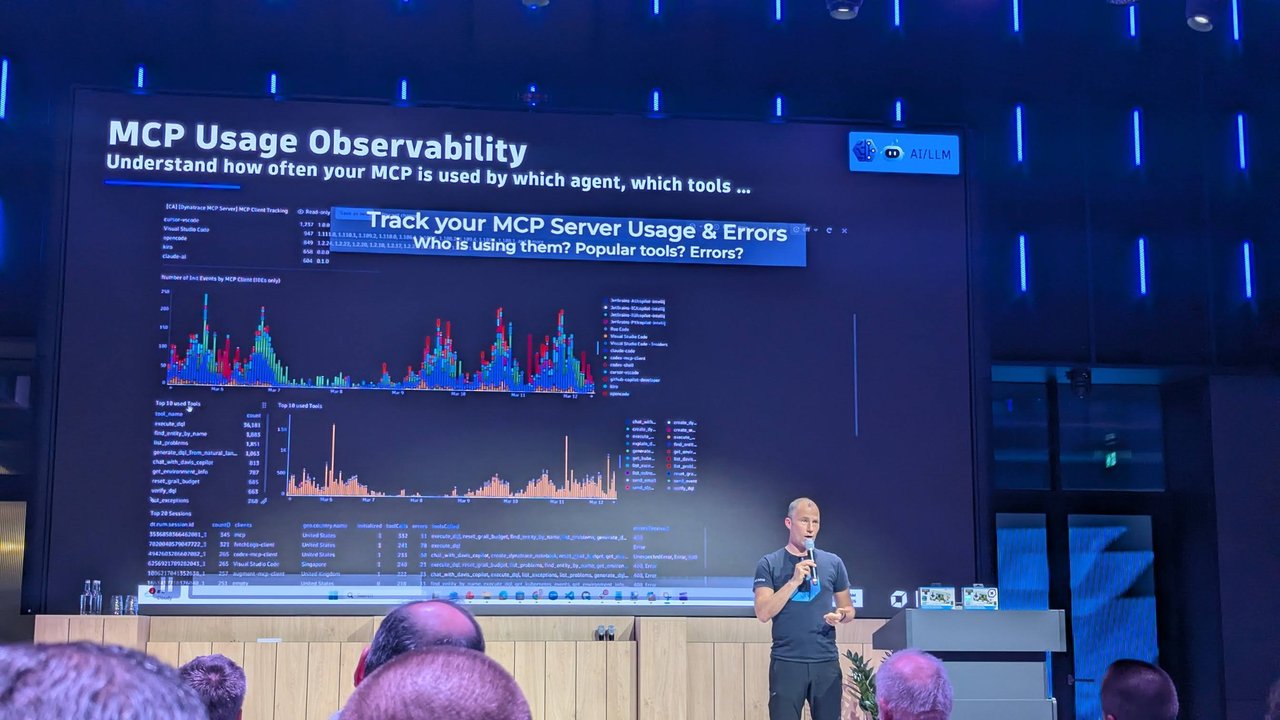
MCP usage observability: who is calling your MCP server, which tools, and which errors.
My separate conversation with Andi on the expo floor, about AI workloads and right-sizing, is in Dynatrace at KubeCon Europe 2026.
What I took from the day
The talks fit together better than the schedule suggested. Platform Engineering Day kept coming back to building the backend before the portal. ArgoCon showed what happens when you don’t tune that backend. Observability Day and Signal Overflow argued that traces and agent telemetry belong in the platform from the start, not bolted on after the first incident.