GPU sharing is easy to turn on and hard to judge. On Thursday 3 April 2025, at KubeCon + CloudNativeCon Europe in London, I sat in a session whose whole point was how to measure it: “A Practical Guide To Benchmarking AI and GPU Workloads in Kubernetes”. The schedule entry lists Yuan Chen, Principal Software Engineer at NVIDIA, and Chen Wang, Senior Research Scientist at IBM Research, at 11:00 BST in Room B, in the AI + ML track. Both names are on the title slide. The other posts from that week are linked from the KubeCon Europe 2025 hub post.
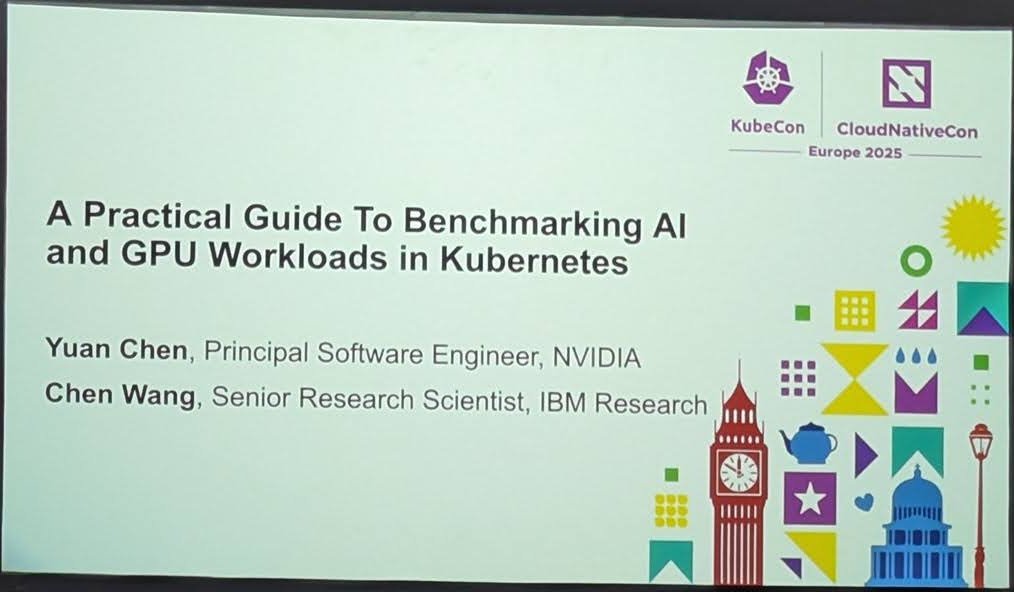
The title slide of the session.
According to the schedule, the talk covers setting up and running benchmarks on GPUs in Kubernetes with tools such as NVIDIA Triton Inference Server, MLPerf, fmperf and gpu-burn, and it is aimed at beginners. That matches the slides I photographed.
Triton as the system under test
Triton Inference Server is NVIDIA’s open source inference server, which serves models from several frameworks, and its repository also holds the Performance Analyzer. The “Triton Inference: Software Components” slide shows the three steps used throughout the talk: create a model repository (the example lists models such as resnet50, densenet_onnx and inception_graphdef), deploy Triton, and send requests with the Performance Analyzer.
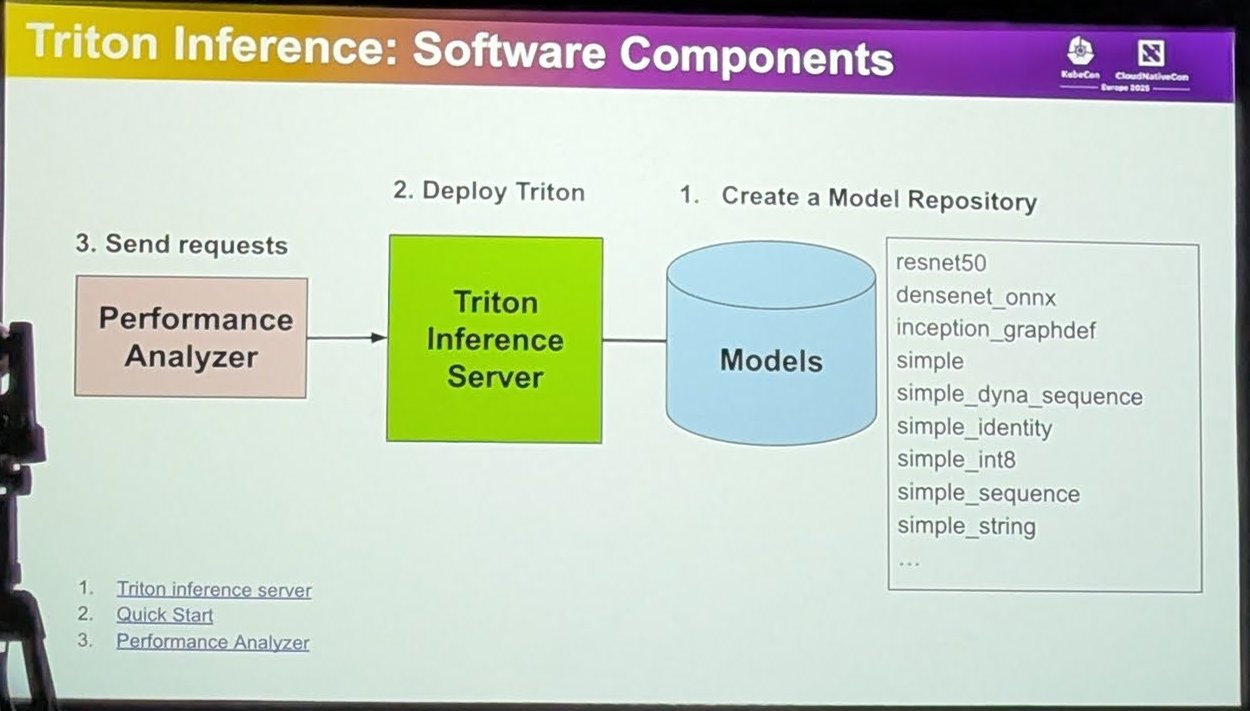
Model repository, Triton server and Performance Analyzer.
On Kubernetes this becomes a Pod for the server with its model repository, a Service exposing the endpoints, and a client Job that generates load. Another slide shows the server Pod’s container arguments pointing at the model repository, with separate ports for the inference and metrics endpoints.
Measuring generative AI models
For LLM serving, the next slide introduces GenAI-Perf, “a tool for measuring the performance of generative AI models”. It supports large language models, multi-modal models, embedding models, ranking models and multiple LoRA adapters. The metrics table is the part to remember:
- Time to first token and time to second token
- Inter-token latency
- Request latency
- Output and input sequence length
- Output token throughput and request throughput
The slide gives aggregations for most of these: average, minimum, maximum, p99, p90 and p75. The two throughput metrics are a single value per benchmark. The slide links to the GenAI-Perf documentation in the perf_analyzer repository. A short demo clip I recorded fits this: as I heard it, one user keeps sending requests while another scenario runs two concurrent users, the summary lands in a CSV file, a repetition parameter lets you rerun the same experiment for more robust results, and a detailed JSON file records per-token timestamps for decoding and prefill.
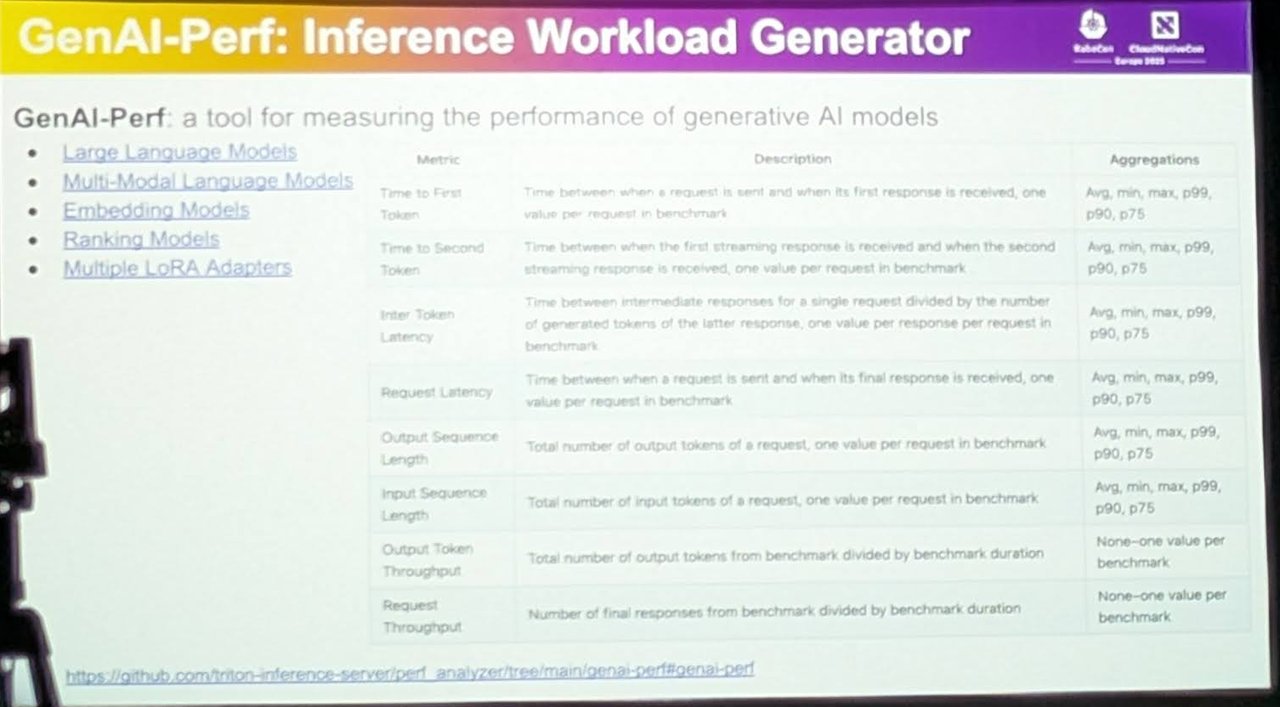
GenAI-Perf and its metrics table.
The talk also covers fmperf, a Python benchmarking tool for LLM serving frameworks that runs against Kubernetes clusters. A slide compares it with other benchmarking tools, and a later one covers gpu-burn, a CUDA stress-test tool that runs as a Kubernetes Pod. I am not covering those slides in detail here.
GPU sharing: time-slicing versus MPS
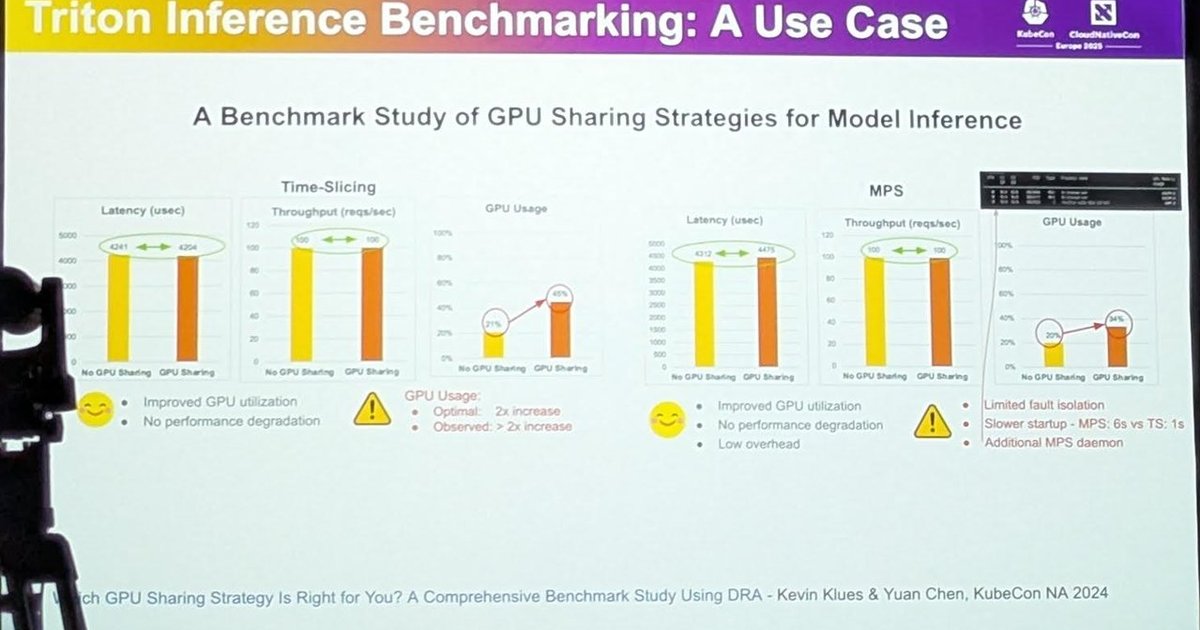
The slide that interested me most is “Triton Inference Benchmarking: A Use Case”, a benchmark study of GPU sharing strategies for model inference. It cites a KubeCon NA 2024 talk, “Which GPU Sharing Strategy Is Right for You? A Comprehensive Benchmark Study Using DRA” by Kevin Klues and Yuan Chen. It compares running without GPU sharing against sharing, for two strategies. These are the figures on the slide:
| Time-slicing | MPS | |
|---|---|---|
| Latency, no sharing versus sharing | about 4241 versus 4204 microseconds | about 4312 versus 4475 microseconds |
| Throughput, no sharing versus sharing | about 100 versus 100 requests per second | about 100 versus 100 requests per second |
| GPU usage, no sharing versus sharing | roughly 21% to 45% | roughly 20% to 34% |
The slide’s conclusions for time-slicing: improved GPU utilisation and no performance degradation. For GPU usage it notes that the optimal result would be a 2x increase and that more than 2x was observed. For MPS it lists improved utilisation, no performance degradation and low overhead, with caveats: limited fault isolation, slower startup (6 seconds for MPS against 1 second for time-slicing) and an additional MPS daemon.
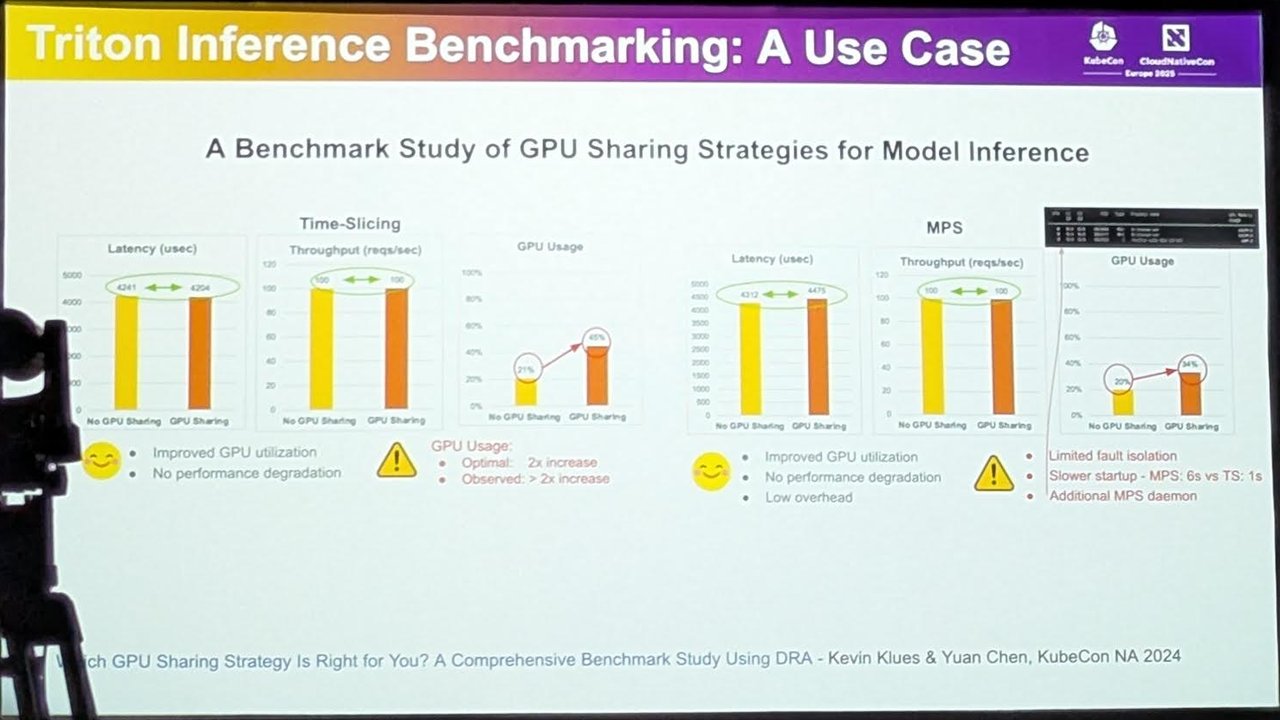
Time-slicing and MPS compared on latency, throughput and GPU usage.
The numbers come from the slide as photographed, so treat them as indicative; the chart digits are small. The shape of the result is what matters: for this workload, sharing roughly doubled GPU usage without hurting latency or throughput, and the strategies differ in isolation and startup time rather than in speed.
What this means for a platform team
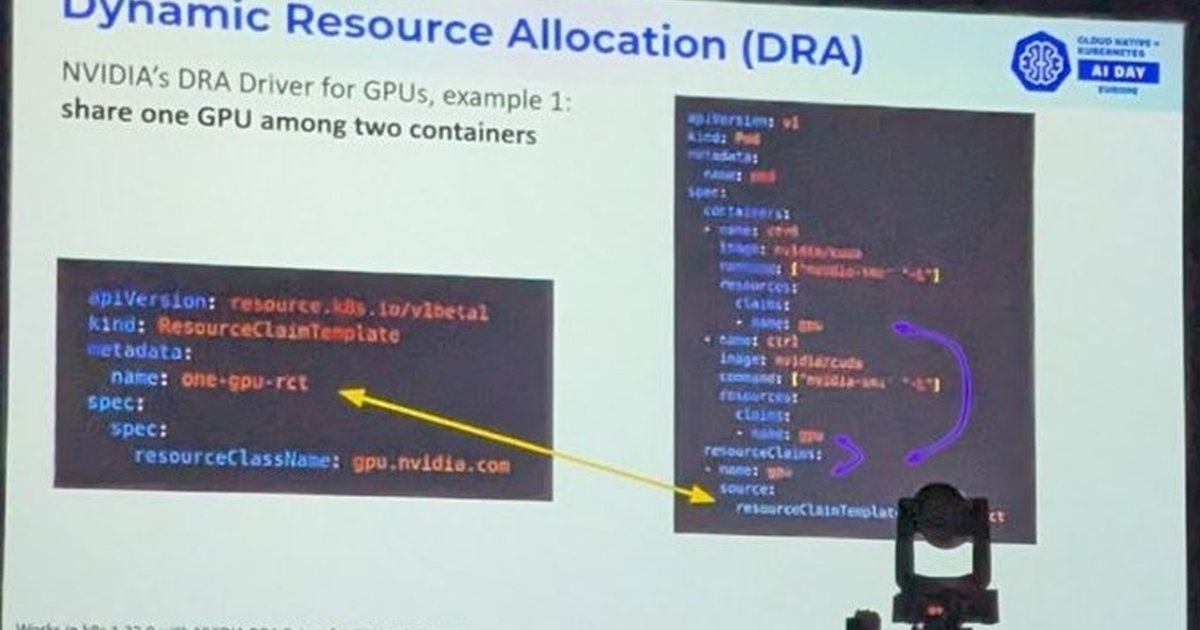
My take, not from the slides: two things carry over to real clusters. First, measure with a repeatable tool, not a one-off script, and track latency percentiles as well as throughput, because sharing mistakes show up in the tail. Second, choose the sharing mode by the isolation you need. MPS and time-slicing share a GPU cheaply but without hard memory isolation, while MIG partitions give isolation at the cost of fixed profiles. Two days earlier, a talk on Dynamic Resource Allocation showed how Kubernetes can express those choices as claims (that talk is here). For the configuration side, see my guide to GPU sharing with MIG, MPS and time-slicing and the NVIDIA AIPerf benchmarking guide.