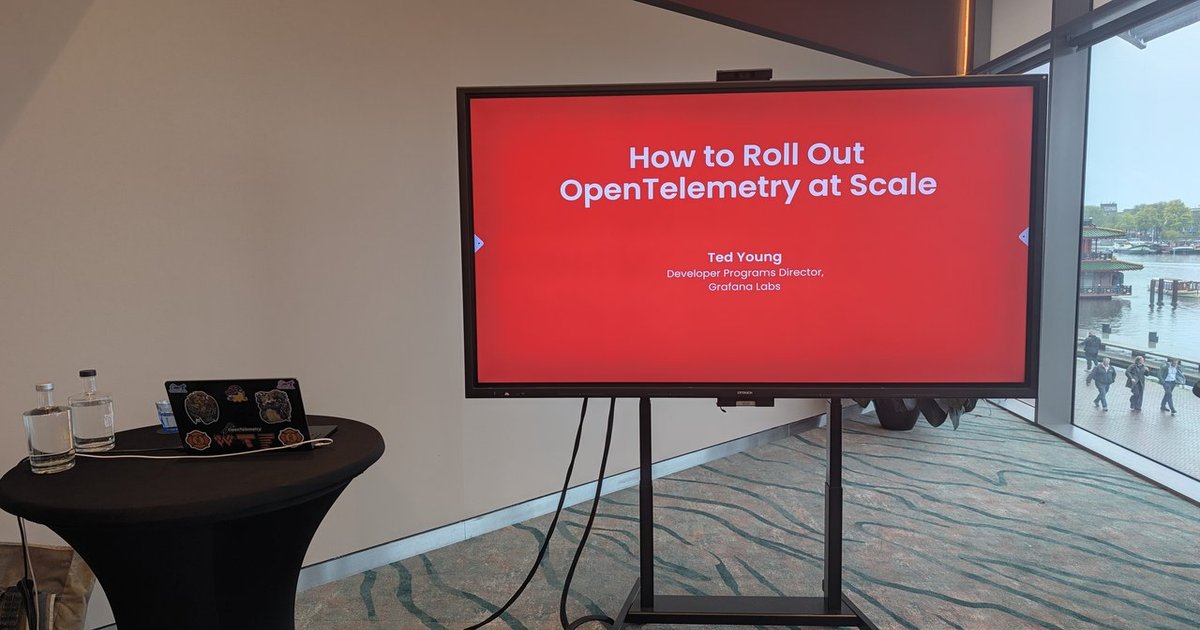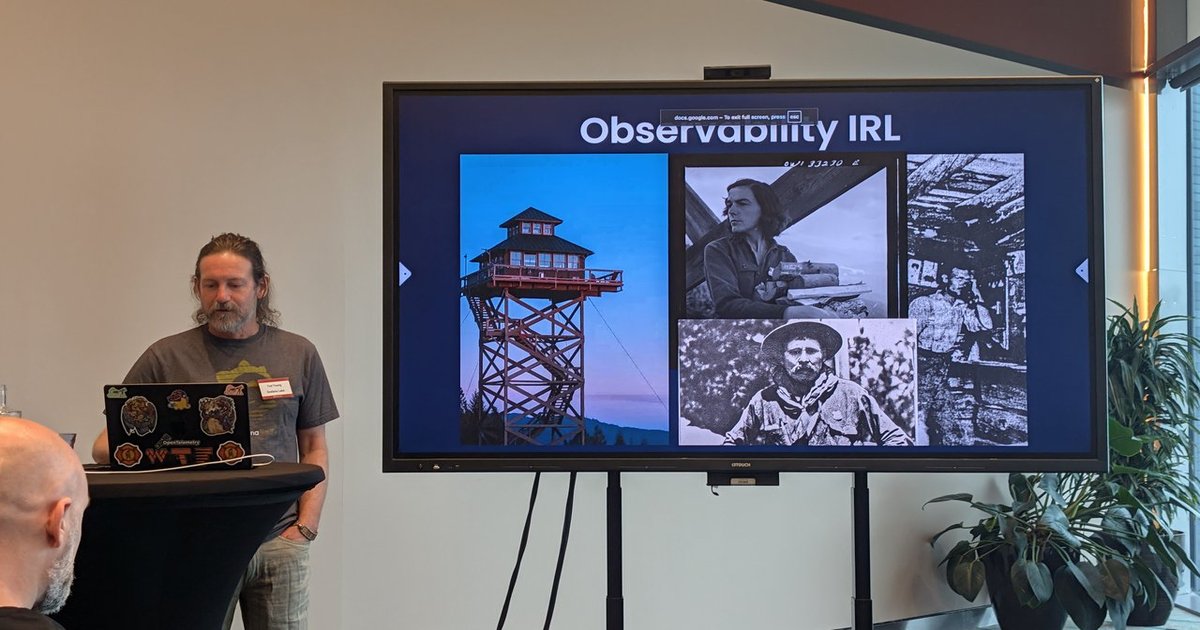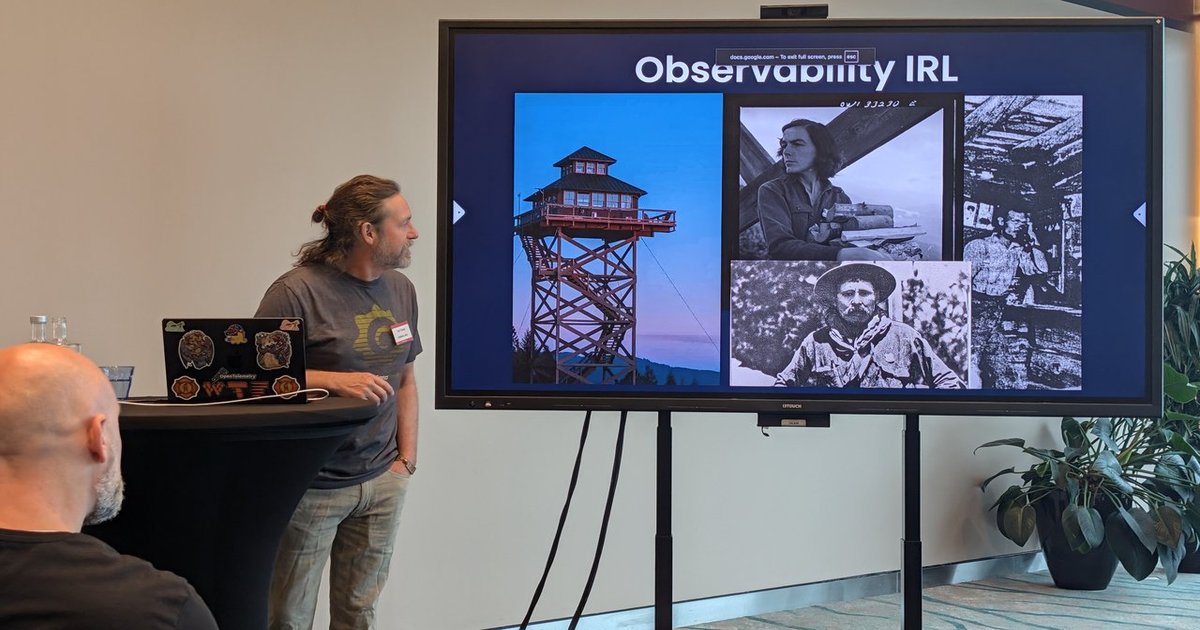
At the Grafana Labs OpenTelemetry event in Amsterdam on September 8th, one slide stopped the room. It wasn’t the most technical, and it didn’t contain a single line of code — but it might have been the most important.
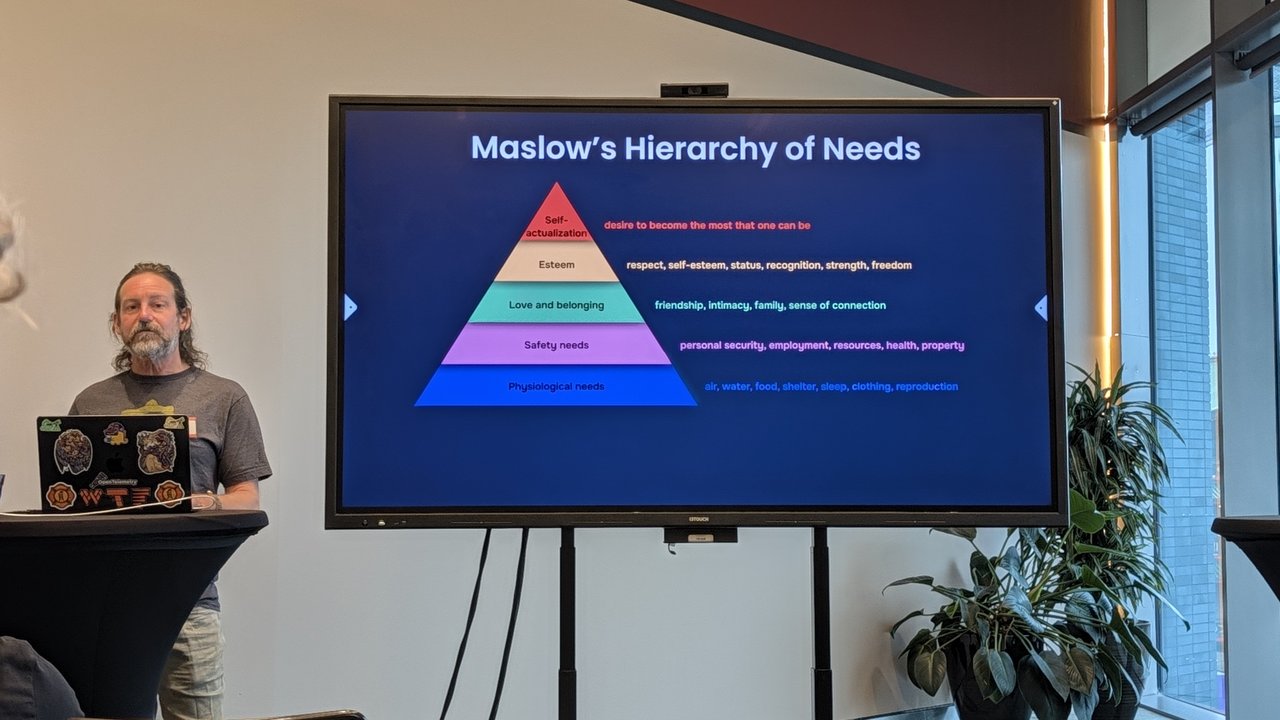
“Ted and Ed’s Hierarchy of Observability Needs” — a reimagining of Maslow’s psychological pyramid for software monitoring.
Why Maslow for Observability?
Abraham Maslow’s Hierarchy of Needs describes human motivation as a pyramid: you must satisfy basic physiological and safety needs before you can pursue higher-order goals like belonging, esteem, and self-actualization. The same logic applies to building observability in a modern software stack.
As Ted Young explained during the session, organizations that try to skip ahead to “custom observability logic” — instrumenting their unique business workflows and edge cases — before they have the fundamentals in place end up with systems that are expensive to maintain, fragile, and ultimately ineffective.
The Four Layers
The “Ted and Ed’s Hierarchy of Observability Needs” breaks down as follows:
Layer 1: Infrastructure Visibility (Base)
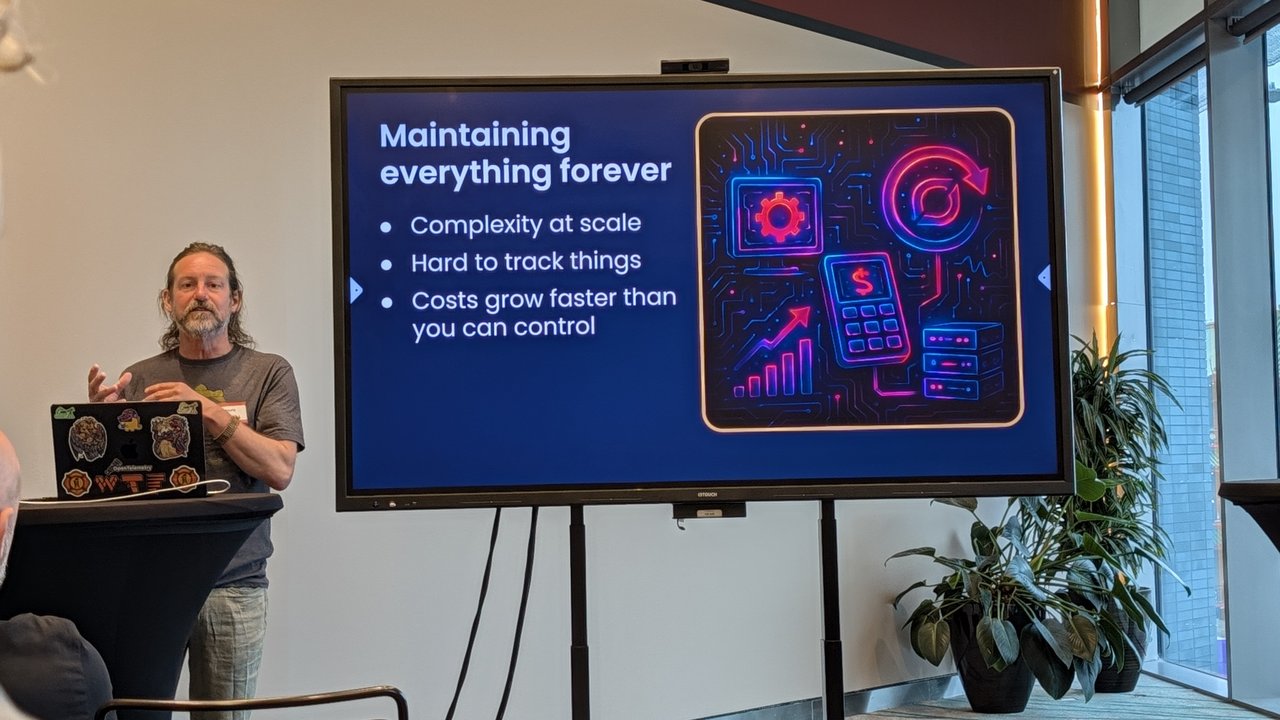
The foundation layer — what you need before anything else.
This is the broadest and most fundamental layer. You need visibility into:
- Hosts / Machines / Processes — the basic compute infrastructure
- Containers (Kubernetes, Cloud Foundry) — orchestration platforms
- Cloud Providers (AWS, Azure, Google) — managed services and serverless functions
The slide emphasized this with a simple label: “Fundamental!!”. Without infrastructure visibility, you’re flying blind. You can’t debug what you can’t see, and you can’t see anything if your agents aren’t collecting from the layers that actually run your code.
Layer 2: Baseline Service Visibility
Once every host, container, and cloud service is emitting telemetry, you build baseline dashboards and alerts at the service level. This is where you answer questions like:
- Is this service up or down?
- Is it responding within SLA?
- Are error rates spiking?
This layer provides the shared language between engineering and operations — the SLOs, SLIs, and dashboards that everyone agrees on.
Layer 3: Deep Transaction Insights
With baselines in place, you can trace individual requests as they flow through your distributed system. This is the domain of distributed tracing — following a single user request from the load balancer through the API gateway, through multiple microservices, into the database, and back.
This layer answers: why is something broken, not just that it’s broken.
Layer 4: Custom Logic (Peak)
At the top of the pyramid — and only accessible once all layers below are satisfied — lives custom observability logic. This is where you instrument your unique business workflows, domain-specific metrics, and edge cases that no generic tool can capture.
This layer answers: what does this mean for my business?
The Ordering Principle
The key insight from the framework is the ordering principle: the bottom layers must be satisfied before the higher ones provide value.
- Breadth first (the bottom): instrument everything broadly, across all infrastructure and services. You’re casting a wide net.
- Depth second (the top): once the net is in place, dive deep into specific traces, custom metrics, and business-logic instrumentation. You’re fishing with precision.
Organizations that reverse this order — deploying custom instrumentation before they have infrastructure visibility — end up with observability gaps that no amount of custom code can fill. You can have the most sophisticated observability logic in the world, but if your Kubernetes pods aren’t emitting metrics, you have nothing to work with.
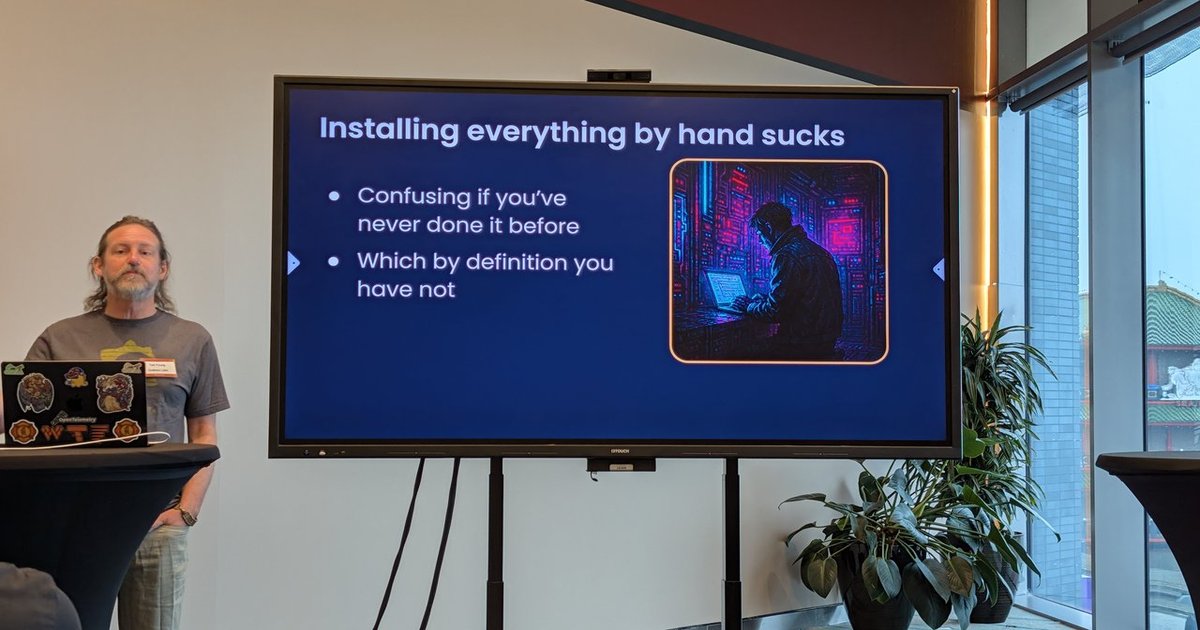
Installing Everything by Hand Sucks
One of the most relatable slides in the talk addressed the elephant in the room: manual setup.
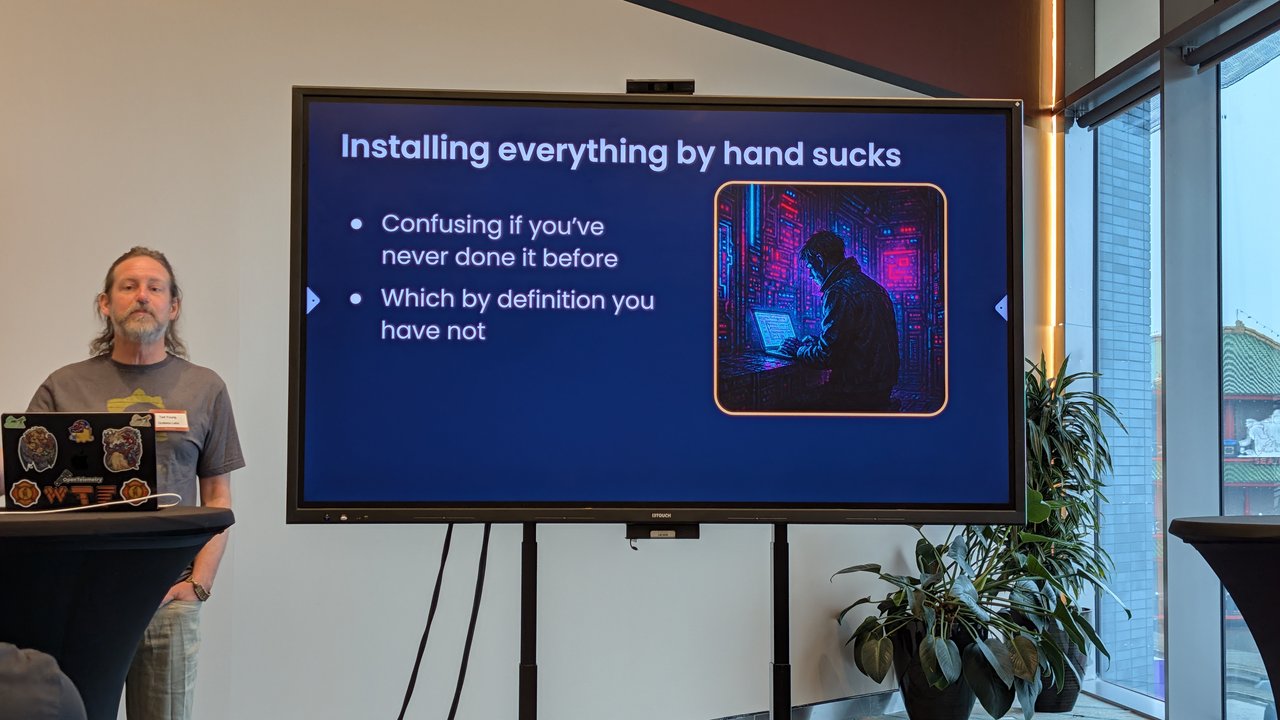
“Installing everything by hand sucks.”
Ted’s practical advice for climbing the hierarchy:
- Stop installing everything by hand. Use package managers, Helm charts, and automated deployment pipelines. The slide humorously acknowledged: “Confusing if you’ve never done it before — which by definition you have not.”
- Standardize the base layer first. Get every host, container, and cloud service emitting the same standard telemetry before you customize.
- Layer custom logic on top. Once the foundation is solid, you can build domain-specific instrumentation without worrying about gaps.
Too Many Pieces
The “too many pieces” problem is what makes the hierarchy so crucial. Without a structured approach, organizations accumulate a patchwork of tools: one for metrics, another for logs, a third for traces, a fourth for profiling.
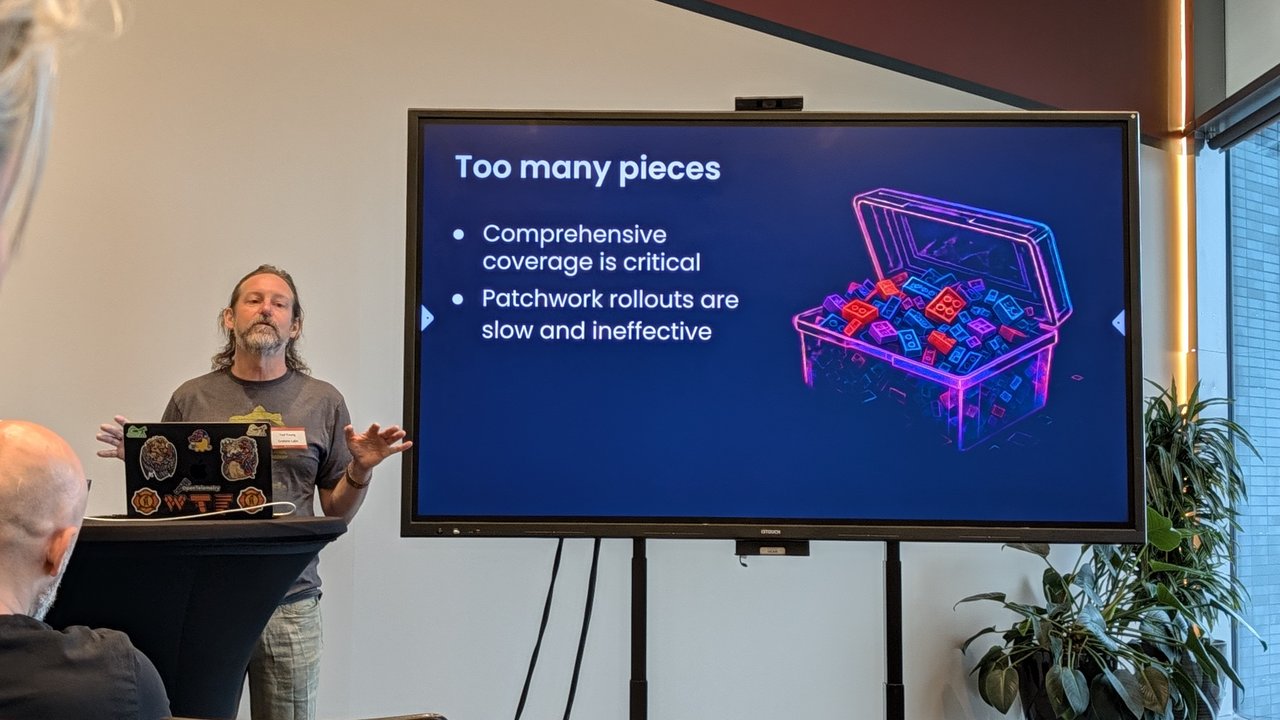
The “too many pieces” problem — a treasure chest of fragmented tools.
The slide’s message was clear:
- Comprehensive coverage is critical
- Patchwork rollouts are slow and ineffective
The solution isn’t to buy more tools — it’s to consolidate onto a platform that covers the full hierarchy, from infrastructure visibility up to custom logic.
Applying the Framework in Practice
To assess where your organization sits in the Hierarchy of Observability Needs:
- Audit the base layer. Can you see every host, container, and cloud service? If not, everything above is compromised.
- Check baseline coverage. Are your critical services emitting consistent, queryable telemetry with defined SLOs?
- Evaluate trace depth. Can you trace a request end-to-end through every service boundary?
- Assess custom instrumentation. Only once the above three are green should you invest in business-specific observability.
Related Reading
- How to Roll Out OpenTelemetry at Scale: Grafana Labs Amsterdam Recap
- Observability IRL: Fire Lookout Towers and Software Monitoring
- Cloud Security Posture Management (CSPM) for the Enterprise
About the Author
I am Luca Berton, AI and Cloud Advisor. I work at the intersection of cloud security, platform engineering, and enterprise AI deployments. Book a consultation.