If you want to benchmark vLLM with GuideLLM, the question you are really asking is not “how fast is my server?” but “how much traffic can it take before users notice?”. GuideLLM answers the second question directly. You give it latency objectives, such as a p95 time to first token, and it tells you what share of requests met them and at what load they stop meeting them. This post walks through the whole loop: install, point it at a vLLM endpoint, choose a load profile, read the numbers and run the same benchmark as a Kubernetes Job.
At OpenShift Commons Gathering Amsterdam 2026, one of my break photos showed the GuideLLM README on a phone screen, at v0.5.4. That got me to sit down with the current release and work out how I’d use it for SLO sign-off on a real vLLM deployment. The tutorial below stands on its own.

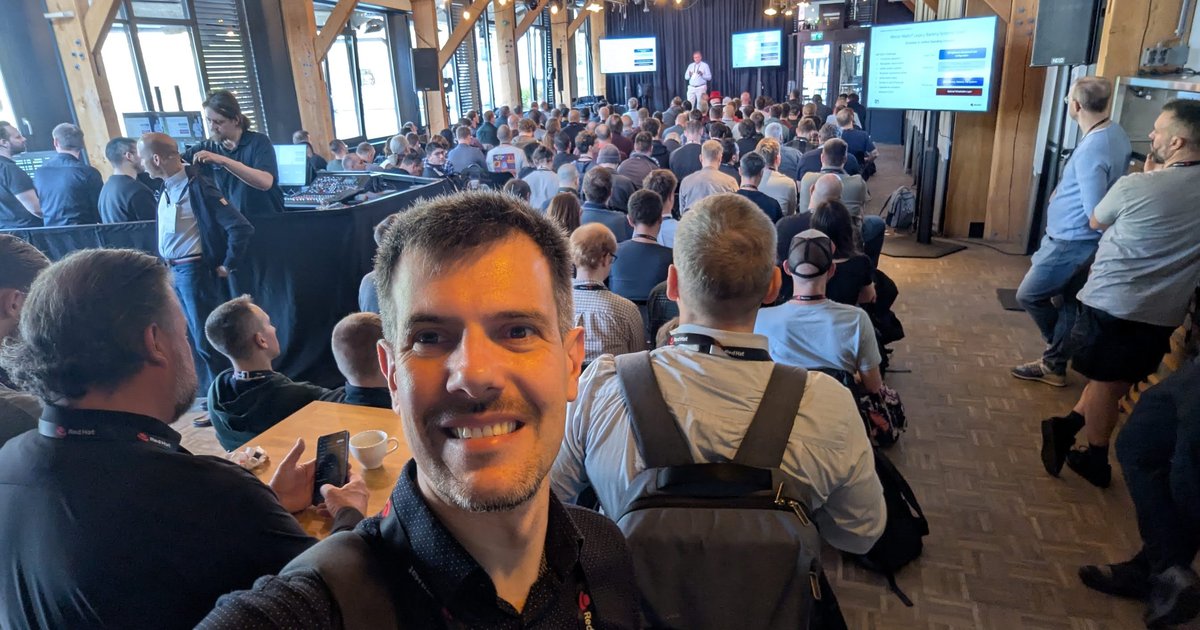
The main hall at OpenShift Commons Gathering Amsterdam 2026: a full room, a speaker on stage and slides repeated on screens down the side.
What GuideLLM is
GuideLLM is a vLLM project, licensed under Apache-2.0. Its README calls it an “SLO-aware Benchmarking and Evaluation Platform for Optimizing Real-World LLM Inference”. It drives an OpenAI-compatible server (vLLM, or anything that speaks the same API) with synthetic or real prompts, records per-request timings, and writes JSON, CSV, HTML, YAML or plot reports.
Version note. Everything below was checked against GuideLLM v0.8.0: its README, the docs in the repository, the guidellm run --help output and a run against the bundled mock server. The CLI changed a lot between versions. Up to v0.6 you ran guidellm benchmark --target ... --profile sweep --max-seconds 30. From v0.7 the command is guidellm run, and every option takes a kind=... spec. If you copy commands from an older blog post, they will fail. The repository has a v0.6.0 to v0.7.2 migration guide that maps every old flag.
Install GuideLLM
GuideLLM needs Linux or macOS and Python 3.10 to 3.13. Pin the version so your results stay comparable across runs:
python3 -m venv .venv && source .venv/bin/activate
pip install "guidellm[recommended]==0.8.0"
guidellm --version
There is also a multi-arch container image at ghcr.io/vllm-project/guidellm. Use the v0.8.0 tag, not latest, which can include pre-releases.
Point GuideLLM at a vLLM endpoint
Start vLLM as usual. It serves the OpenAI-compatible API on port 8000:
vllm serve Qwen/Qwen3-0.6B
curl -s http://localhost:8000/v1/models
The backend spec tells GuideLLM where to send requests:
--backend kind=openai_http,target=http://localhost:8000Things to know about openai_http in v0.8.0:
targetis the base URL. If you leave outmodel, GuideLLM uses the first model the server lists.request_formatdefaults to/v1/chat/completions. Setrequest_format=/v1/completionsto skip the chat template.streamdefaults totrue. You need streaming for TTFT and inter-token latency.api_key=...sets anAuthorization: Bearerheader, andverify(TLS verification) defaults tofalse.- For a fixed output length, GuideLLM sends
ignore_eos: true. For models that must stop on their own end-of-turn token (the docs call out Harmony / gpt-oss), addextras.body.ignore_eos=false.
How to benchmark vLLM with GuideLLM: profiles
The --profile option sets the traffic shape. In v0.8.0, guidellm run --help lists these kinds:
| Profile | What it does | Main setting |
|---|---|---|
synchronous | One request at a time. This is your best-case latency baseline. | none |
concurrent | A fixed number of parallel streams | streams= |
throughput | Sends as fast as possible to find the ceiling | max_concurrency= |
constant (alias async) | Fixed requests per second | rate= |
poisson | Random arrivals with an average requests per second | rate= |
sweep | Runs synchronous and throughput first, then rates in between | sweep_size= (default 10) |
goodput | Searches for the highest concurrency that still meets your SLOs | target_attainment= |
replay | Replays a trace file with its original timing | trace --data |
--constraint sets when each benchmark stops. You can repeat it: max_duration, max_requests, max_errors, max_error_rate, over_saturation and others.
A first sweep, as shown in the README:
guidellm run \
  --backend kind=openai_http,target=http://localhost:8000 \
  --profile kind=sweep \
  --constraint kind=max_duration,seconds=30 \
  --data kind=synthetic_text,prompt_tokens=256,output_tokens=128
To step through concurrency levels in one run, use --override:
guidellm run \
  --backend kind=openai_http,target=http://localhost:8000 \
  --profile kind=concurrent,streams=1 \
  --override profile.streams 1,2,4,8,16,32 \
  --constraint kind=max_duration,seconds=120 \
  --data kind=synthetic_text,prompt_tokens=512,output_tokens=256
My take: concurrency is a better first question than request rate. If you set a rate above what the server can sustain, the queue grows without limit, and you end up measuring the backlog rather than the server. The SLO guide makes the same point.
Synthetic vs real datasets
Synthetic data gives you controlled, repeatable shapes. You set the length of each request in tokens:
--data kind=synthetic_text,prompt_tokens=1024,prompt_tokens_stdev=256,prompt_tokens_min=128,prompt_tokens_max=2048,output_tokens=256,output_tokens_stdev=64prompt_tokens and output_tokens are means. Without _stdev, _min or _max, every request gets exactly that length. GuideLLM needs a tokenizer to build prompts. It uses the backend’s model by default. If you serve the model under an alias (vLLM’s --served-model-name), pass the tokenizer yourself:
--tokenizer kind=huggingface_auto,model=Qwen/Qwen3-0.6BReal data shows how your prompts actually behave. A dataset from Hugging Face:
--data kind=huggingface,source=abisee/cnn_dailymail,load_kwargs.name=3.0.0 \
--data-column-mapper kind=generative_column_mapper,column_mappings.text_column=article
Or a local JSONL file with a prompt field, plus an optional output_tokens_count field per row:
--data kind=json_file,path=prompts.jsonlTo clip a large dataset, add --data-loader kind=pytorch,samples=500. Keep samples at or below the number of rows you actually have: in my test, asking for 500 samples from a two-row file stopped the run with “Requested 500 samples, but only 2 available”.
I start with synthetic shapes that match the p50 and p95 of production prompt lengths. Once the shape is right, I confirm with a sample of real (scrubbed) prompts. If you have a trace with timestamps, the replay profile with kind=trace_synthetic data replays its arrival pattern.

A slide from OpenShift Commons Gathering Amsterdam 2026: “Applying Large Language Models (LLM) in Public Health”, with a classification task (raw text into a fine-tuned model, yes or no out) next to an extraction task (a question plus raw text into an LLM, text out). Two workloads with very different prompt and output lengths.
Reading the results
By default GuideLLM prints tables to the console and writes benchmarks.json and benchmarks.csv. Any --output you pass replaces those defaults, so repeat it for each format you want (kind=json, kind=csv, kind=html).
Two console tables matter most. Here is their layout, with placeholders where the numbers go:
ℹ Request Latency Statistics (Completed Requests)
| Benchmark  | Request Latency  ||| TTFT            ||| ITL         ||| TPOT        |||
| Strategy   | Sec              ||| ms              ||| ms          ||| ms          |||
|            | Mean     | Mdn | p95 | Mean   | Mdn | p95 | Mean | Mdn | p95 | Mean | Mdn | p95 |
| concurrent | <m> ± <ci> | <x> | <x> | <m> ± <ci> | <x> | <x> | <x> | <x> | <x> | <x> | <x> | <x> |

ℹ Server Throughput Statistics (All Requests)
| Benchmark  | Requests          ||| Input Tokens | Output Tokens | Total Tokens | Goodput          ||
| Strategy   | Concurrency || Per Sec | Per Sec   | Per Sec       | Per Sec      | Attainment | Per Sec |
| concurrent | <x> | <x>  | <x>     | <x>          | <x>           | <x>          | <x> %      | <x>     |
What the columns mean, according to the metrics guide:
- TTFT (time to first token): how long until the first token arrives. This is what a chat user feels.
- ITL (inter-token latency): the average gap between tokens, excluding the first token.
- TPOT (time per output token): the same idea, but including the first token. Don’t mix the two up when you compare against vLLM’s own
tpot. - Request Latency: end-to-end time per request, in seconds.
- Output Tokens Per Sec / Total Tokens Per Sec: throughput for the whole server.
- Goodput: only shown when you set objectives. It covers requests that met every objective. Attainment is a percentage, and Per Sec is a rate.
The JSON report has every percentile from p001 to p999 for each metric, split by successful, incomplete, errored and total requests. This jq command pulls out one row per benchmark:
jq -r '.benchmarks[] | [
  .config.strategy.type_,
  (.config.strategy.streams // .config.strategy.rate // "-"),
  .metrics.time_to_first_token_ms.successful.percentiles.p95,
  .metrics.inter_token_latency_ms.successful.percentiles.p95,
  .metrics.request_latency.successful.percentiles.p95,
  .metrics.output_tokens_per_second.total.mean,
  .metrics.slo_attainment
] | @tsv' benchmarks.json
Check two things before you trust a p95 or a p99:
- Sample size. The console marks a percentile with
*when the run is too short to put a confidence interval on it. At the default 0.95 confidence, the docs say you need at least 72 requests for p95 and 368 for p99. With fewer than 100 successful requests, the “p99” is simply your slowest request. - Input tokens. Check that the Input Tok column matches the shape you asked for. A mismatched tokenizer or a chat template changes the real prompt length.
Turn results into SLO decisions
This is where GuideLLM stands out. You declare objectives on --metrics, in milliseconds per request: ttft_ms, tpot_ms (which is compared against ITL, not GuideLLM’s TPOT column) and e2el_ms. A request counts as conforming only if it meets all of them.
Interactive chat. The guide’s example chat target is TTFT ≤ 200 ms and ITL ≤ 50 ms. Treat these as starting values to adjust, not as recommendations. The goodput profile then searches for the highest concurrency that still meets the target:
guidellm run \
  --backend kind=openai_http,target=http://localhost:8000 \
  --profile kind=goodput,target_attainment=0.95 \
  --data kind=synthetic_text,prompt_tokens=512,output_tokens=256 \
  --metrics '{"kind":"generative","slo":{"ttft_ms":200,"tpot_ms":50}}' \
  --constraint kind=max_duration,seconds=120 \
  --output kind=json,path=chat-goodput.json --output kind=html,path=chat-goodput.html
target_attainment=0.95 means “95% of requests must meet every objective”, which is the same as saying the p95 of each metric must be under its threshold. Use 0.99 for a p99 target. The search doubles concurrency from initial_streams (default 4) until a level fails, then narrows the gap to within tolerance (default 10%). It writes the result to conclusions in the JSON:
jq '.conclusions[] | {best_passing_streams, lowest_failing_streams, stop_reason}' chat-goodput.jsonIf GuideLLM warns that a probe is “unresolved”, the confidence interval for that probe straddles your target. Raise max_duration and run it again. Also check stop_reason: max_streams_reached means the number you got is a lower bound, not the real maximum.
Batch and offline jobs. Nobody watches the first token arrive, so TTFT objectives don’t help much here. Use sweep or throughput, read Output Tokens Per Sec, and set an e2el_ms objective only if a downstream deadline needs one.
My take: write the decision down as one line per workload, in the form “chat: p95 TTFT ≤ X ms and p95 ITL ≤ Y ms at N concurrent streams per replica, on this model, GPU and vLLM version”. That one line becomes the input to your autoscaling threshold and your replica count.
Run GuideLLM as a Kubernetes Job
A benchmark runs once and finishes, so use a Job, not a Deployment. The repository ships a full Kubernetes/OpenShift example. This is a trimmed version of it, adapted for the goodput run:
apiVersion: batch/v1
kind: Job
metadata:
  name: guidellm-chat-slo
spec:
  backoffLimit: 0                 # a retried benchmark gives misleading numbers
  activeDeadlineSeconds: 7200     # kill switch for a hung run
  ttlSecondsAfterFinished: 86400
  template:
    metadata:
      annotations:
        sidecar.istio.io/inject: "false"   # a mesh sidecar adds latency to the measurement
    spec:
      restartPolicy: Never
      automountServiceAccountToken: false
      securityContext:
        runAsNonRoot: true
        seccompProfile:
          type: RuntimeDefault
      containers:
        - name: guidellm
          image: ghcr.io/vllm-project/guidellm:v0.8.0
          args:
            - run
            - --backend
            - kind=openai_http
            - --profile
            - kind=goodput,target_attainment=0.95
            - --data
            - kind=synthetic_text,prompt_tokens=512,output_tokens=256
            - --metrics
            - '{"kind":"generative","slo":{"ttft_ms":200,"tpot_ms":50}}'
            - --constraint
            - kind=max_duration,seconds=120
            - --output
            - kind=json,path=/results/benchmarks.json
            - --output
            - kind=html,path=/results/benchmarks.html
          env:
            - name: GUIDELLM__SPEC__BACKEND__TARGET
              value: http://vllm.inference.svc.cluster.local:8000
          resources:
            requests: { cpu: "2", memory: 4Gi }
            limits: { cpu: "2", memory: 4Gi }
          securityContext:
            allowPrivilegeEscalation: false
            readOnlyRootFilesystem: true
            capabilities:
              drop: ["ALL"]
          volumeMounts:
            - { name: results, mountPath: /results }
            - { name: home, mountPath: /home/guidellm }
            - { name: tmp, mountPath: /tmp }
      volumes:
        - name: results
          persistentVolumeClaim:
            claimName: guidellm-results
        - name: home
          emptyDir: {}
        - name: tmp
          emptyDir: {}
Create a guidellm-results PersistentVolumeClaim first (the upstream example uses 5Gi, ReadWriteOnce). Then:
kubectl apply -f guidellm-job.yaml
kubectl logs -f job/guidellm-chat-slo
kubectl wait --for=condition=complete job/guidellm-chat-slo --timeout=2h
Notes from the upstream example that are worth keeping:
GUIDELLM__SPEC__BACKEND__TARGETsets only thetargetfield and leaves the rest of the--backendspec alone. Put an API key in a Secret and pass it asGUIDELLM__SPEC__BACKEND__API_KEY.- The client does not need a GPU. Give it Guaranteed QoS (requests equal to limits) so a noisy neighbour doesn’t show up as client latency.
- On OpenShift, leave
runAsUserandfsGroupunset so therestricted-v2SCC can assign them. On vanilla Kubernetes, set both to1001so the PVC is writable. - For fixed
concurrentruns, keepstreamsat or below vLLM’s--max-num-seqs. Otherwise you measure queueing, not decode.
Common pitfalls
- Old syntax.
--target,--rate-typeand--max-secondsdon’t exist inguidellm run. Translate them to--backend,--profileand--constraint. --config chat. The README still uses it as an example, but the v0.8.0 CLI only lists therhaiis/...built-in scenarios. Checkguidellm run --helpbefore you rely on a scenario name.- TTFT objectives with
stream=false. No request can be judged, so attainment shows as unset instead of zero. - Rate benchmarks past saturation. Look at the dispatch delay in the JSON. If it is large, the load generator fell behind and the server saw less traffic than you asked for.
- Comparing across versions. When you upgrade GuideLLM, re-run one known workload and compare before you trust the new numbers.
If you are also comparing tools, I covered NVIDIA’s take on the same metrics in the AIPerf guide.

A slide on the screens at OpenShift Commons Gathering Amsterdam 2026: a house of cards built from open source project logos.