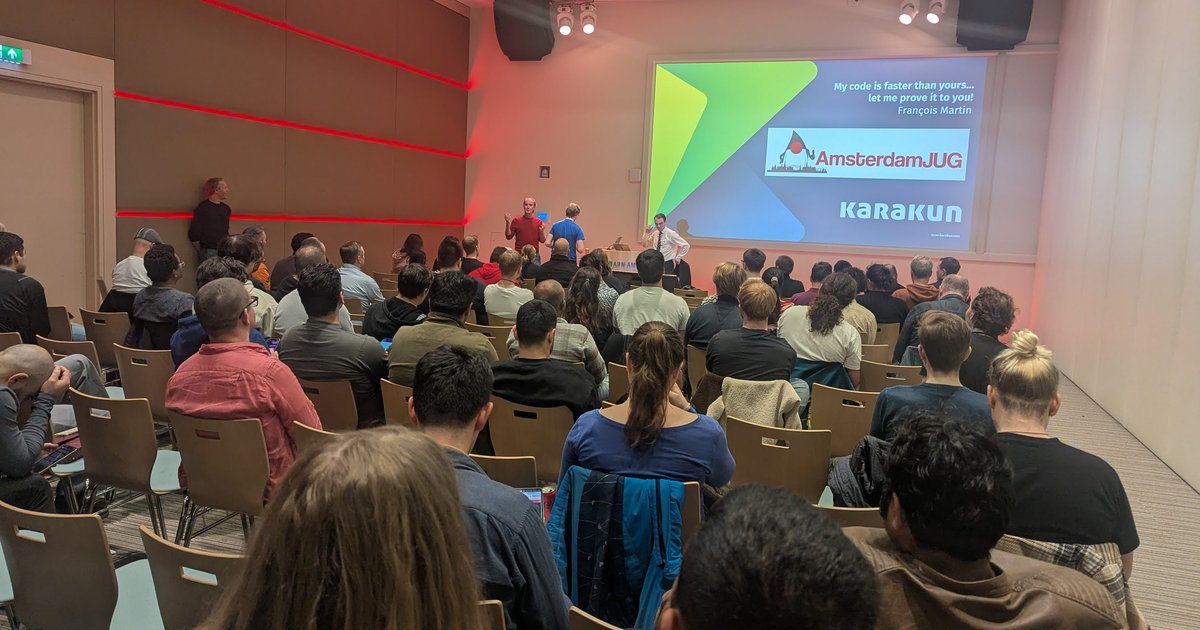
On 3 July 2024 I went to an observability evening in Amsterdam. The closing slides of the second talk read “Grafana & Friends Amsterdam Summer Meetup, July 3rd, 2024”, and the room was a bright open space with a wooden stage. Two talks are in my photos: a migration of a tracing stack to Grafana Tempo and OpenTelemetry, and a Grafana Labs talk on moving Grafana’s dashboards to the Scenes library.
This is a throwback built from the slides I photographed. The speakers’ names were not on the slides I captured, so I don’t name them. I left out one photo of a Grafana admin screen.
Why tracing was the missing piece
The first talk opened with a slide called “OK, so what can we do?” with a short checklist: metrics and dashboards, centralised logging and error tracking were ticked. Distributed tracing carried a warning mark. That was the gap the migration filled. A slide showing the product of Bynder set the scene before the technical part.
Grafana Tempo as the tracing backend
The Tempo slide described it as a distributed tracing backend that is open source, object-storage based and “built to sample 100% of requests”. Official docs: Grafana Tempo.
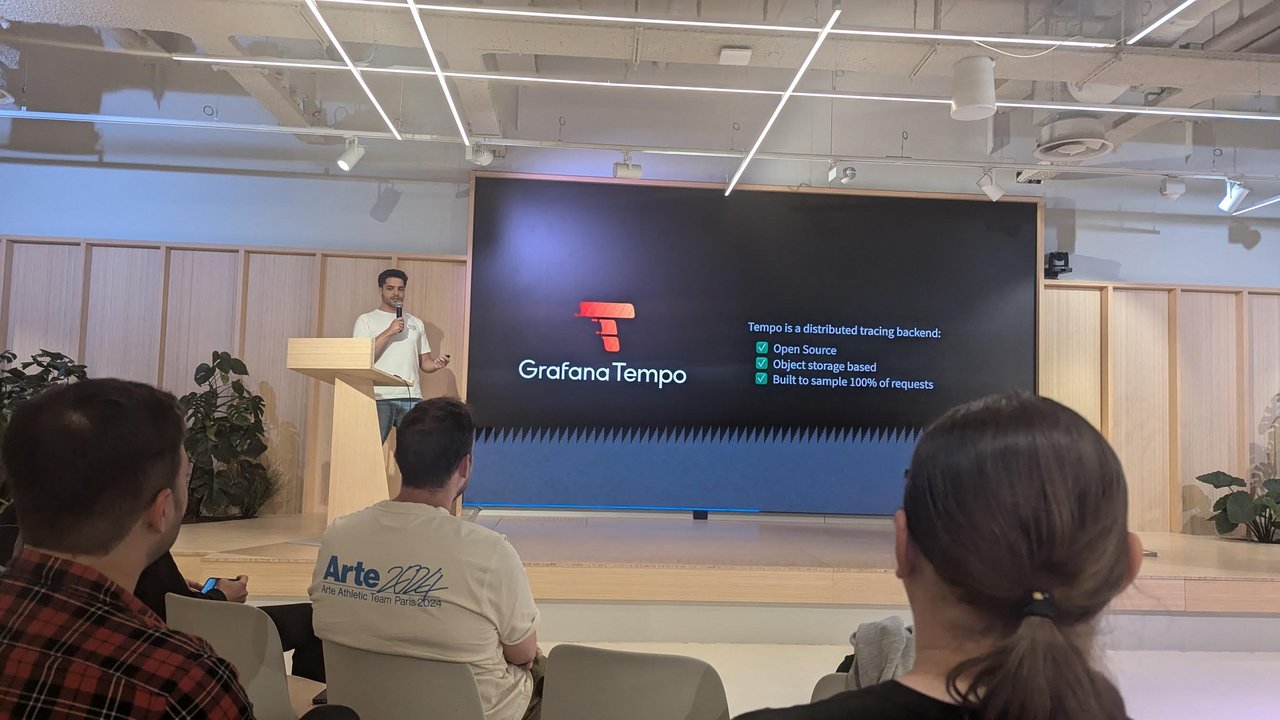
The Tempo slide: open source, object storage based, built to sample 100% of requests.
The next slides walked through the pipeline:
- Ingesting the data: traces come off a Kafka (MSK) topic into a distributor, then an ingester. A compactor deletes old data from the object store.
- Generating useful metrics: the distributor also feeds a metrics generator. It computes span metrics (RED metrics) and a service graph of service relationships, and ships them to the team’s Thanos metrics system with exemplars.
- Accessing the data: Grafana queries the Tempo query frontend. It shards queries between queriers, which look a trace up by ID in the bucket or push a search out to Lambda.
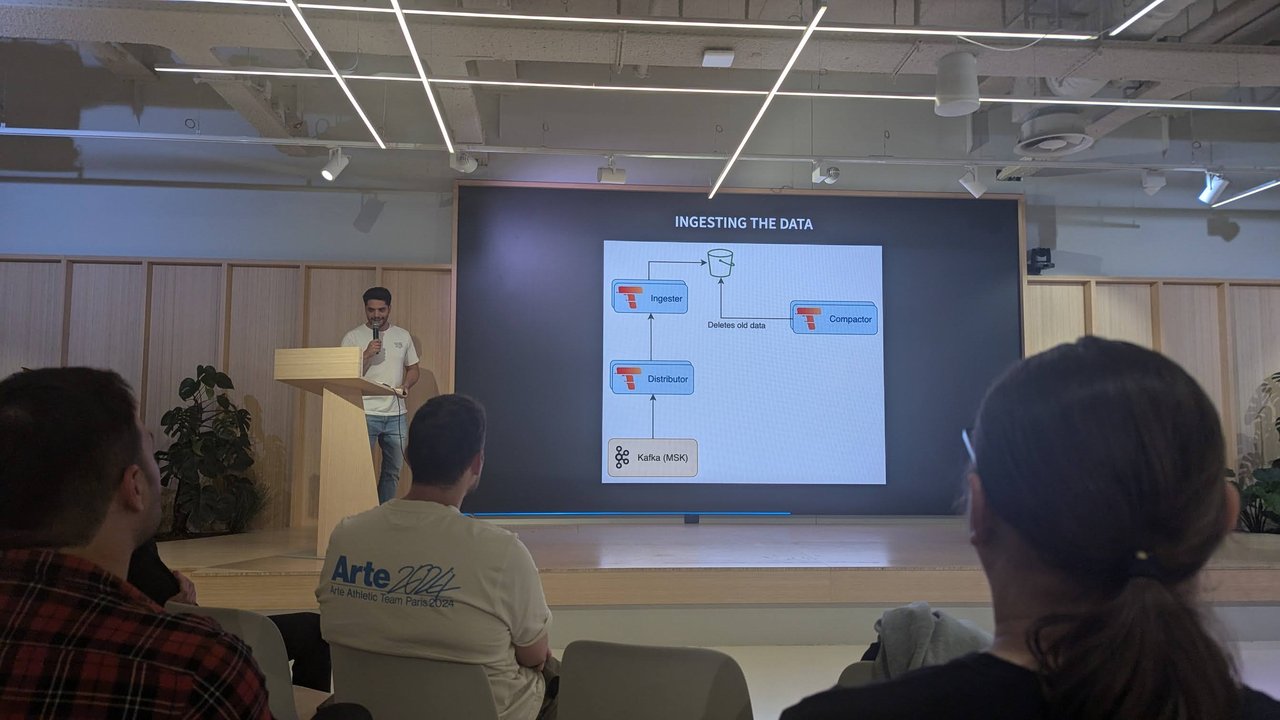
Ingesting the data: Kafka (MSK), distributor, ingester and a compactor that deletes old data.
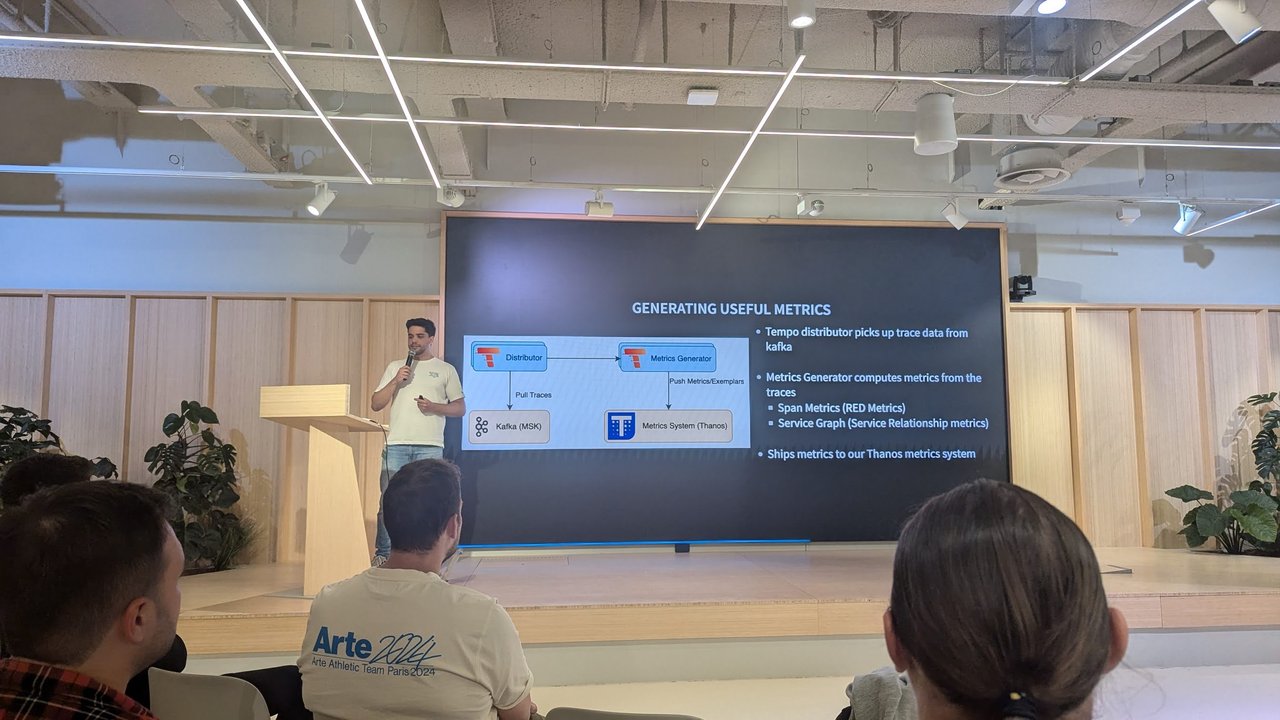
Generating useful metrics: span metrics and the service graph, shipped to Thanos.
OpenTelemetry and tracking adoption in Backstage
The talk then covered OpenTelemetry: a vendor-agnostic, open-source framework that exports logs, traces and metrics. A slide defined automatic instrumentation as injecting code into an application to track which calls it makes, and the “all a developer has to do” slide showed four commands: install opentelemetry-distro[otlp], run opentelemetry-bootstrap, install what it detects, and start the app with opentelemetry-instrument. The OpenTelemetry Collector slide described a gateway that receives signals, processes them (adding or redacting attributes) and exports them to backends. See opentelemetry.io.
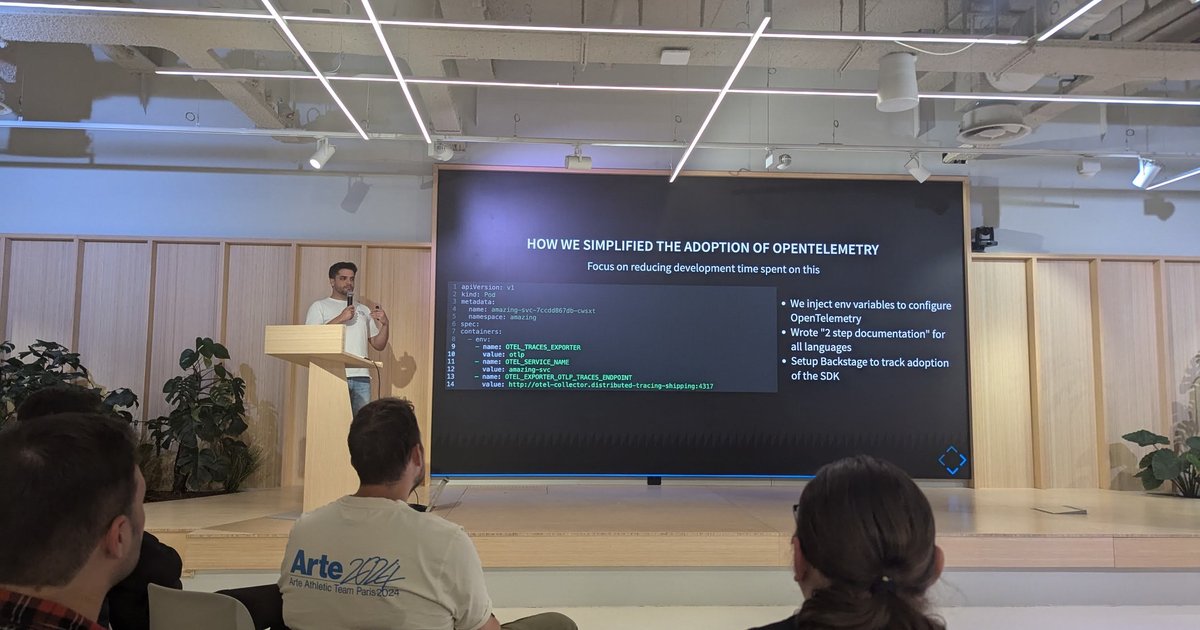
The part I found most useful was how they reduced developer effort. Per the slide, they:
- inject environment variables to configure OpenTelemetry,
- wrote “2 step documentation” for all languages,
- set up Backstage to track adoption of the SDK.
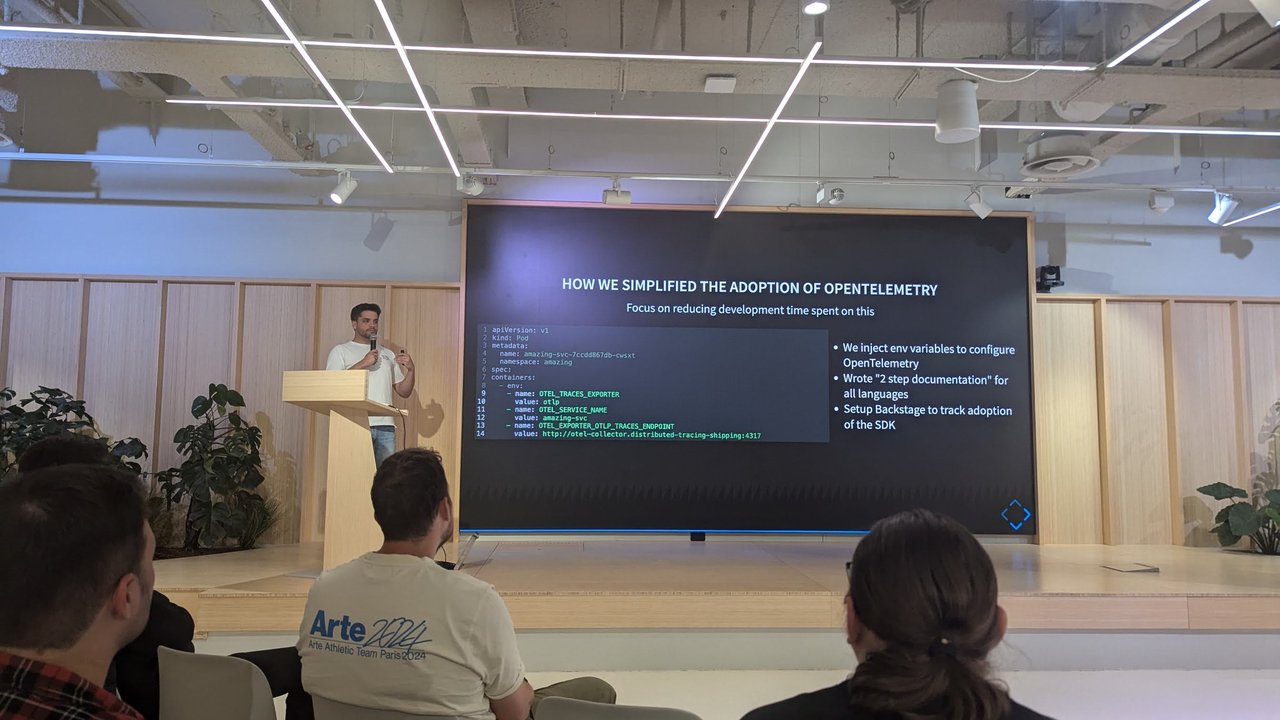
How they simplified OpenTelemetry adoption: injected env variables, short docs and Backstage to track SDK adoption.
My take: using the developer portal as an adoption dashboard is a good idea. A catalogue already knows every service, so “which services still lack instrumentation” becomes a query instead of a survey. I cover the portal side in Backstage internal developer portal setup.
Other slides covered correlation IDs (every request gets one, and a “Logs Finder” tool looks the IDs up in Tempo), standard APM dashboards and exemplars that let you jump from a metric to a trace.
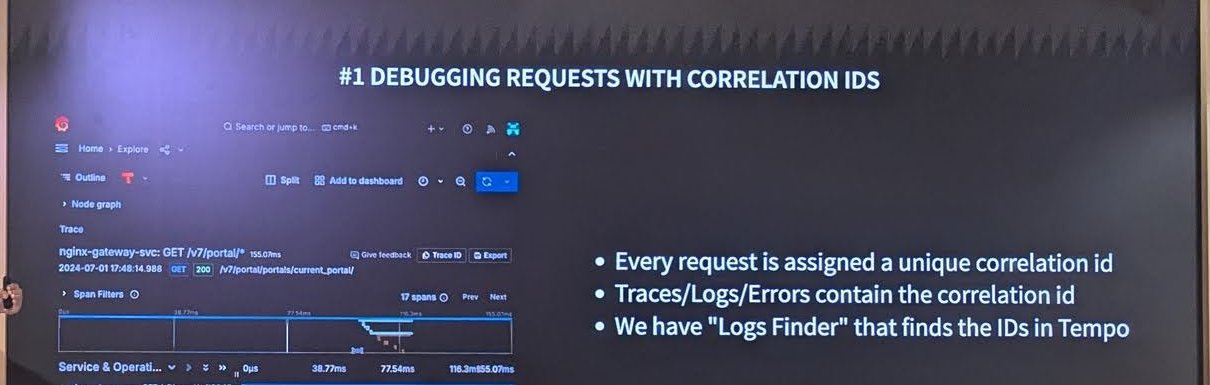
The first debugging use case: correlation IDs, shown with a trace in Grafana’s Explore view.
The slide, titled “#1 Debugging requests with correlation IDs”, paired the three bullets with a Tempo trace of a request through an nginx gateway service and a Kong gateway, where one of the listed spans was a Kong correlation-id plugin. The trace was 17 spans, with the whole request taking about 155 ms. It makes the point well: the ID is added at the edge, so every later log line and trace can be found from it.
The numbers
The wrap-up slide showed the whole architecture, from node-level OpenTelemetry collectors and cluster collectors in the application clusters to Tempo in a separate observability cluster. The figures on it: about 6 TB of raw data per day, 7,000+ traces and 50,000+ spans per second, from 14 clusters and 400+ nodes, at one fifth of the cost of the previous provider.
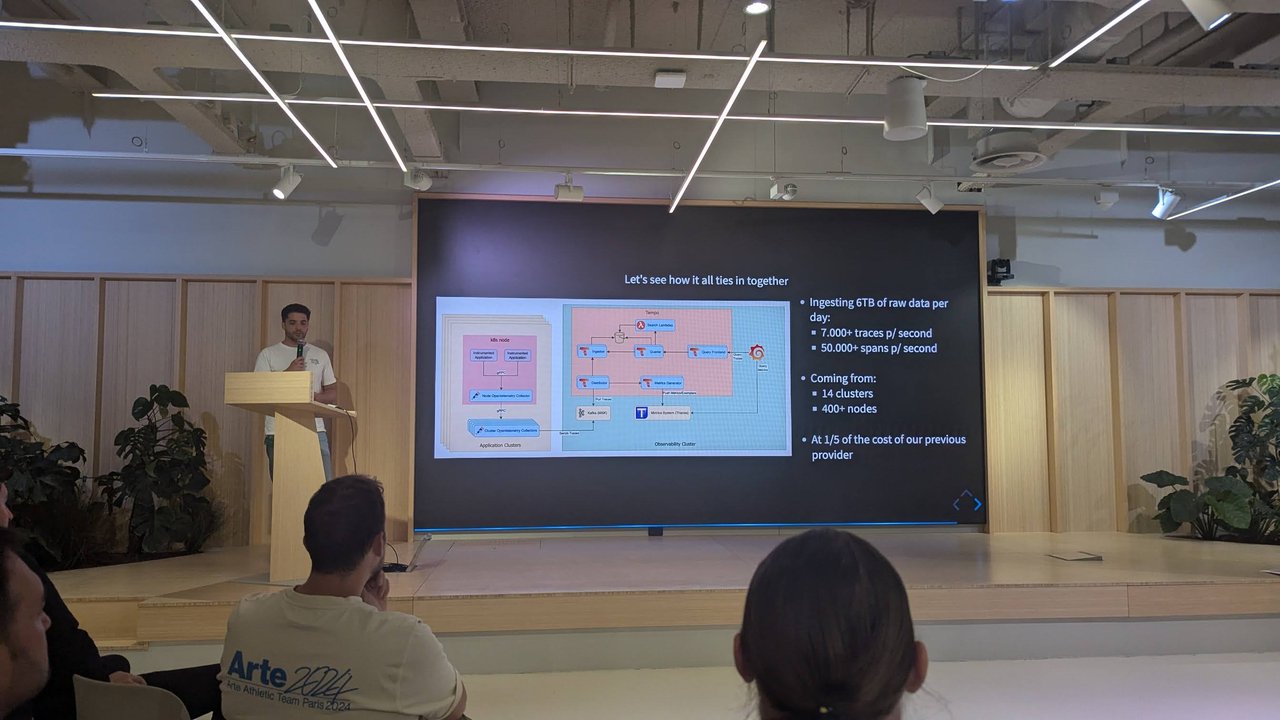
The end-to-end picture, with the volume and cost figures on the right.
Grafana Labs: migration to Scenes
The second talk was from Grafana Labs: “Unlocking New Features with Grafana’s Latest Migration to Scenes”.
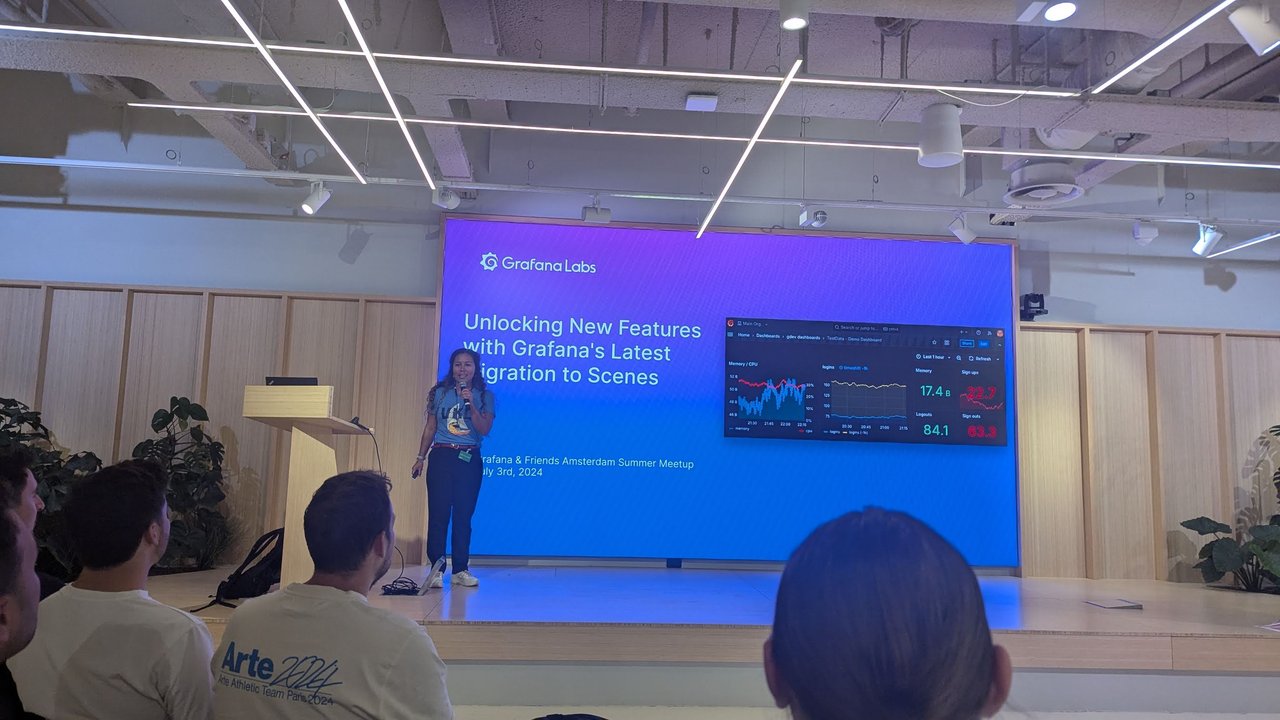
The Grafana Labs title slide for the Scenes talk.
The story on the slides: Grafana was born in 2010, and ten years later users asked for nested layout systems. Hacking that in would have hurt stability, so after proofs of concept Grafana Scenes appeared at the end of 2022 as a frontend library for dashboard-like application experiences. It handles variables, time ranges and URL sync, which plugin developers previously did by hand. A slide quoted Tesler’s Law: complexity can’t be removed, only moved around. The dashboards core moved from a DashboardModel built with React to a tree of nodes, one for each aspect of a dashboard.
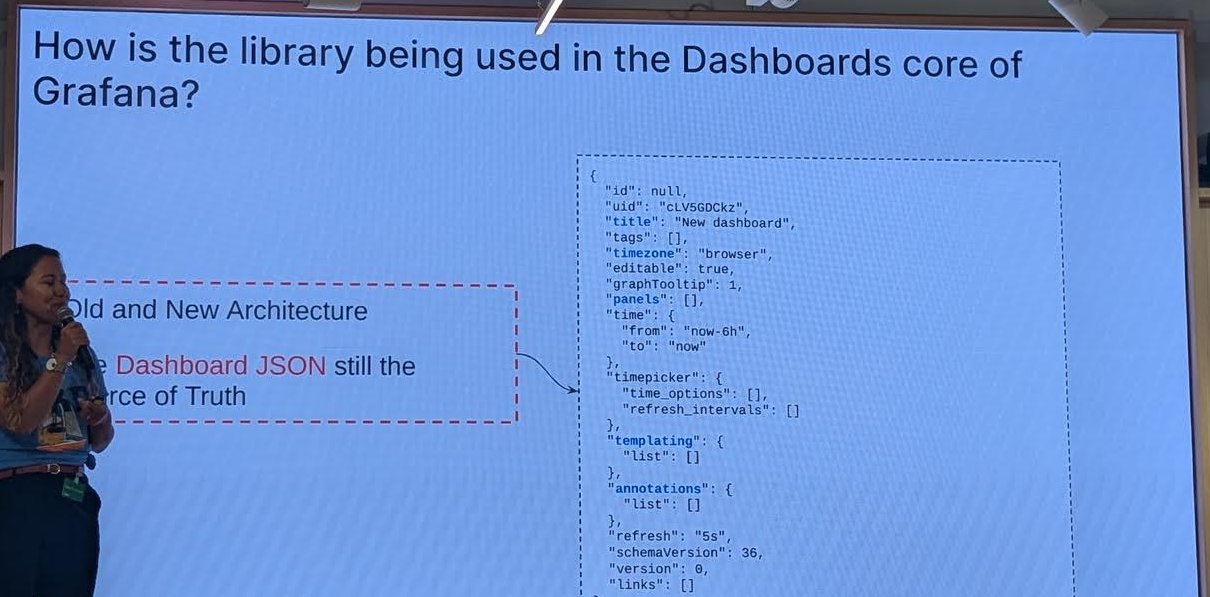
The old and new architecture slide: the dashboard JSON stays the source of truth.
The architecture slide added a reassuring detail for anyone with dashboards in version control: under the “Old and New Architecture” heading, the Dashboard JSON is still the source of truth. The example next to it was a plain empty dashboard (title “New dashboard”, default time range now-6h to now, 5 s refresh, schemaVersion 36), so the stored format stays the same while the in-memory model changes.
A benefit slide covered PDF export, now done in the frontend. Medium dashboards (11 panels) went from 25 s to 6.3 s, small ones (4 panels) from 11.87 s to 7.07 s, and large dashboards (200 panels) from 7.5 minutes to 11 s.
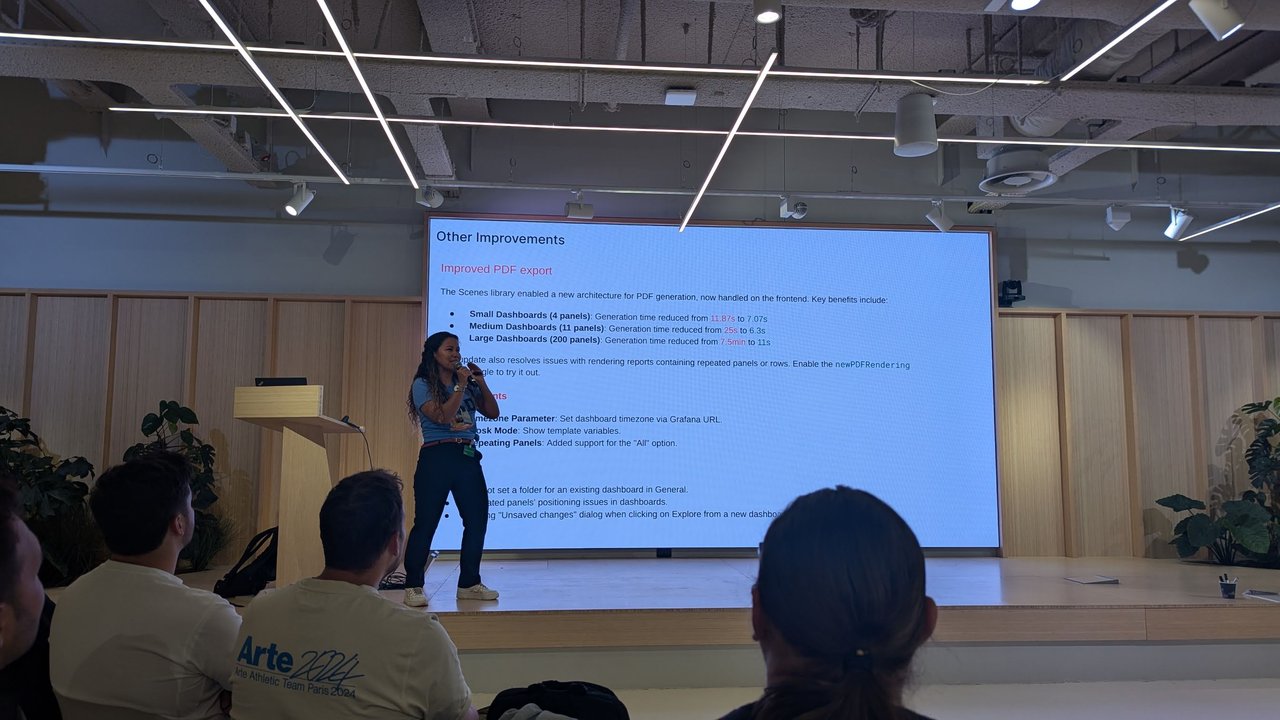
PDF generation timings before and after the Scenes-based architecture.