I spent Tuesday, September 8th at the How to Roll Out OpenTelemetry at Scale event hosted by Grafana Labs in Amsterdam. The room was packed with CNCF maintainers, platform engineers, and observability practitioners from across Europe — the density of experience was immediately apparent.
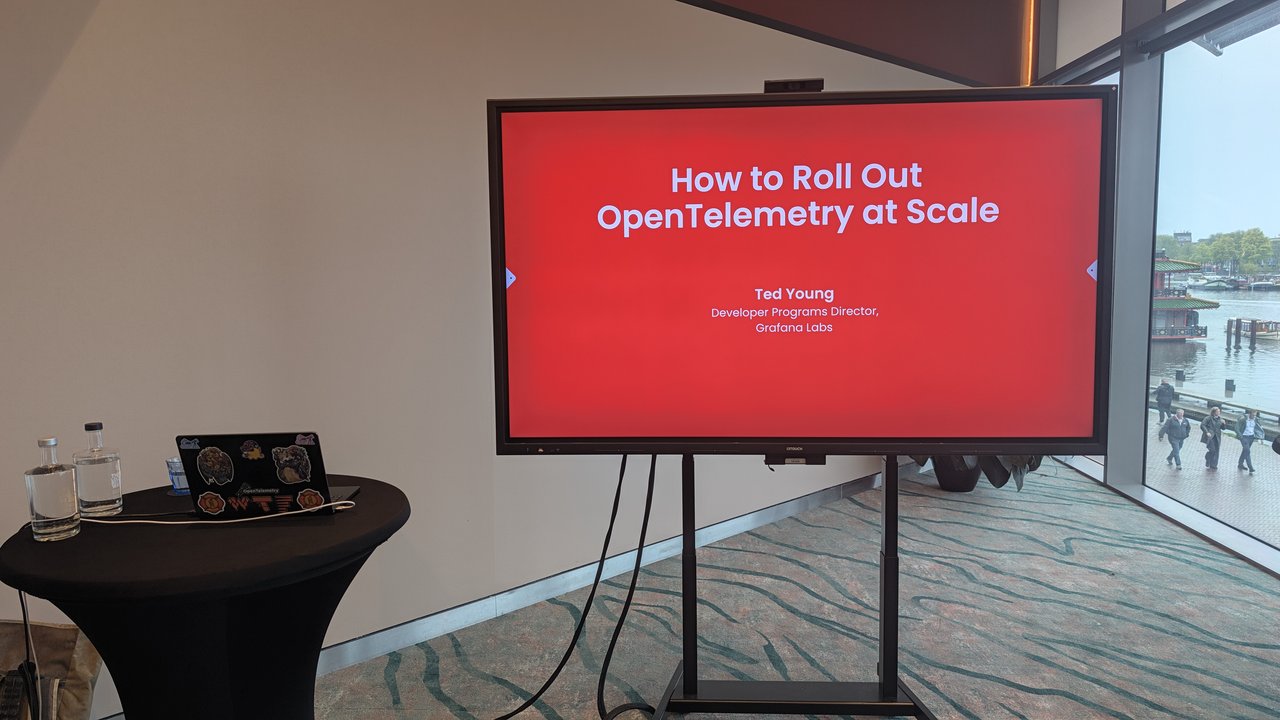
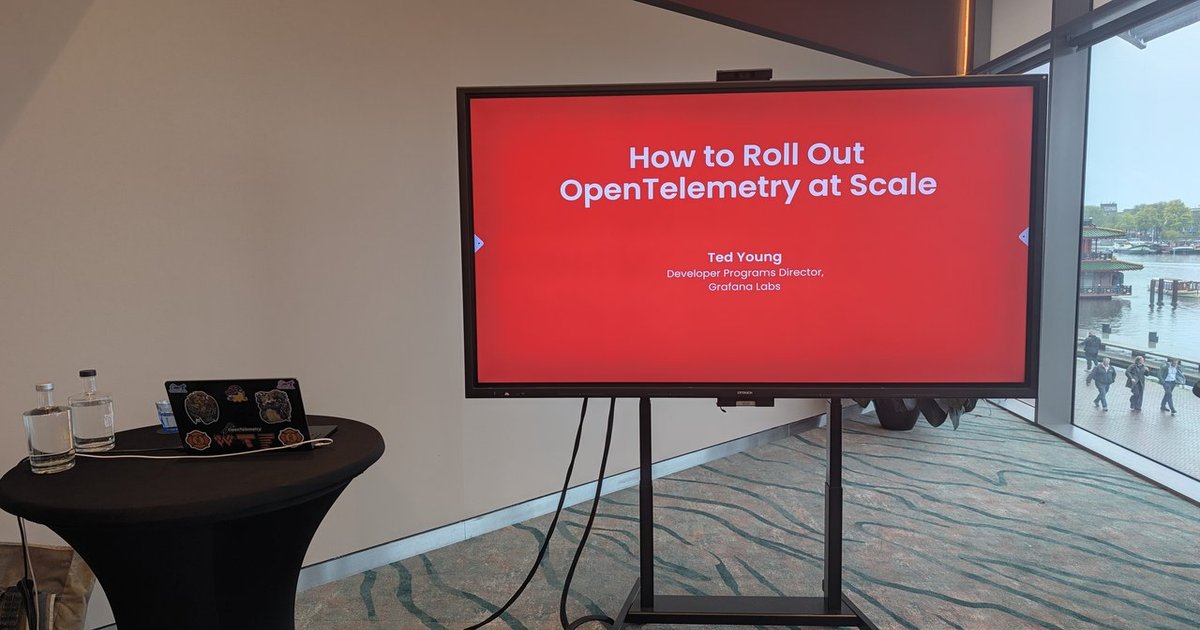
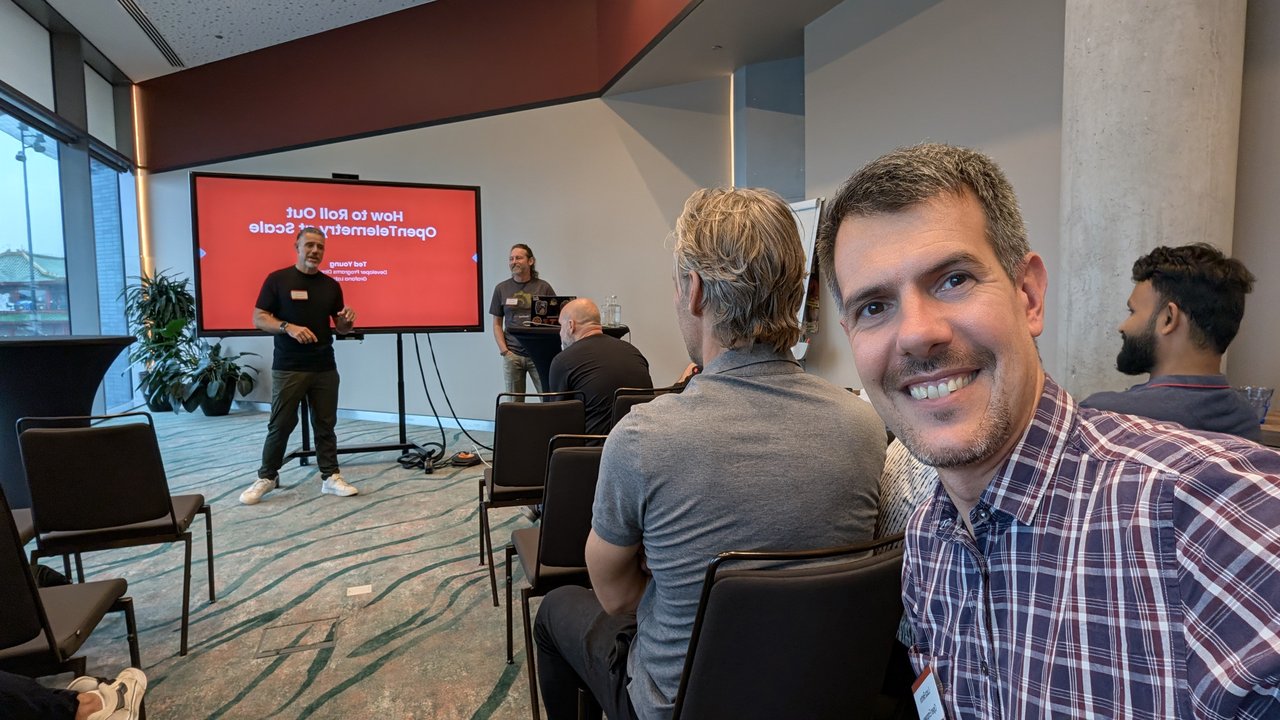
The opening session: Ted Young (Developer Programs Director, Grafana Labs) with the title slide “How to Roll Out OpenTelemetry at Scale.”
The Core Challenge: From Spec to Production
The central question the event set out to answer was not whether to adopt OpenTelemetry — almost everyone in the room had already started. The question was how fast you can ship it to production, and what the gap looks like between “it works in the demo” and “it works in production at scale.”
Ted Young opened with the hard truth: attackers are already using AI to find and exploit misconfigurations faster than manual review cycles can keep up. Defending at human speed against machine-speed threats is a losing position. The same applies to observability — if you can’t collect telemetry at machine scale, you can’t detect issues at machine speed.
“There’s currently a gap between how easy it is to install OpenTelemetry relative to, say, proprietary agents. We’ve now closed that gap.”
OpenTelemetry Rocks, But Rolling It Out Doesn’t
The sentiment in the room was captured perfectly by a slide that drew the biggest laugh of the afternoon:
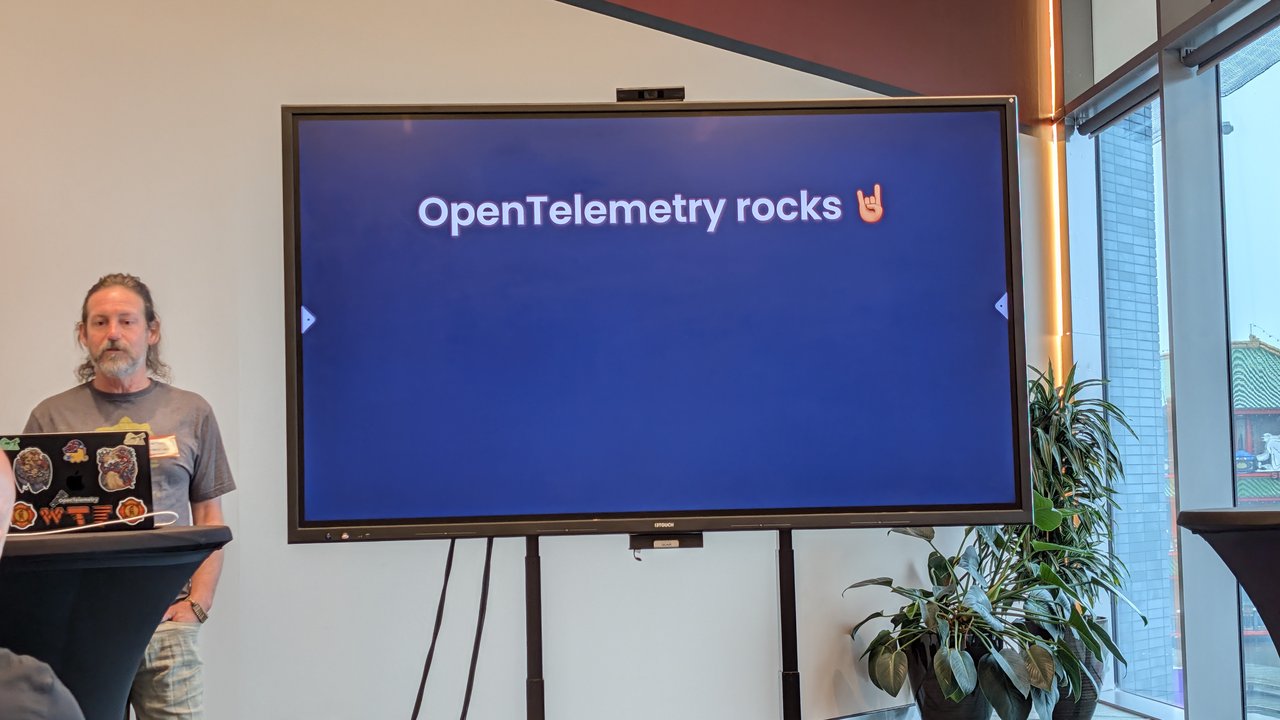
“OpenTelemetry rocks 🤘 / Rolling it out… not so much.”
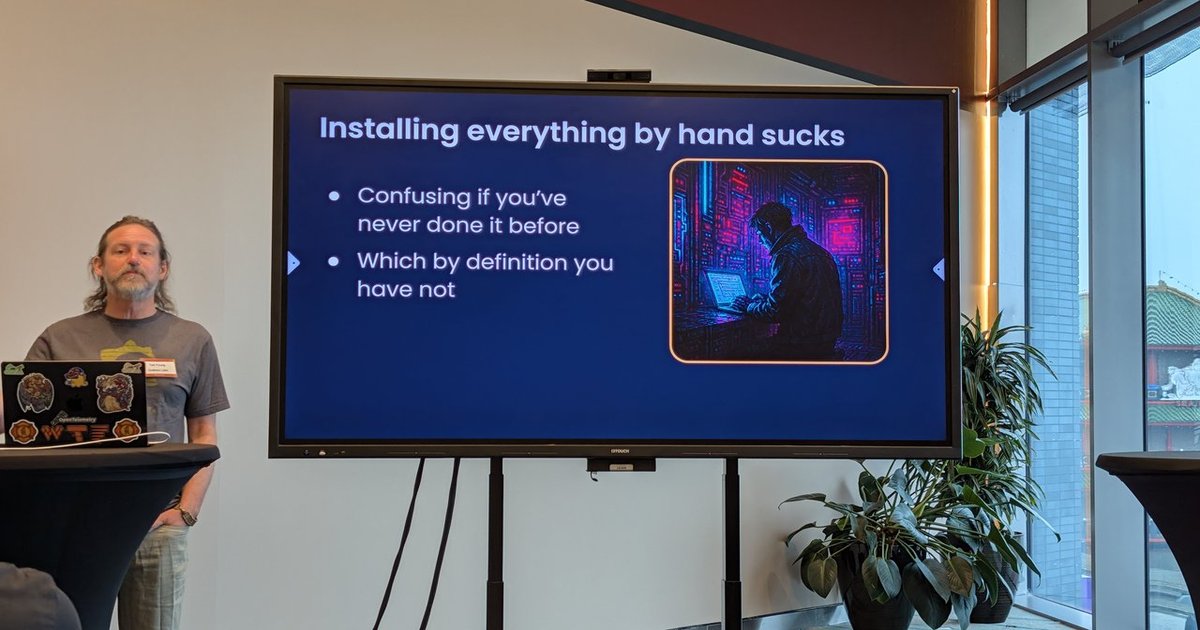
The technology itself — the APIs, the SDKs, the Collector — is solid. The friction comes from the rollout. As Ted explained, the first-time experience has dramatically improved: apt install opentelemetry now gets you complete instrumentation in one command. But rolling it out across an organization with hundreds of services, each with different languages, frameworks, and deployment patterns — that’s where teams hit walls.
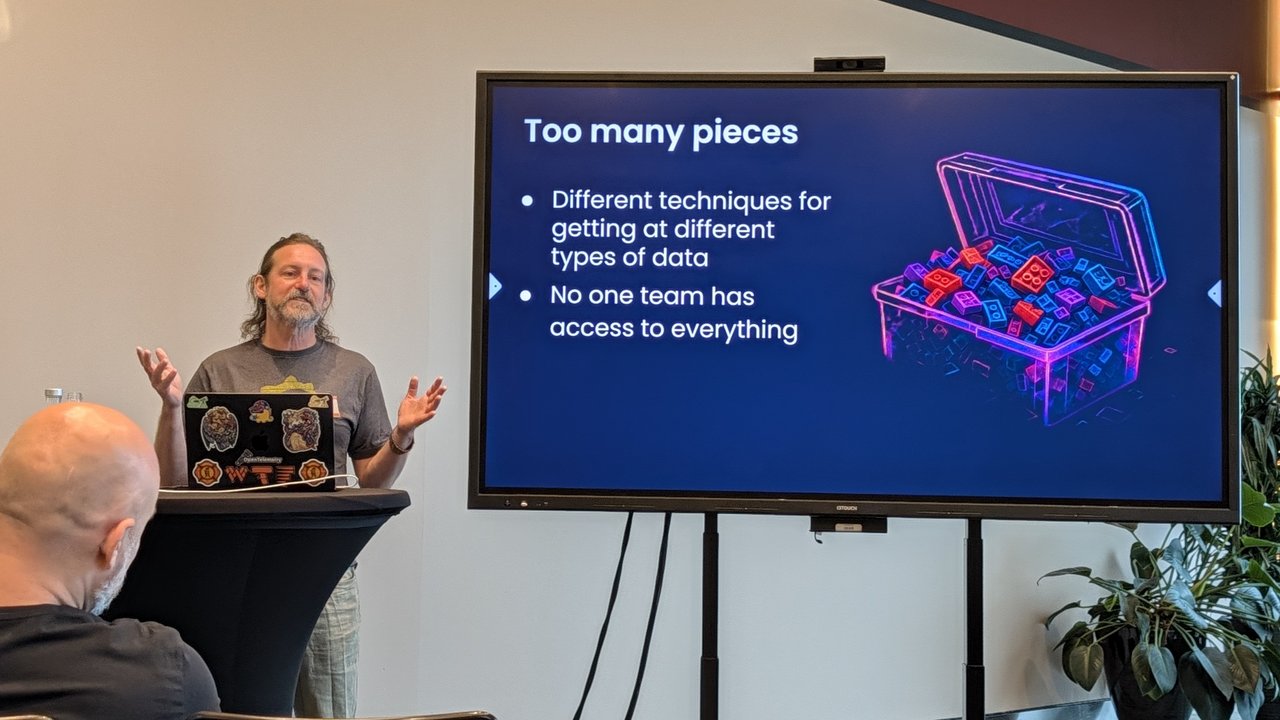
Too Many Pieces: The Fragmentation Problem
A slide titled “Too many pieces” crystallized a recurring pain point:
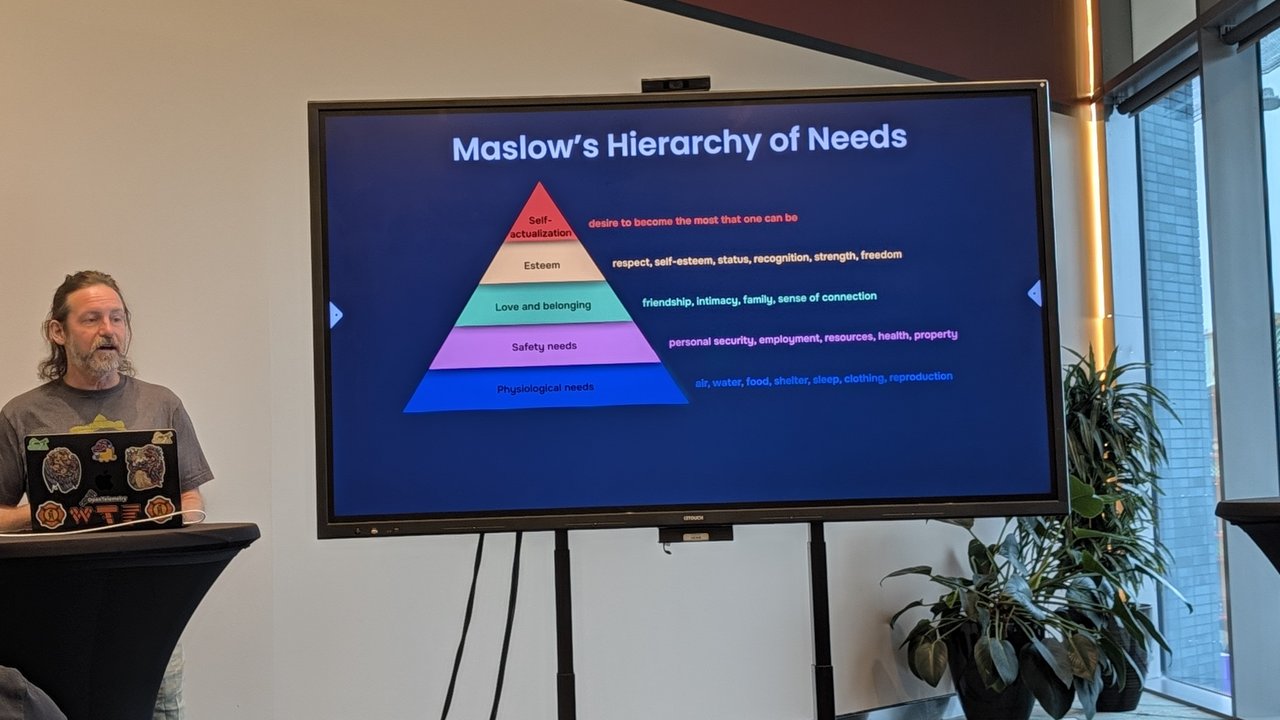
The slide listed two bullet points:
- Comprehensive coverage is critical
- Patchwork rollouts are slow and ineffective
The problem: organizations use different techniques for getting at different types of data, and no single team has access to everything. The result is a treasure chest of tools that look comprehensive but are actually fragmented — each piece covering a slice of the stack, none covering it all.
Infrastructure Visibility: The Foundation
The presentation laid out a practical hierarchy for building observability coverage, starting from the ground up:
- Host / Machine / Process — the basic physical and virtual infrastructure
- Containers: Kubernetes, Cloud Foundry — orchestration platforms
- Cloud Providers: AWS, Azure, Google — managed services
- Fundamental!! — this layer is the non-negotiable base
The lesson: before you instrument custom business logic or chase deep transaction insights, you need to make sure every host, every container, every cloud provider is visible. Without that foundation, everything above it is guesswork.
Austin Parker: Observability IRL
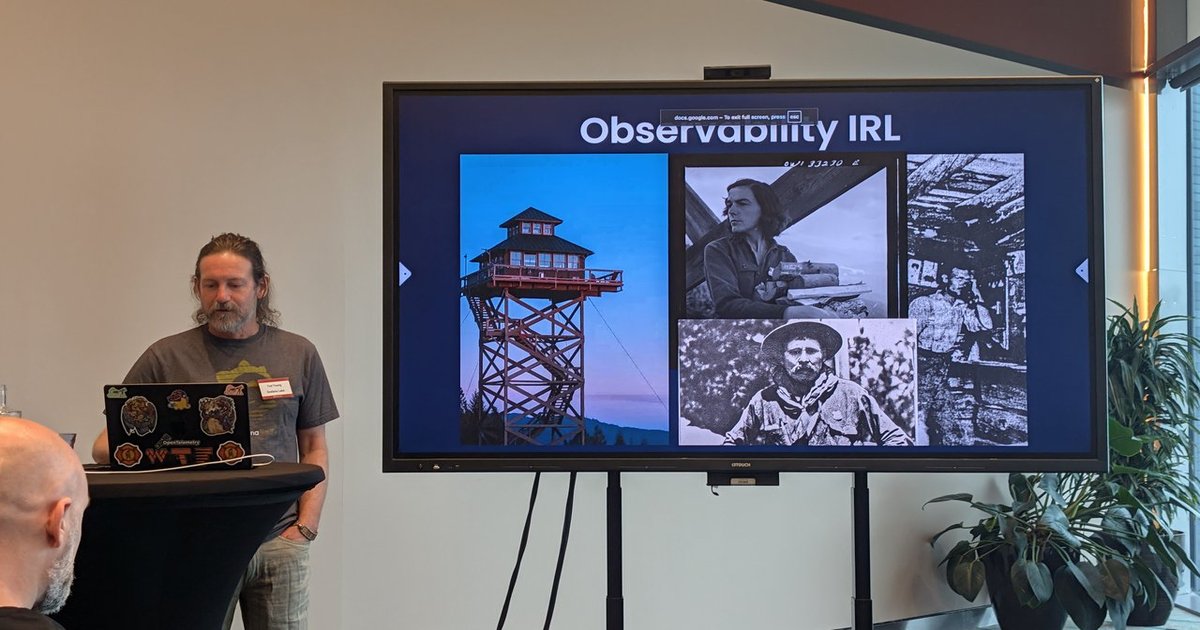
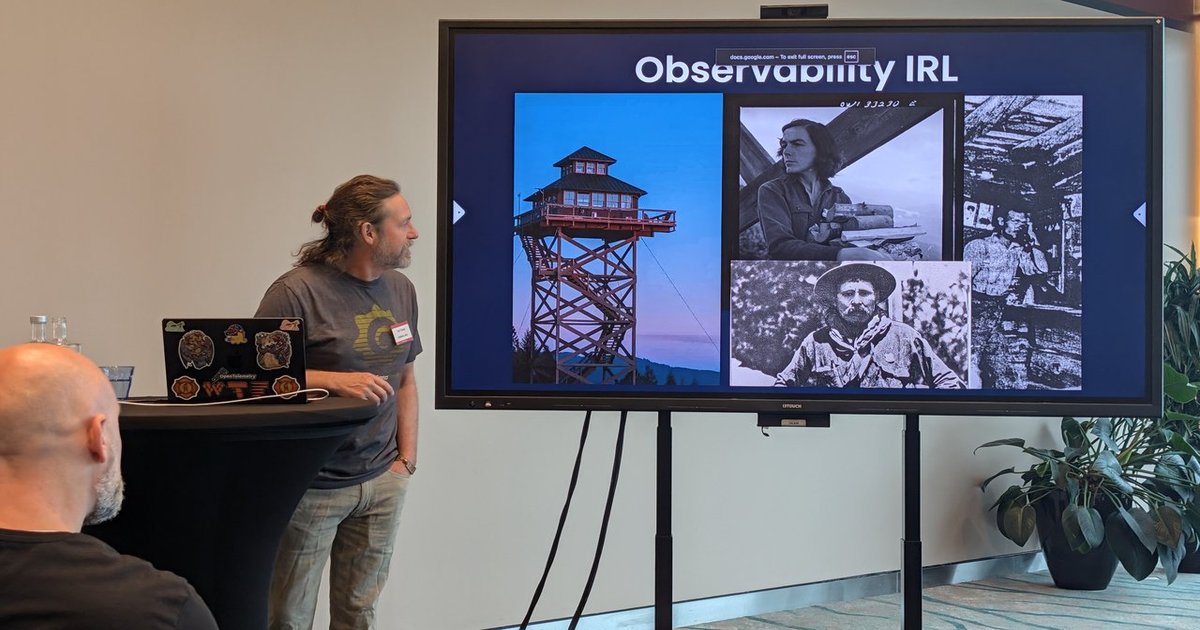
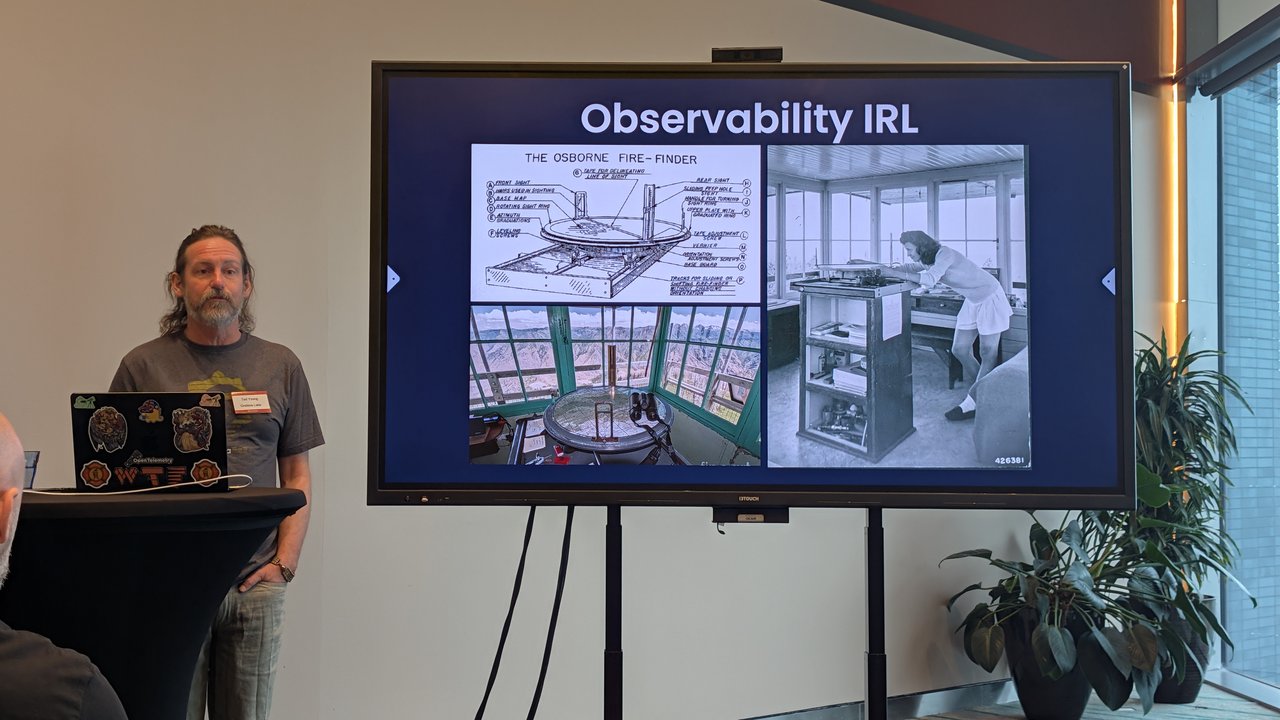
Austin Parker took the stage next with “Observability IRL” — a talk that used the ultimate historical observability system as a metaphor for modern software monitoring: the fire lookout tower and the Osborne Fire-Finder.
Austin Parker presenting “Observability IRL” with the Osborne Fire-Finder analogy.
The Fire-Finder was a mechanical device used by forest lookouts in the early 20th century. A lookout would spot smoke, use the device to determine the bearing, rotate a map table to match, and plot the exact location of a fire. The parallel to modern observability is direct:
- Spotting smoke → detecting anomalies in telemetry data
- Bearing → correlating traces to identify the source
- Plotting on a map → combining metrics, logs, and traces to pinpoint root cause
The Osborne Fire-Finder — the 1930s equivalent of a distributed tracing system.
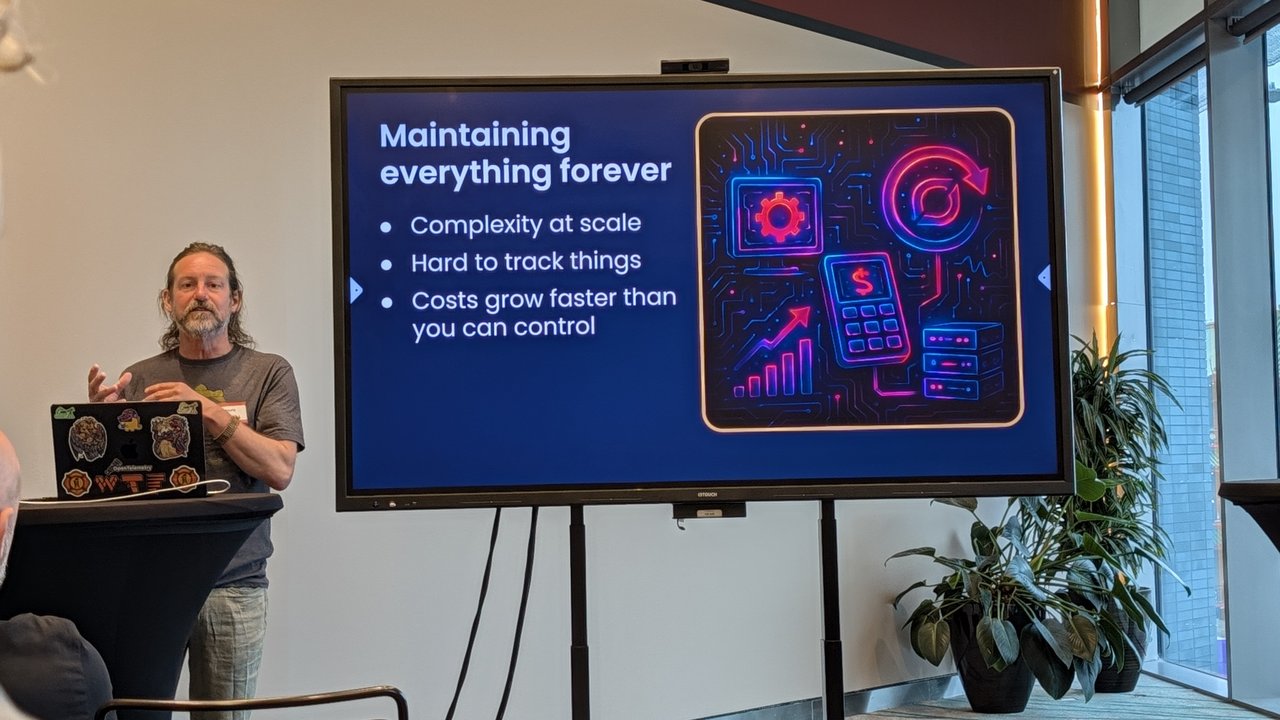
Ted and Ed’s Hierarchy of Observability Needs
One of the most memorable moments was a slide that reimagined Maslow’s Hierarchy of Needs for software observability:
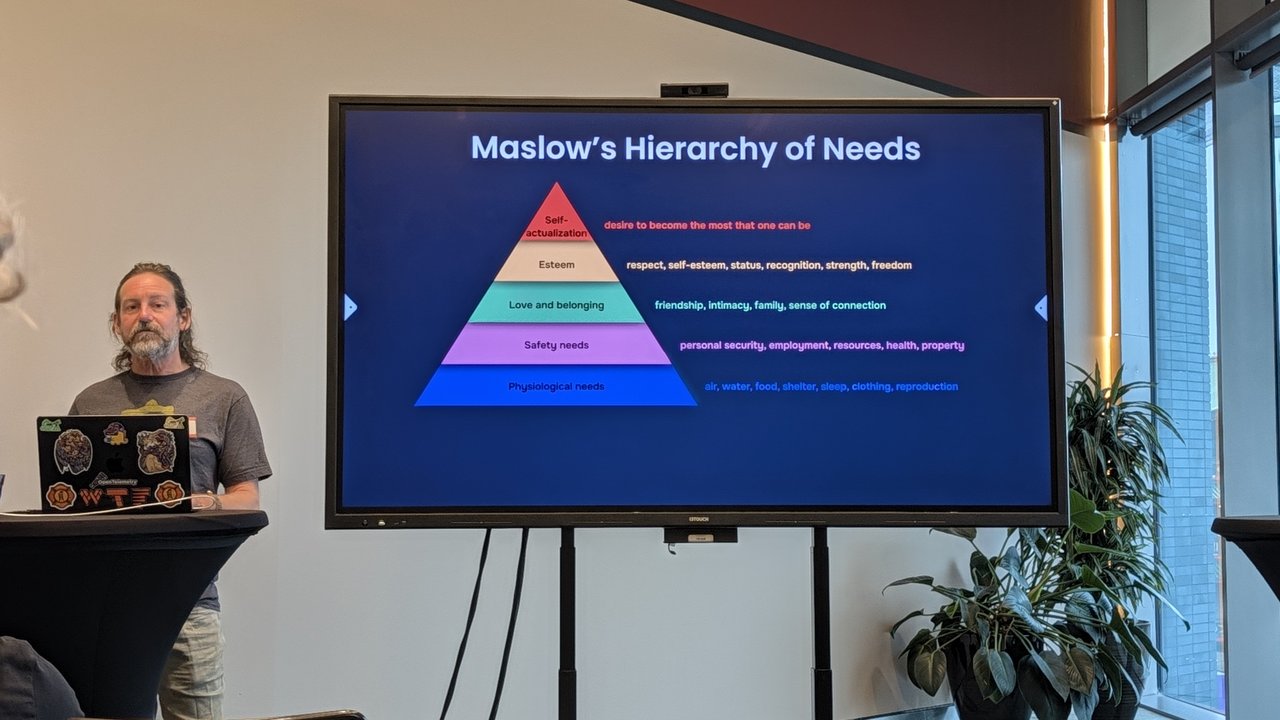
“Ted and Ed’s Hierarchy of Observability Needs” maps the classic psychological pyramid onto the layers of monitoring maturity:
- Infrastructure Visibility (bottom) — observability as an infrastructure feature; breadth first
- Baseline Service Visibility — service-level dashboards and alerts
- Deep Transaction Insights — full distributed traces across service boundaries
- Custom Logic (top) — observability as a feature of your services; depth first
The insight: just as Maslow said you can’t pursue self-actualization until basic needs are met, you can’t chase custom observability logic until you have infrastructure visibility nailed. The bottom layers must be satisfied before the higher ones make sense.
Why I Am Dusty
Between technical sessions, Ted Young shared a personal interlude that explained his recent Instagram posts: “Why I am dusty.” The story tied back to his art installation at Burning Man 2026 — a 30-foot “LOOK OUT!” tower built in the Black Rock Desert.
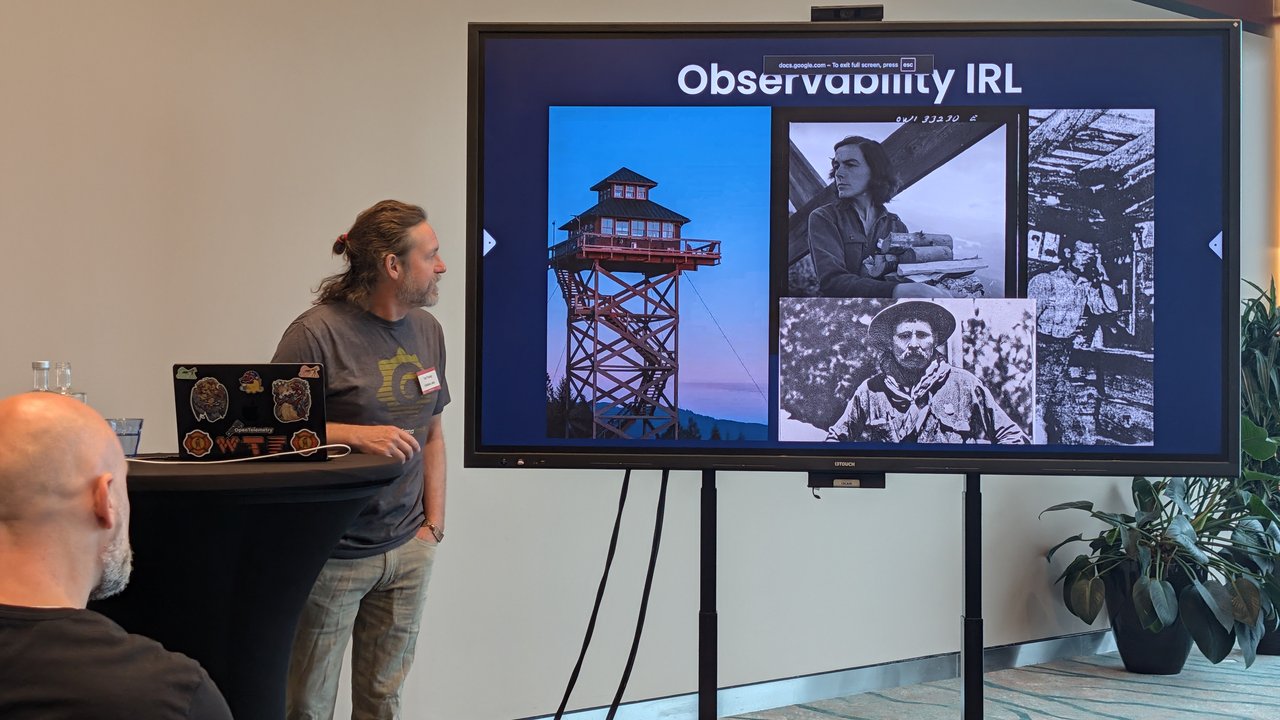
The “dust” wasn’t just a side effect of the desert environment — it was the point. The tower was designed to be climbed, and the alkaline dust of the playa got everywhere. The metaphor: building systems that can be observed is like building a tower that people can climb — you have to design for the journey, not just the destination.
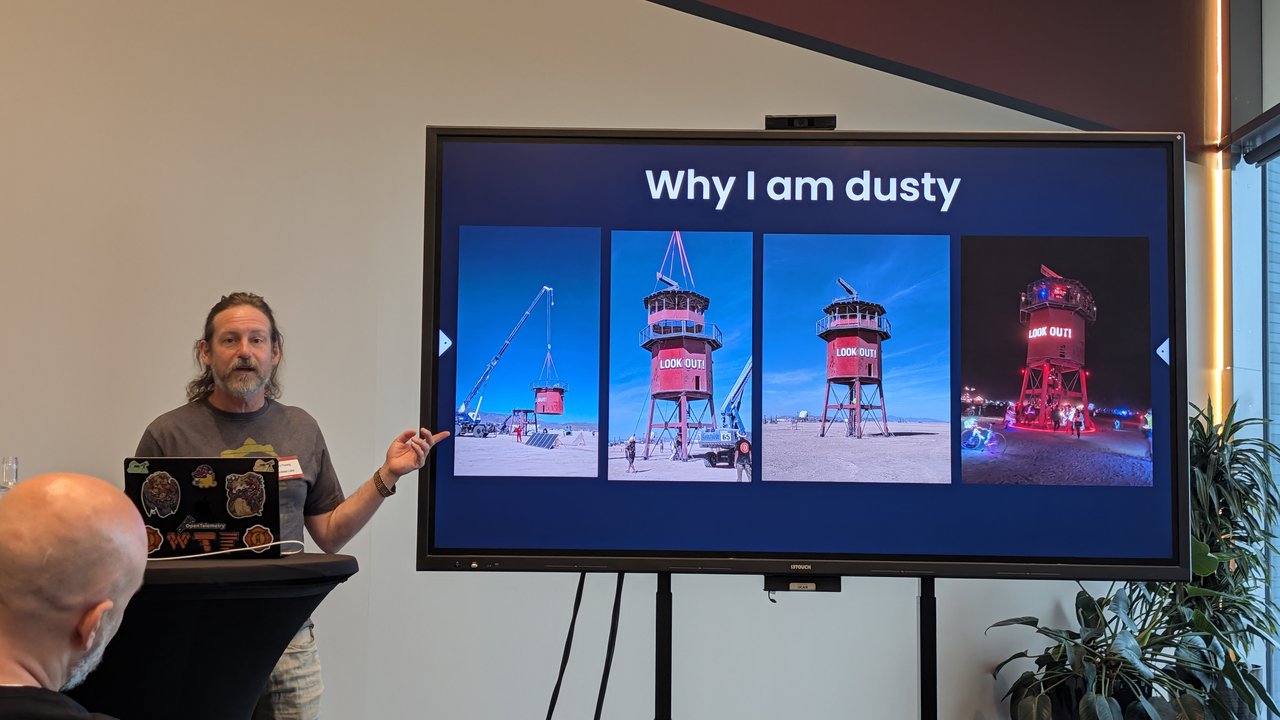
The “LOOK OUT!” tower at Burning Man 2026 — the inspiration for the observability metaphor.
Coffee Break Conversations
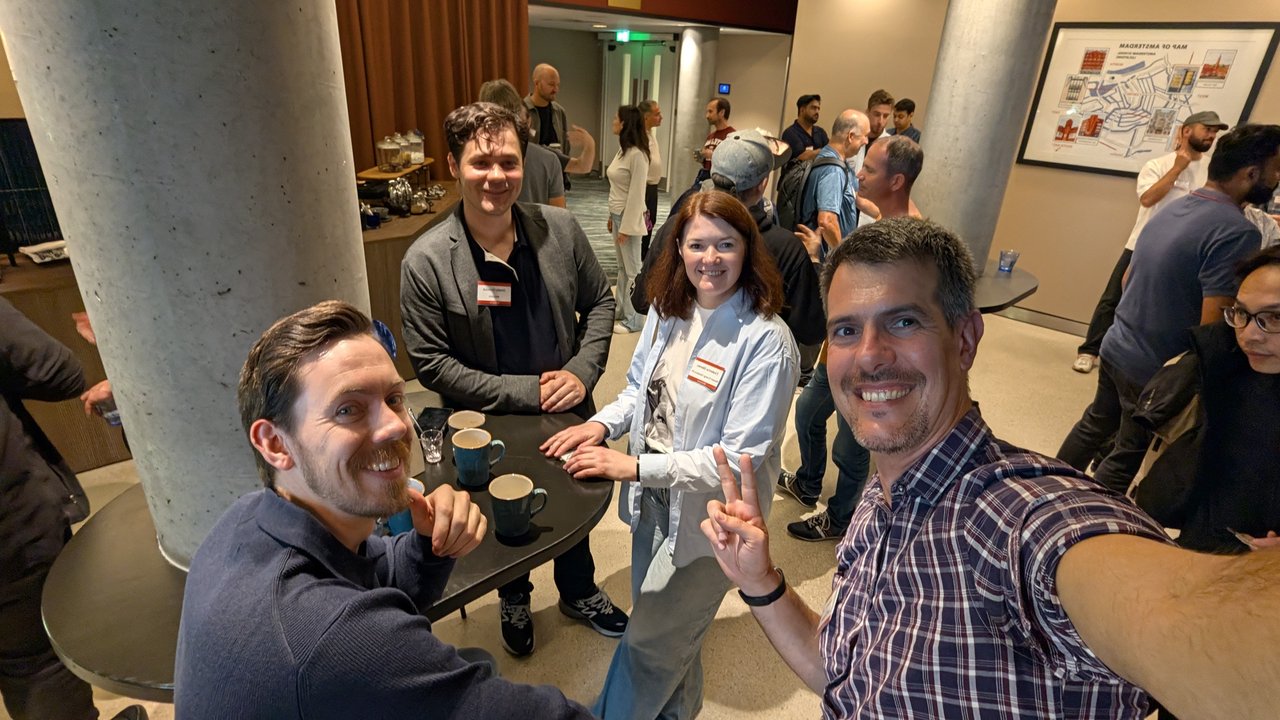
The value of the event extended far beyond the slides. Between sessions, the coffee break became a living room for some of the most interesting conversations.
Attendees during the coffee break, with the Amsterdam map visible on the wall.
The Big Picture
What emerged from a day of talks, demos, and hallway conversations was a shared recognition: OpenTelemetry is crossing the chasm from “early adopter tool” to “production default.” The project has solved the hard problems — the standards, the specs, the cross-language instrumentation. What remains is the operational challenge of rolling it out across real organizations with real legacy systems.
The difference from five years ago is stark. Where once you needed dedicated SRE time to configure a Collector, write instrumentation, and tune sampling strategies, today you can get 80% of the way with a single package install. The defaults just work — and that’s the real victory.
The question now is how much of the remaining 20% is unique to each organization, and how much can be systematized into playbooks that work across industries.
Related Reading
- Scaling OpenTelemetry with Ted Young (Grafana Labs)
- Edge AI Monitoring with Prometheus and Grafana
- OpenTelemetry Arrow Protocol: OTAP for Edge Scale
About the Author
I am Luca Berton, AI and Cloud Advisor. I work at the intersection of cloud security, platform engineering, and enterprise AI deployments. Book a consultation.