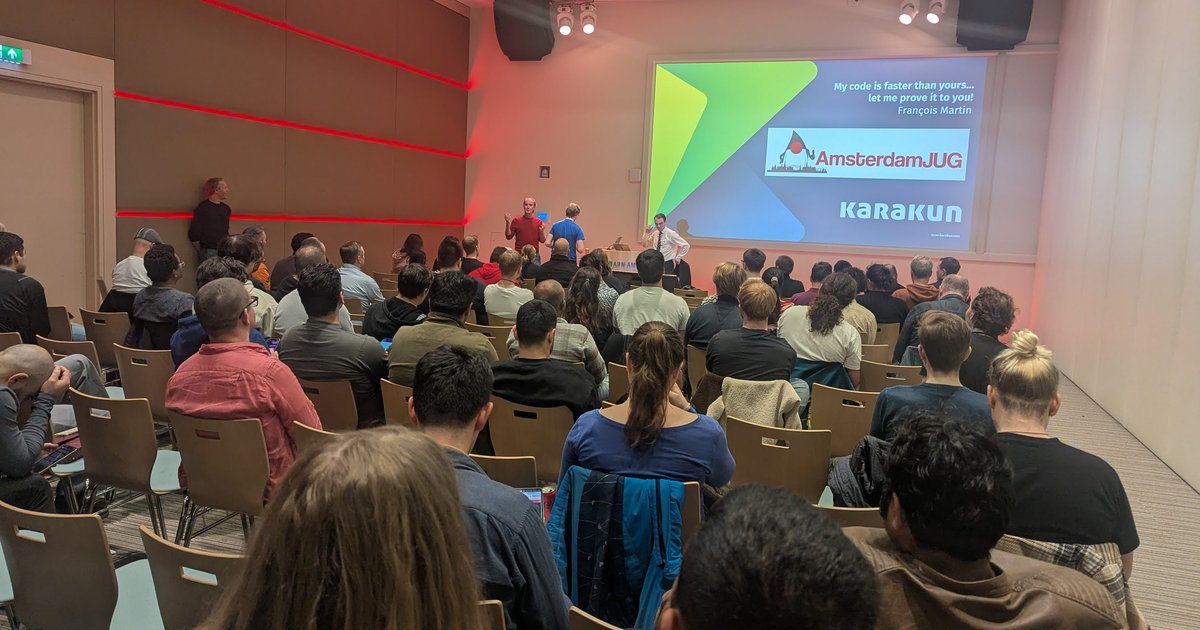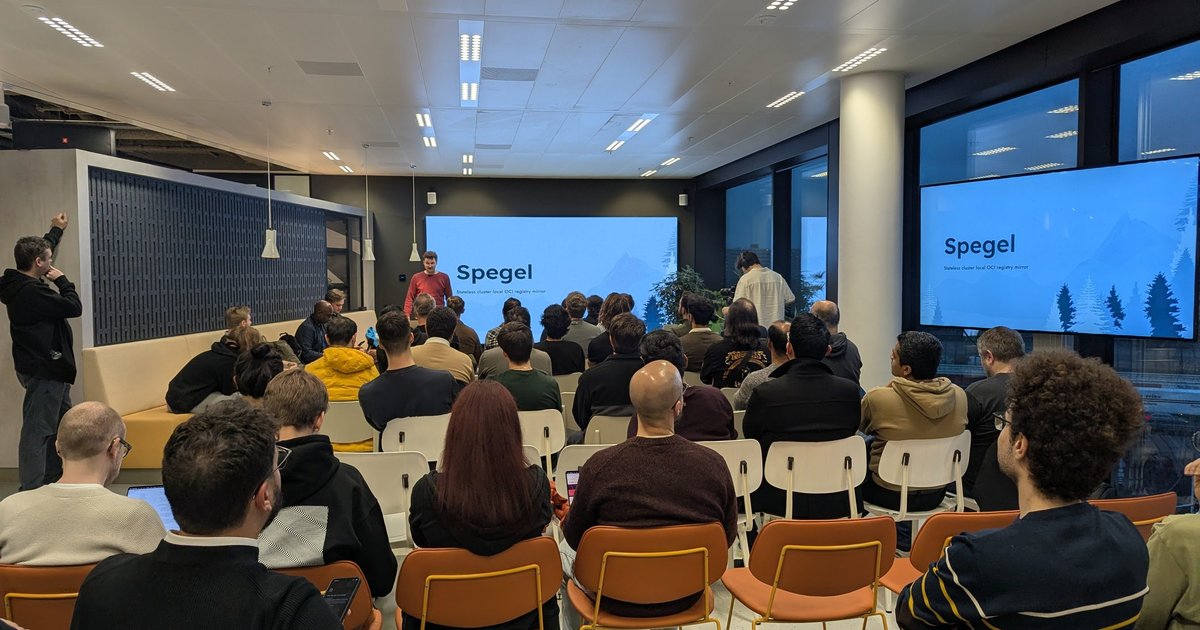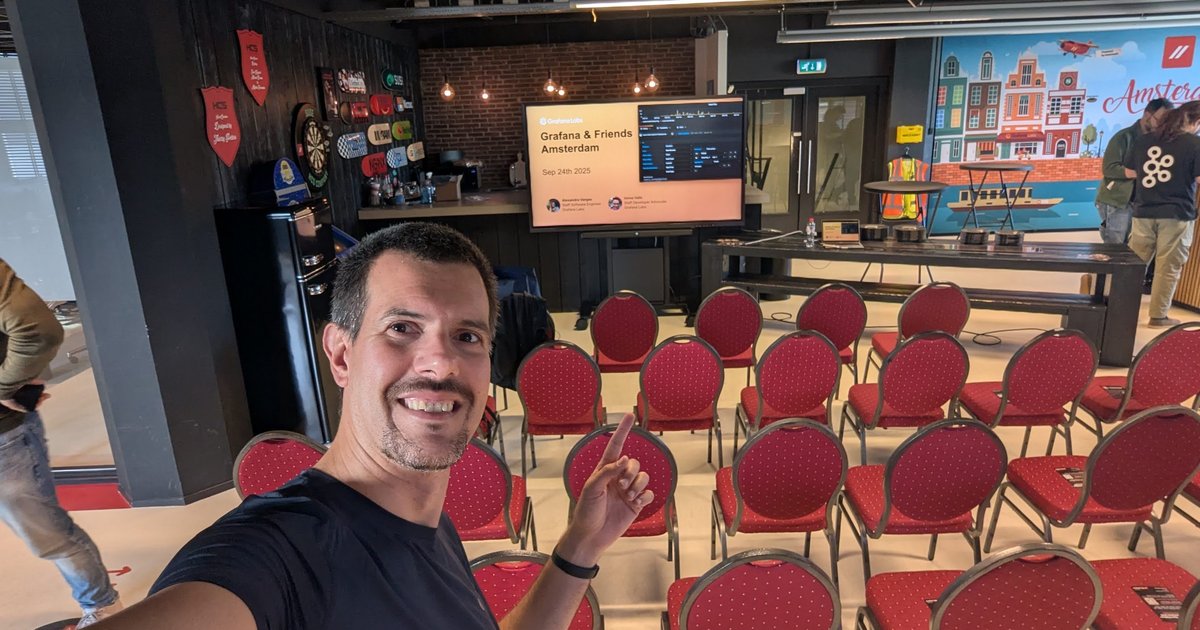
On Wednesday 24 September 2025 I went to Grafana & Friends Amsterdam, a Grafana Labs community meetup. The theme was Grafana plus Apache Kafka. The room was the HCS company space, branded “Tech Tribes”, with red banquet chairs, a dartboard, a wall of logo skateboard decks and a big Amsterdam mural.
This post is a throwback built from my photos and one short video clip. My photos cover the arrival and the opening talk on Grafana community plugins, so that’s what I write about in detail.
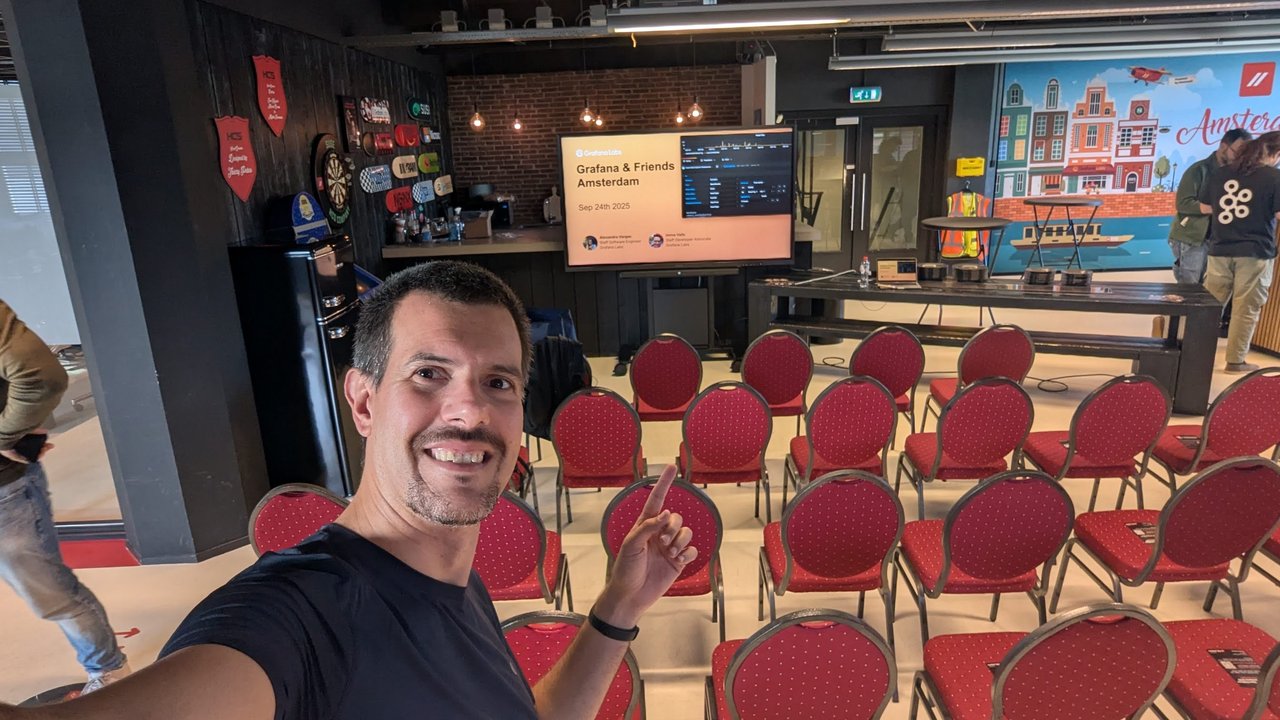
Early, with the chairs still empty. The Grafana Labs title slide credited Alexandra Vargas (Staff Software Engineer) and Imma Valls (Staff Developer Advocate), both of Grafana Labs.
Speakers and agenda
The agenda screen listed three speakers:
- Imma Valls, Staff Developer Advocate at Grafana Labs
- Maria Berinde-Tâmpănariu, Staff Solutions Engineer at Confluent
- Danica Fine, Sr Manager, OSS Developer Relations at Snowflake
And three talks:
- Supercharging Grafana with Community Plugins
- Which Data Format Should I Use in Apache Kafka?
- Iced Kaf-fee: Chilling Kafka Data into Iceberg Tables
The schedule moved during the evening. At first it showed doors at 17:30, the welcome at 18:30 and the talks at 18:45, 19:00 and 19:40. A few minutes later the screen showed a revised schedule: the welcome at 18:20, the plugins talk at 18:35, a second round of food and drinks at 18:50, and the Kafka talks at 19:15 and 19:55.
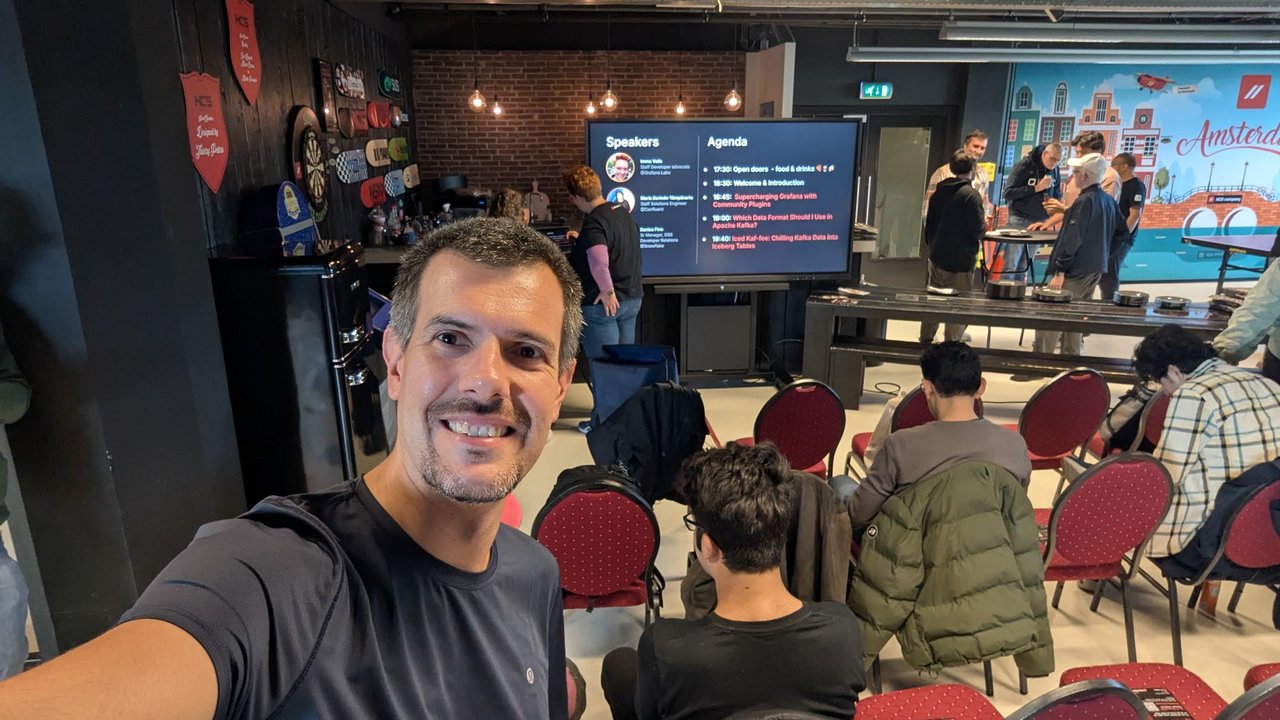
The speakers and agenda screen, while people were still arriving and getting food.
Supercharging Grafana with community plugins
The first talk, from the Grafana Labs pair on the title slide, was about extending Grafana with plugins written by the community, not by Grafana Labs.
A dashboard as the hook
It opened with a European energy infrastructure dashboard: a dark world map of Europe covered in coloured points, with a legend down the side. The link under it pointed to Grafana’s 2023 Golden Grot Awards grand prize winners. According to that post, the dashboard tracks gas storage, gas flows, electricity generation and energy prices, using Grafana’s geomap panel and data fetched into PostgreSQL every 15 to 30 minutes.
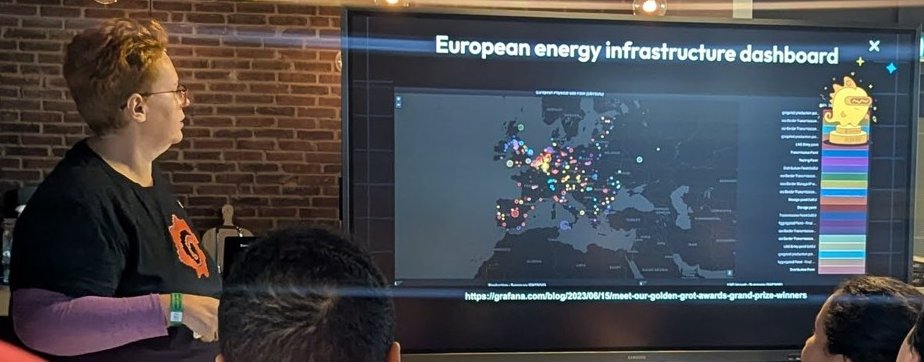
A Golden Grot Awards winner, used to show what one person can build on top of Grafana.
Plugin signatures
Next came the slide every platform team should know before installing a plugin: plugin signatures. The table had five rows:
| Signature | Created by | Supported by | Enterprise licence required? | In the catalog |
|---|---|---|---|---|
| Grafana | Grafana Labs | Grafana Labs | No | Yes |
| Enterprise | Grafana Labs | Grafana Labs | Yes* | Yes |
| Community | Individuals or organisations with no commercial relationship to the service | Plugin author | No | Yes |
| Commercial | Vendor of the underlying service | Vendor | No | Yes** |
| Private | Anyone | Plugin author | No | No |
The footnotes said that the Grafana Cloud free tier includes access to all Enterprise plugins at no additional cost, and that commercial plugins need a partnership agreement between Grafana Labs and the service provider. The full definition is on Grafana’s plugin signature levels page.
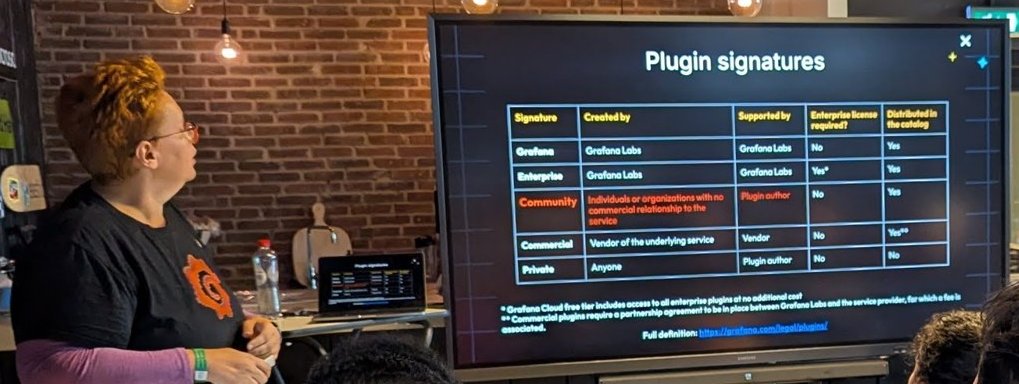
Who builds the plugin, and who supports it. The Community row was the one highlighted.
My take: the “Supported by” column is the one to read. A community plugin can be excellent, but its support model is the author and their GitHub issues. That’s fine for a lab dashboard. For anything an on-call team relies on, check the repository’s activity and pin the version.
Real-time Kafka visualisation with the Kafka plugin
The example community plugin was the Kafka data source: “Real-time Kafka visualization with the Kafka Plugin”, from github.com/hoptical/grafana-kafka-datasource. The slide showed the plugin’s catalog page and its developer, Hamed Karbasi.
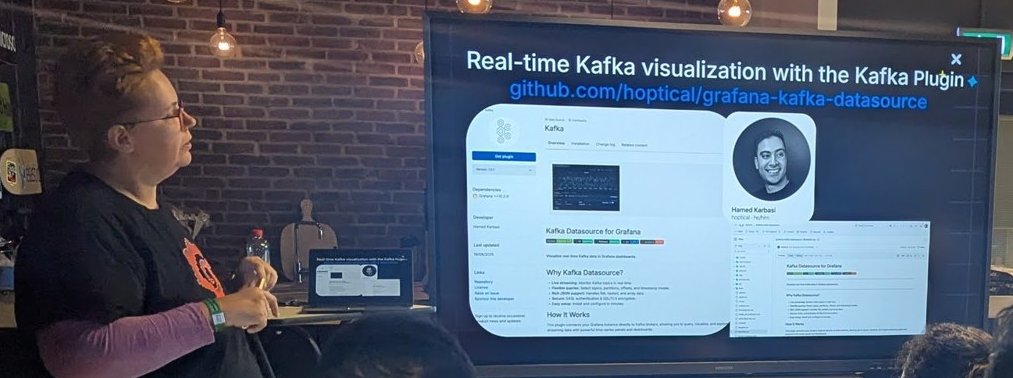
The Kafka data source plugin’s catalog page on screen.
A short Kafka refresher followed. The Apache Kafka architecture slide described Kafka as a distributed event streaming platform for large volumes of data in real time. Producers publish (write) to Kafka, consumers subscribe (read), and topics are the “categories” that records are published to. Partitions are ordered, immutable sequences of records in a topic, which allows parallel processing and scalability. Each message in a partition has a unique sequential ID called its offset.
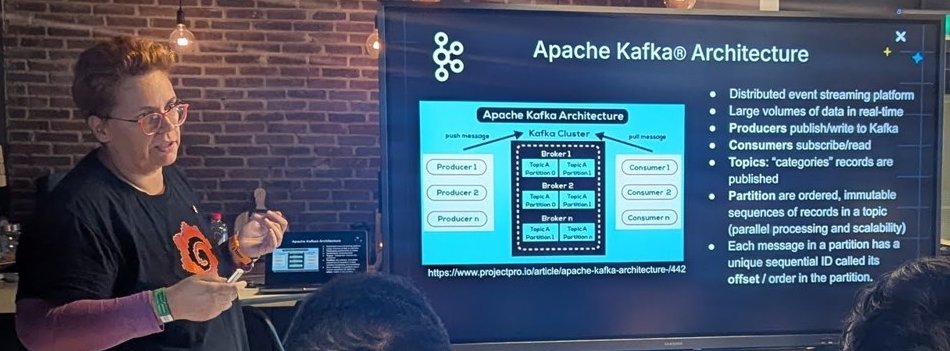
Producers, brokers, partitions, consumers: the basics you need before reading a topic from Grafana.
The demo
Then came a live demo, and I filmed part of it. The plugin’s catalog page lists its requirements and features, and its GitHub issues accept contributions. The demo started a small producer from the repository that sent JSON messages to a local topic. On the Grafana side, the data source configuration took the broker list (a single local broker for the demo), a choice of security protocols and a log level. After a successful test, it opened Explore with the topic test. You can filter by partition and choose where to start reading: the latest messages, the latest minus N, or the earliest. A ready-made dashboard then showed the usual Kafka metrics with the actual messages next to them.
The current plugin page on grafana.com confirms the same model. The Kafka plugin is listed at the Community signature level, with real-time streaming, partition selection and offset options. It also supports SASL and SSL/TLS authentication and JSON, Avro, Protobuf, plain text and InfluxDB line protocol messages, with Schema Registry support.
My take: seeing the payloads next to the broker metrics is useful when you debug a pipeline. You can see that consumer lag went up and also what was in the messages at the time. I wouldn’t point it at a busy production topic from a shared Grafana instance without thinking about access, though. A dashboard that shows message bodies can expose data that your metrics never would.
References
The talk ended with a references slide. It linked the plugin catalog, Grafana’s guide Data sources, visualizations, and apps: a guide to extending and customizing Grafana, the Kafka data source repository, a recording from a Stockholm meetup, three plugin-tools tutorials (build a data source plugin, plus logs and streaming data source variants) and the Grafana demo environment.
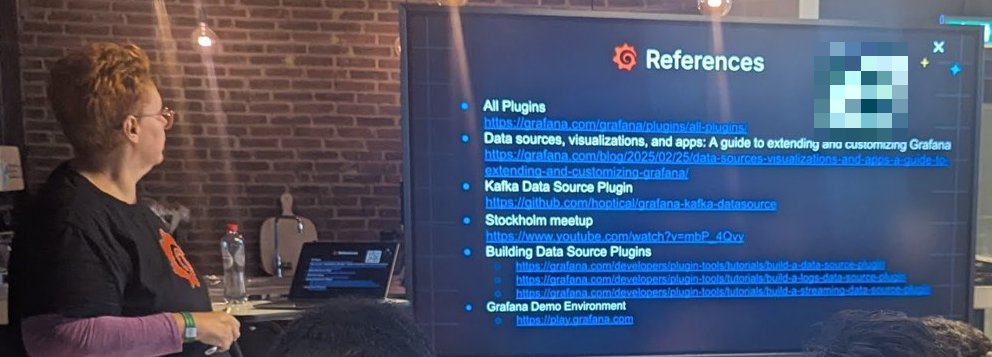
Where to go next if you want to write your own data source plugin. I’ve blurred the QR code.
What I took home
- Grafana’s extensibility is a supply chain. Signature levels tell you who built a plugin and who supports it. Treat that like any other dependency decision.
- Data source plugins are the shortest path to a new backend. The Kafka plugin shows how far a single community author can take one, and the plugin-tools tutorials are the place to start your own.
- Kafka observability is more than lag graphs. Being able to read a topic in Explore, with partition and offset control, turns Grafana into a debugging tool as well as a monitoring one.