A slow PostgreSQL query is easy to fix when you own the SQL. It’s harder when the query comes from an ORM, a vendor product or a code path nobody is allowed to touch. Then your only lever is the schema: the right index, built so the planner can match it to a query you can’t edit. This guide goes through the whole loop: find the query, read the plan, pick an expression, partial or hash index, and prove that it’s being used.
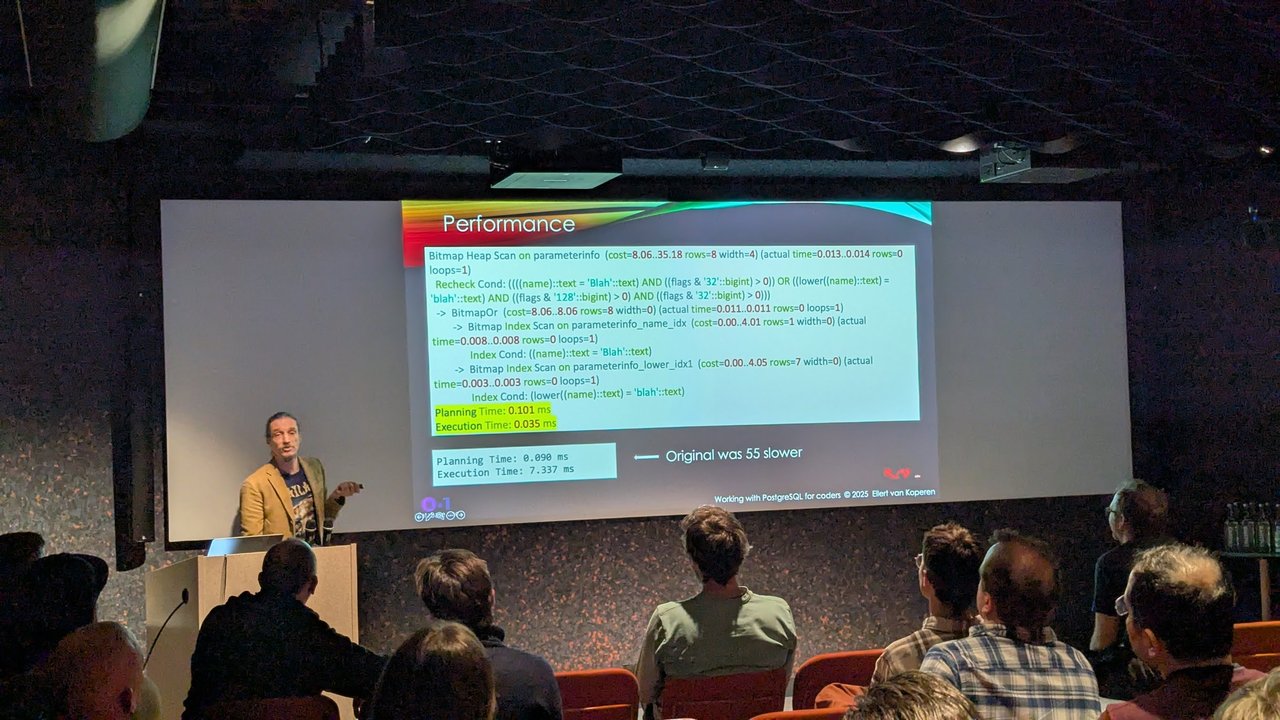
The idea came from Ellert van Koperen’s “Database Academy: Working with PostgreSQL for coders” talk at a PostgreSQL user meetup in Amsterdam in February 2025. In the talk, a query that couldn’t be changed went from 7.337 ms to 0.035 ms with indexes alone. Below I rebuild a similar scenario on my own test table, so all the plans shown here are from my runs, not from the talk.
Versions. I checked everything against the PostgreSQL 18 documentation (the current version on postgresql.org/docs at the time of writing). I ran every example on a throwaway local PostgreSQL 14.24 cluster. Where 14 and 18 behave differently, I say so.
The test table and the query you can’t change
CREATE TABLE parameterinfo (
  id    bigint GENERATED ALWAYS AS IDENTITY PRIMARY KEY,
  name  text    NOT NULL,
  flags integer NOT NULL DEFAULT 0,
  value text
);

-- 13,000 rows; about 10% have bit 0x20 set, about 10% have bit 0x80 set
INSERT INTO parameterinfo (name, flags, value)
SELECT CASE WHEN g % 2 = 0 THEN 'Module' || (g % 400) || '.Setting' || g
            ELSE 'module' || (g % 400) || '.setting' || g END,
       CASE WHEN random() < 0.10 THEN 32  ELSE 0 END
     | CASE WHEN random() < 0.10 THEN 128 ELSE 0 END
     | (random() * 15)::int,
       md5(g::text)
FROM generate_series(1, 13000) AS g;
ANALYZE parameterinfo;
The application sends this query, and we’re not allowed to change it:
SELECT id, name, value FROM parameterinfo
WHERE (name = 'Module7.Setting7' AND (flags & 32) > 0)
   OR (lower(name) = lower('Module7.Setting7') AND (flags & 128) > 0);
Step 1: find the slow PostgreSQL query with pg_stat_statements

A slide from the Database Academy talk at the PostgreSQL user meetup in Amsterdam: according to pg_stat_statements the query averaged about 8.656 ms, ran 359,513,795 times in one year on a table of about 13,000 rows, and could not be changed.
pg_stat_statements has to be loaded at server start, so you need a restart:
# postgresql.conf
shared_preload_libraries = 'pg_stat_statements'
compute_query_id = on    # 'auto' (the default) also works once the module is loaded
Then create the extension in the database you want to inspect:
CREATE EXTENSION pg_stat_statements;

SELECT queryid,
       calls,
       round(mean_exec_time::numeric, 3)  AS mean_ms,
       round(total_exec_time::numeric, 1) AS total_ms,
       rows,
       100.0 * shared_blks_hit / nullif(shared_blks_hit + shared_blks_read, 0) AS hit_percent,
       left(query, 80) AS query
FROM pg_stat_statements
ORDER BY total_exec_time DESC
LIMIT 10;
Sort by total_exec_time, not mean_exec_time. A query that takes a few milliseconds and runs all day costs more in total than a slow report that runs once. In the talk, the query averaged about 8.656 ms but ran 359,513,795 times in one year. The view stores the normalised text, so my query appears as WHERE (name = $1 AND (flags & $2) > $3) OR .... Note the queryid. After you deploy a fix you can reset just that entry with SELECT pg_stat_statements_reset(0, 0, <queryid>); and watch the new numbers come in.
Step 2: read EXPLAIN (ANALYZE, BUFFERS)
EXPLAIN (ANALYZE, BUFFERS)
SELECT id, name, value FROM parameterinfo
WHERE (name = 'Module7.Setting7' AND (flags & 32) > 0)
   OR (lower(name) = lower('Module7.Setting7') AND (flags & 128) > 0);
Seq Scan on parameterinfo (cost=0.00..518.50 rows=22 width=62) (actual time=1.523..1.523 rows=0 loops=1)
Filter: (((name = 'Module7.Setting7'::text) AND ((flags & 32) > 0)) OR ((lower(name) = 'module7.setting7'::text) AND ((flags & 128) > 0)))
Rows Removed by Filter: 13000
Buffers: shared hit=161
Execution Time: 1.530 ms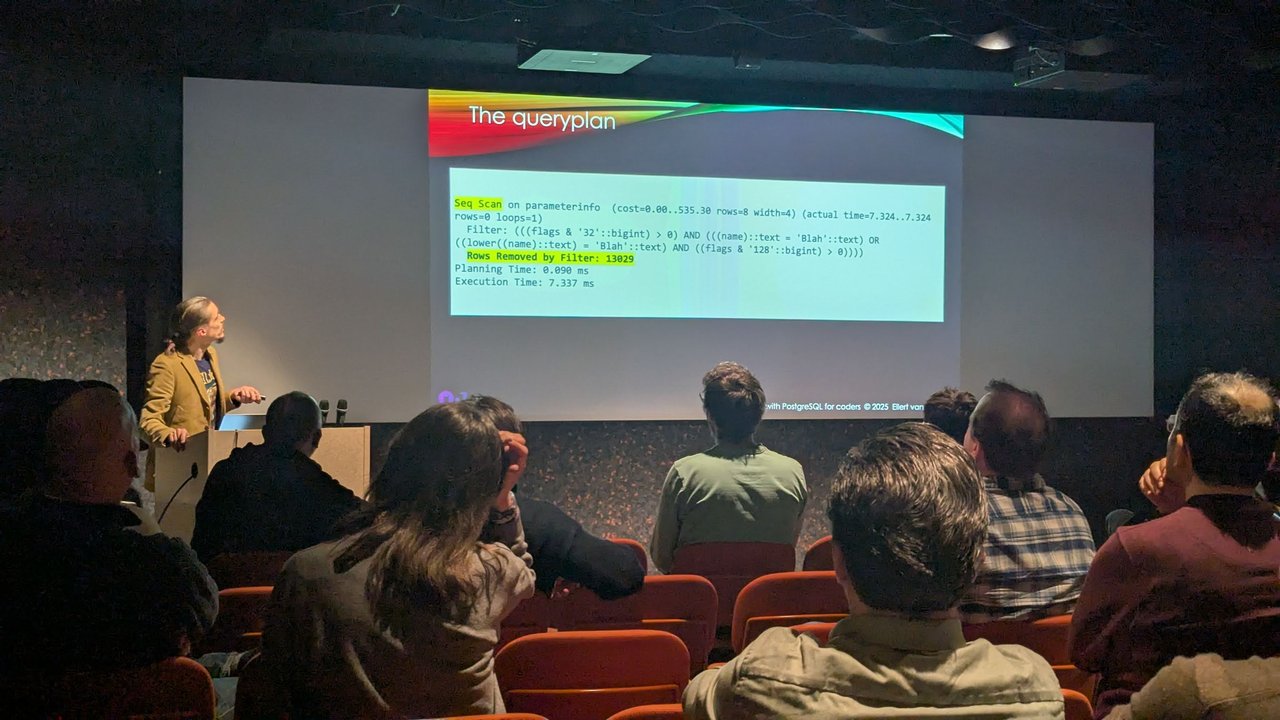
A slide from the Database Academy talk at the PostgreSQL user meetup in Amsterdam: the original plan, a Seq Scan on parameterinfo with Rows Removed by Filter: 13029 and an execution time of 7.337 ms.
Look for three things:
Seq Scan: every row is read.Rows Removed by Filter: 13000: all 13,000 rows were read and none were returned. That’s the most useful line in the plan.Buffers: shared hit=161: 161 pages were touched for a result of zero rows. Buffer counts don’t depend on how warm the cache or how fast the laptop is, so they’re a better before/after number than milliseconds.
EXPLAIN ANALYZE really runs the statement. For an UPDATE or DELETE, wrap it in BEGIN; ... ROLLBACK;. Since PostgreSQL 18, ANALYZE turns BUFFERS on automatically. On 17 and older you have to ask for it.
Step 3: rewrite OR as UNION, if you’re allowed to
If you can change the SQL, splitting the OR into a UNION makes each branch easier to read and to index:
SELECT id, name, value FROM parameterinfo
 WHERE name = 'Module7.Setting7' AND (flags & 32) > 0
UNION
SELECT id, name, value FROM parameterinfo
 WHERE lower(name) = lower('Module7.Setting7') AND (flags & 128) > 0;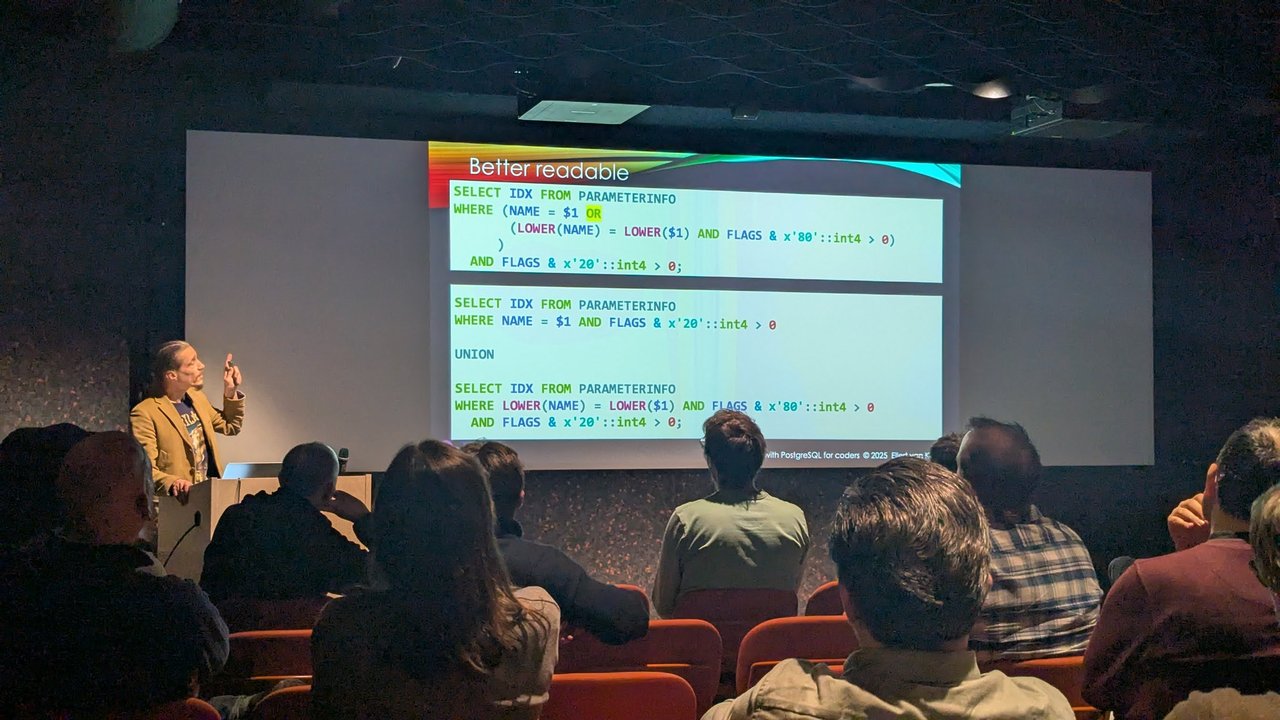
A slide from the Database Academy talk at the PostgreSQL user meetup in Amsterdam: the original OR query next to the same query split into two SELECTs joined by UNION.
Without indexes it doesn’t help. My plan showed two sequential scans and 322 buffers, twice the original. It just makes it obvious which index each branch needs. Once those indexes existed, each branch used its own index scan. For the rest of this post, assume the SQL is fixed and only the schema can change.
Step 4: expression indexes
A plain index on name can’t help lower(name) = .... You need an index on the expression itself:
CREATE INDEX CONCURRENTLY parameterinfo_name_idx  ON parameterinfo (name);
CREATE INDEX CONCURRENTLY parameterinfo_lower_idx ON parameterinfo (lower(name));
ANALYZE parameterinfo;
The parentheses around the expression can be left out only when it’s a single function call, as with lower(name). Here’s the new plan:
 Bitmap Heap Scan on parameterinfo  (cost=8.59..15.97 rows=1 width=62) (actual time=0.017..0.018 rows=0 loops=1)
   Recheck Cond: ((name = 'Module7.Setting7'::text) OR (lower(name) = 'module7.setting7'::text))
   Filter: (((name = 'Module7.Setting7'::text) AND ((flags & 32) > 0)) OR ((lower(name) = 'module7.setting7'::text) AND ((flags & 128) > 0)))
   Rows Removed by Filter: 1
   Buffers: shared hit=5
   ->  BitmapOr  (cost=8.59..8.59 rows=2 width=0)
         ->  Bitmap Index Scan on parameterinfo_name_idx
               Index Cond: (name = 'Module7.Setting7'::text)
         ->  Bitmap Index Scan on parameterinfo_lower_idx
               Index Cond: (lower(name) = 'module7.setting7'::text)
 Execution Time: 0.029 ms
That’s 5 buffers instead of 161. This is how the planner handles an OR across different indexes. It scans each index, builds an in-memory bitmap of matching row locations, ORs the bitmaps together, and then reads the table in physical order. The flag checks still run as a Filter on the rows it fetches. Because the rows come back in physical order, any ordering the indexes had is lost, so an ORDER BY needs a separate sort.
Step 5: partial indexes
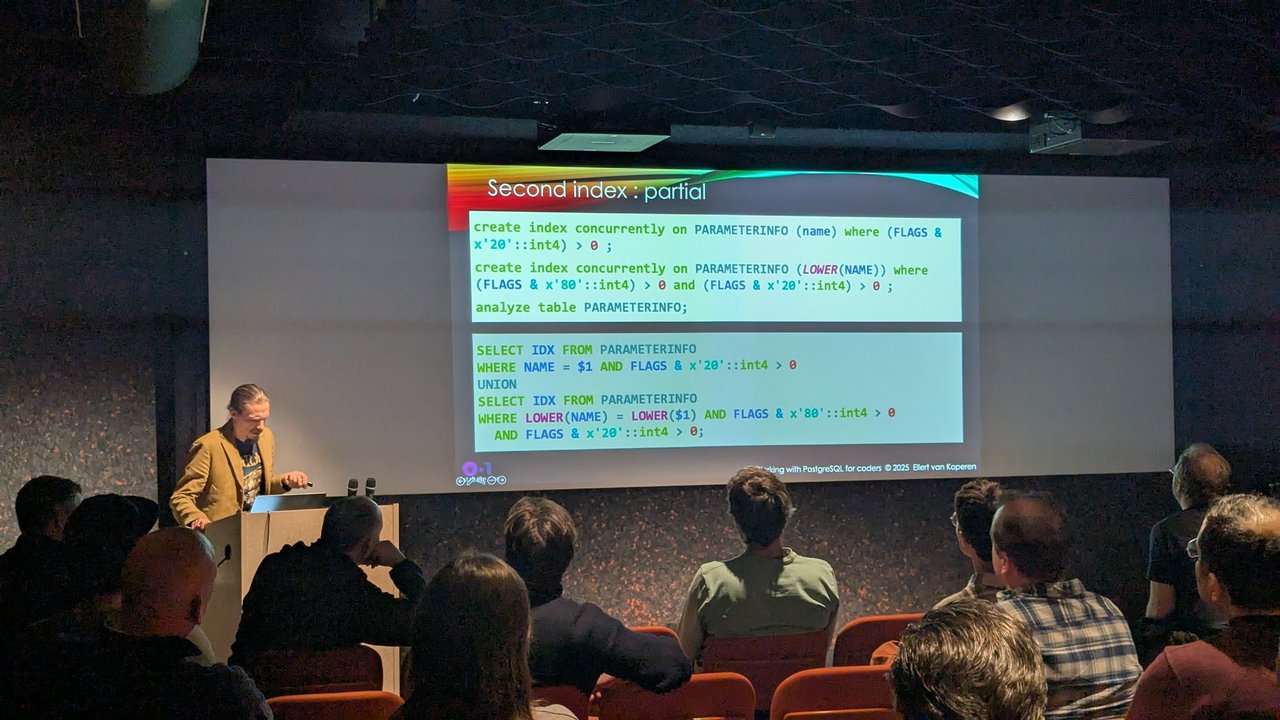
A slide from the Database Academy talk at the PostgreSQL user meetup in Amsterdam: the second approach, partial indexes on name and LOWER(NAME) whose WHERE clauses match the FLAGS bit checks.
The query only cares about rows with bit 0x20 set (for the name branch) or bit 0x80 set (for the lower(name) branch). A partial index stores only those rows:
DROP INDEX CONCURRENTLY parameterinfo_name_idx;
DROP INDEX CONCURRENTLY parameterinfo_lower_idx;

CREATE INDEX CONCURRENTLY parameterinfo_name_f20_idx
    ON parameterinfo (name)        WHERE (flags & 32) > 0;
CREATE INDEX CONCURRENTLY parameterinfo_lower_f80_idx
    ON parameterinfo (lower(name)) WHERE (flags & 128) > 0;
ANALYZE parameterinfo;
Bitmap Heap Scan on parameterinfo (actual time=0.024..0.024 rows=0 loops=1)
Recheck Cond: (((name = 'Module7.Setting7'::text) AND ((flags & 32) > 0)) OR ((lower(name) = 'module7.setting7'::text) AND ((flags & 128) > 0)))
Buffers: shared read=4
-> BitmapOr
-> Bitmap Index Scan on parameterinfo_name_f20_idx
Index Cond: (name = 'Module7.Setting7'::text)
-> Bitmap Index Scan on parameterinfo_lower_f80_idx
Index Cond: (lower(name) = 'module7.setting7'::text)The Filter line is gone, because the index predicates already cover the flag checks. Each partial index came to 72 kB on my table. A full B-tree on name was 536 kB.
The rule from the docs: the planner uses a partial index only if it can prove that the query’s WHERE clause implies the index predicate. Its theorem proving is limited, so in practice the predicate has to match a piece of the query. That matching happens at plan time, which matters for prepared statements:
SET plan_cache_mode = force_generic_plan;

-- flag constants are in the SQL: the generic plan still uses both partial indexes
PREPARE p1(text) AS
  SELECT id FROM parameterinfo
  WHERE (name = $1 AND (flags & 32) > 0) OR (lower(name) = lower($1) AND (flags & 128) > 0);
EXPLAIN (COSTS OFF) EXECUTE p1('Module7.Setting7');   -- BitmapOr over both partial indexes

-- the flag is a parameter: the planner can't prove the predicate
PREPARE p2(text, int) AS
  SELECT id FROM parameterinfo WHERE name = $1 AND (flags & $2) > 0;
EXPLAIN (COSTS OFF) EXECUTE p2('Module7.Setting7', 32); -- Seq Scan
Partial indexes work well when the query’s fixed conditions are literals in the SQL text and the changing value is the indexed column.
Step 6: hash indexes
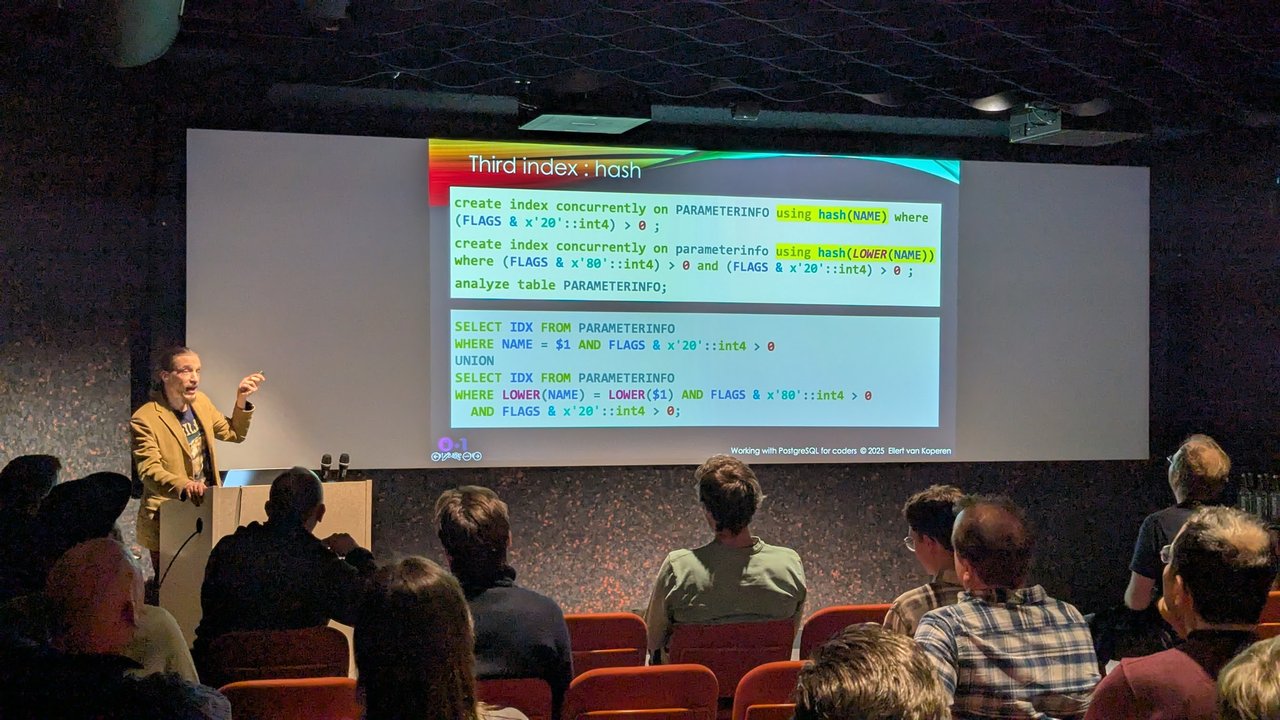
A slide from the Database Academy talk at the PostgreSQL user meetup in Amsterdam: the third approach, partial hash indexes on NAME and LOWER(NAME).
Hash indexes store a 32-bit hash of the value and support only =. Since PostgreSQL 10 they’re WAL-logged, which makes them crash-safe and replicated. On older versions they weren’t, and that’s where their bad reputation comes from. They can be partial, they can index an expression, and they can be part of a BitmapOr:
CREATE INDEX CONCURRENTLY parameterinfo_name_hash
    ON parameterinfo USING hash (name)        WHERE (flags & 32) > 0;
CREATE INDEX CONCURRENTLY parameterinfo_lower_hash
    ON parameterinfo USING hash (lower(name)) WHERE (flags & 128) > 0;
With the B-tree versions dropped, the plan has the same shape: a BitmapOr over parameterinfo_name_hash and parameterinfo_lower_hash. Then I tested the limits:
EXPLAIN SELECT id FROM parameterinfo WHERE lower(name) LIKE 'module7.%' AND (flags & 128) > 0; -- Seq Scan
EXPLAIN SELECT id FROM parameterinfo WHERE lower(name) > 'module7'   AND (flags & 128) > 0; -- Seq Scan
CREATE UNIQUE INDEX ON parameterinfo USING hash (name);
-- ERROR:  access method "hash" does not support unique indexes
CREATE INDEX ON parameterinfo USING hash (name, flags);
-- ERROR:  access method "hash" does not support multicolumn indexes
Each hash index entry holds only the 4-byte hash, so every hash scan is lossy, and that’s why you always see a Recheck Cond. The docs say hash indexes can be much smaller than B-trees for long values such as URLs or UUIDs, and work best for equality lookups on large tables with unique or nearly unique values. On my small table they were not smaller. The partial hash indexes were 528 kB each, against 72 kB for the partial B-trees. A hash index also can’t shrink or lose buckets without a REINDEX.
My take: start with a B-tree. Try a hash index only for long keys looked up by equality, and measure the size with pg_relation_size before you commit to it.
Step 7: check that the indexes are used
SELECT indexrelname,
       idx_scan,
       last_idx_scan,           -- PostgreSQL 16+; remove on older versions
       idx_tup_read,
       idx_tup_fetch,
       pg_size_pretty(pg_relation_size(indexrelid)) AS size
FROM pg_stat_user_indexes
WHERE relname = 'parameterinfo'
ORDER BY idx_scan;
In my run, each index in the BitmapOr went up by one in idx_scan. The docs explain that bitmap scans increase idx_tup_read on each index they use and idx_tup_fetch on the table, but not idx_tup_fetch on the index. So for bitmap-heavy plans, use idx_scan and idx_tup_read. Any index whose idx_scan stays at 0 over a full business cycle is a candidate for removal. Then go back to pg_stat_statements and compare the new mean_exec_time and shared_blks_hit for the same queryid.
What indexes cost
- Write amplification. Every index has to be updated on each insert and on every update that isn’t HOT. A HOT update happens only when no indexed column changes. Index
nameand every rename now writes index entries. Expression indexes also recompute the expression on each insert and non-HOT update. The expression isn’t recomputed when you search, because the result is stored in the index. CREATE INDEX CONCURRENTLY. A plainCREATE INDEXblocks writes, but not reads, until it finishes.CONCURRENTLYdoesn’t block writes. In exchange it scans the table twice, waits for existing transactions that could use the index, and can’t run inside a transaction block (ERROR: CREATE INDEX CONCURRENTLY cannot run inside a transaction block). If it fails, it leaves an invalid index behind that still adds write cost. Find it and drop it:
SELECT indexrelid::regclass FROM pg_index WHERE NOT indisvalid;
DROP INDEX CONCURRENTLY <index_name>; -- then retry, or use REINDEX INDEX CONCURRENTLY- Don’t use partial indexes as fake partitions. The docs warn against many non-overlapping partial indexes such as
WHERE category = 1,= 2and so on. Use one multicolumn index, or real partitioning.
Pitfalls I hit while testing
- The expression must match. With an index on
lower(name),upper(name) = ...andname ILIKE ...both fell back to aSeq Scan. Anything you use in an index expression or predicate must beIMMUTABLE. - The predicate must match too. The query used
(flags & 32) <> 0and the index said> 0. That’s logically the same for one bit, but the planner didn’t prove it and did aSeq Scan. Writing the constant asx'20'::int4(which is 32) did match in my test. Always check withEXPLAINand don’t assume. - Collation. An index supports one collation per column. On my database (default collation
C), addingCOLLATE "en_US"to the comparison caused aSeq Scan. So did an explicitCOLLATE "C", because that’s a different collation from the column’s default. If the application addsCOLLATE, build the index with the same one:CREATE INDEX ... (name COLLATE "en_US"). - Statistics. A new expression index has no statistics until
ANALYZE(or autovacuum) runs. BeforeANALYZE, my plan estimatedrows=65forlower(name) = ..., which is a generic default. AfterANALYZEit estimatedrows=1. RunANALYZE tableright after you create the index.
Summary
To fix a slow PostgreSQL query you can’t rewrite: rank queries by total time in pg_stat_statements, find the Seq Scan and the large Rows Removed by Filter in EXPLAIN (ANALYZE, BUFFERS), and add an index that matches the query exactly, with the same expression, predicate and collation. Then run ANALYZE and confirm the result in pg_stat_user_indexes and pg_stat_statements. If you need to see what’s slow right now rather than over time, read the PostgreSQL monitoring gap.