etcd monitoring is the cheapest insurance you can buy for a Kubernetes control plane. When etcd is slow, everything that talks to the API server is slow, and by the time kubectl starts timing out, the metrics have often been warning you for a while. This guide covers the Prometheus metrics that matter, a PromQL query for each, alert rules that follow the upstream etcd mixin, a dashboard layout, and what to do when each alert fires.
At Red Hat OpenShift Commons Gathering Amsterdam 2026, one session put an “etcd Optimizations” slide and an “etcd Dashboards” slide on screen, with a list of etcd metric names to watch in Prometheus and panels for RPC rate, disk sync duration, DB size and leader elections per day. That list is a good starting point, so I went back to the etcd docs and source and turned it into a full monitoring setup.

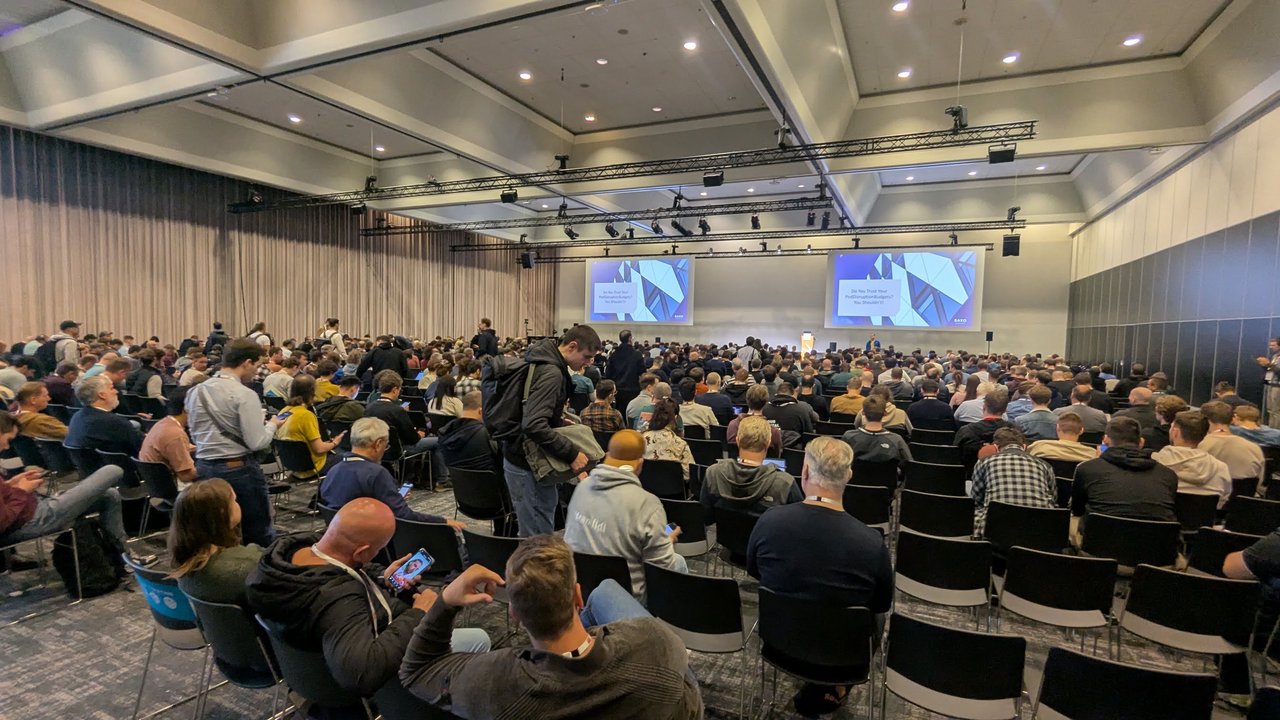
The main hall at OpenShift Commons Gathering Amsterdam 2026, where the sessions ran all morning.
Versions: metric names and guidance are checked against the etcd v3.6 metrics docs, the v3.6 monitoring guide, the v3.6 FAQ and the alerts in contrib/mixin on etcd’s main branch. I scraped live endpoints on a temporary three-member kind cluster (Kubernetes 1.37, etcd 3.7.0) to confirm every metric name below exists, and validated the rules with promtool from Prometheus 3.15.
This post is about metrics and alerts. For etcdctl commands see my etcd cheat sheet, and for backups and scheduled defrag see etcd backup and maintenance for production Kubernetes.
Where etcd metrics come from
Every etcd member serves /metrics on its client port, and optionally on the URLs given by --listen-metrics-urls. kubeadm (and therefore kind) sets this flag on the etcd static pod:
kubectl -n kube-system get pod -l component=etcd \
  -o jsonpath='{.items[0].spec.containers[0].command}' | tr ',' '\n' | grep metrics
# "--listen-metrics-urls=http://127.0.0.1:2381"
That is plain HTTP, no client certificate needed, but bound to localhost. You can check it from the control plane node:
curl -s http://127.0.0.1:2381/metrics | grep -E '^etcd_server_(has_leader|quota_backend_bytes)'
# etcd_server_has_leader 1
# etcd_server_quota_backend_bytes 2.147483648e+09
The 2 GiB quota is etcd’s default when --quota-backend-bytes isn’t set. Keep that number in mind for the quota alerts later.
To let Prometheus scrape it from inside the cluster, bind the metrics listener to the node address. With kubeadm’s v1beta4 config, etcd.local.extraArgs is a list of name/value pairs:
apiVersion: kubeadm.k8s.io/v1beta4
kind: ClusterConfiguration
etcd:
  local:
    extraArgs:
      - name: listen-metrics-urls
        value: http://0.0.0.0:2381
On an existing cluster, edit /etc/kubernetes/manifests/etcd.yaml on each control plane node instead; the kubelet restarts the pod. Port 2381 then exposes metrics and health without TLS, so restrict it to your monitoring network with a firewall or security group.
If you run kube-prometheus-stack, its kubeEtcd section already creates a headless Service on port 2381 that selects component: etcd pods, plus a ServiceMonitor. The resulting job label is kube-etcd, which matches the job=~".*etcd.*" selector used by the etcd mixin. The chart also ships the etcd alert group by default (defaultRules.rules.etcd: true), so check what you already have before adding the rules below.
Disk latency: the first thing to look at
etcd persists Raft log entries to its write-ahead log (WAL) with fsync before applying them, and periodically commits an incremental snapshot of recent changes to its bbolt backend. Two histograms cover both:
etcd_disk_wal_fsync_duration_seconds: latency of fsync called by the WALetcd_disk_backend_commit_duration_seconds: latency of backend commits
# p99 WAL fsync per member
histogram_quantile(0.99,
  sum by (instance, le) (rate(etcd_disk_wal_fsync_duration_seconds_bucket{job=~".*etcd.*"}[5m])))

# p99 backend commit per member
histogram_quantile(0.99,
  sum by (instance, le) (rate(etcd_disk_backend_commit_duration_seconds_bucket{job=~".*etcd.*"}[5m])))
The etcd FAQ gives the targets: p99 WAL fsync below 10ms and p99 backend commit below 25ms. The mixin alerts fire much later (fsync p99 above 0.5s warning, above 1s critical; commit p99 above 0.25s), because they are meant to catch a disk that is actively hurting the cluster. The FAQ also explains why this matters so much: disk latency is part of leader liveness, so a leader stuck on a slow fsync can’t commit proposals and a new election follows.
Leadership
# 1 if this member sees a leader, 0 if not
etcd_server_has_leader{job=~".*etcd.*"}

# Which member is the leader right now
etcd_server_is_leader{job=~".*etcd.*"} == 1

# Leader changes per day (the "total leader elections per day" panel)
changes(etcd_server_leader_changes_seen_total{job=~".*etcd.*"}[1d])
A member with etcd_server_has_leader == 0 is unavailable. If every member reports 0, the whole cluster is. Leader changes are normal during rolling restarts and upgrades; outside of those, frequent elections point to slow disks, network latency or CPU starvation. If you already see the leader changed error in logs, my etcd leader changed troubleshooting post covers the diagnosis.
Proposals
Every write goes through Raft as a proposal. Four series describe the pipeline:
# Failed proposals per second (leader elections or quorum loss)
rate(etcd_server_proposals_failed_total{job=~".*etcd.*"}[5m])

# Queue depth: rising means high load or a member that can't commit
etcd_server_proposals_pending{job=~".*etcd.*"}

# Apply lag: committed but not yet applied
etcd_server_proposals_committed_total{job=~".*etcd.*"}
  - etcd_server_proposals_applied_total{job=~".*etcd.*"}
The docs say the committed-minus-applied gap should stay small, within a few thousand even under high load. A gap that keeps growing means the member is overloaded, often by expensive range queries or large transactions.
Database size, quota and fragmentation
Three gauges tell you how close you are to the wall:
etcd_mvcc_db_total_size_in_bytes: the physical size of the backend file, including free pagesetcd_mvcc_db_total_size_in_use_in_bytes: the logical size actually used after compactionetcd_server_quota_backend_bytes: the configured quota
# Percentage of quota used (per member)
100 * etcd_mvcc_db_total_size_in_bytes{job=~".*etcd.*"}
    / etcd_server_quota_backend_bytes{job=~".*etcd.*"}

# Fraction of the file that is live data
etcd_mvcc_db_total_size_in_use_in_bytes{job=~".*etcd.*"}
  / etcd_mvcc_db_total_size_in_bytes{job=~".*etcd.*"}
The quota is checked against the total size, not the in-use size. When a member exceeds it, etcd raises a cluster-wide NOSPACE alarm and only accepts reads and deletes, which for Kubernetes means no new or updated objects.
When to defragment: compaction drops old revisions, but the freed pages stay inside the file. Defragmentation gives them back to the filesystem. The mixin’s rule of thumb is a good trigger: defragment when in-use is below 50% of total and in-use is above 100 MiB. Below that size it isn’t worth the pause.
gRPC requests
The API server talks to etcd over gRPC, and etcd exports the standard go-grpc-prometheus counters:
# Unary RPC rate (the "RPC rate" panel)
sum(rate(grpc_server_started_total{job=~".*etcd.*", grpc_type="unary"}[5m]))

# Rate by method: Range, Txn, Put, LeaseGrant...
sum by (grpc_method) (rate(grpc_server_started_total{job=~".*etcd.*", grpc_type="unary"}[5m]))

# Failed RPC ratio, using the same error codes as the mixin
sum(rate(grpc_server_handled_total{job=~".*etcd.*", grpc_type="unary",
  grpc_code=~"Unknown|FailedPrecondition|ResourceExhausted|Internal|Unavailable|DataLoss|DeadlineExceeded"}[5m]))
/
sum(rate(grpc_server_handled_total{job=~".*etcd.*", grpc_type="unary"}[5m]))
Latency needs a flag. The mixin’s etcdGRPCRequestsSlow alert uses grpc_server_handling_seconds_bucket, and that histogram only exists when etcd runs with --metrics=extensive (the default is basic). On my kind cluster the series was absent until I added - --metrics=extensive to one member’s static pod manifest. Either add the flag on every member or drop that alert, otherwise it silently never fires.
Network peer round-trip time
# p99 RTT from each member to each peer (label "To" is the peer ID)
histogram_quantile(0.99,
  rate(etcd_network_peer_round_trip_time_seconds_bucket{job=~".*etcd.*"}[5m]))

# Send failures to peers
rate(etcd_network_peer_sent_failures_total{job=~".*etcd.*"}[5m])
The RTT histogram only appears once a member has peers, so a single-node cluster won’t show it, and the failure counter only gets a series for a peer after the first failed send. The etcd tuning guide says the heartbeat interval should be around the RTT between members (100ms by default) and the election timeout at least 10 times the RTT. If p99 RTT approaches the heartbeat interval, the defaults no longer fit your network and you should expect missed heartbeats.
PrometheusRule alerts
The rules below are the upstream mixin alerts with the selector and instance labels filled in for Kubernetes (instance, pod aggregated away, as the mixin’s config comments suggest), plus three early-warning rules of my own at the FAQ thresholds. Trimmed for length: etcdMembersDown, etcdInsufficientMembers and the critical gRPC variants are in the mixin.
apiVersion: monitoring.coreos.com/v1
kind: PrometheusRule
metadata:
  name: etcd-alerts
  namespace: monitoring
  labels:
    release: kube-prometheus-stack   # match your Prometheus ruleSelector
spec:
  groups:
    - name: etcd
      rules:
        - alert: etcdNoLeader
          expr: etcd_server_has_leader{job=~".*etcd.*"} == 0
          for: 1m
          labels: {severity: critical}
        - alert: etcdHighNumberOfLeaderChanges
          expr: |
            increase((max without (instance, pod) (etcd_server_leader_changes_seen_total{job=~".*etcd.*"})
              or 0*absent(etcd_server_leader_changes_seen_total{job=~".*etcd.*"}))[15m:1m]) >= 4
          for: 5m
          labels: {severity: warning}
        - alert: etcdHighNumberOfFailedProposals
          expr: rate(etcd_server_proposals_failed_total{job=~".*etcd.*"}[15m]) > 5
          for: 15m
          labels: {severity: warning}
        - alert: etcdHighFsyncDurations
          expr: histogram_quantile(0.99, rate(etcd_disk_wal_fsync_duration_seconds_bucket{job=~".*etcd.*"}[5m])) > 0.5
          for: 10m
          labels: {severity: warning}
        - alert: etcdHighFsyncDurations
          expr: histogram_quantile(0.99, rate(etcd_disk_wal_fsync_duration_seconds_bucket{job=~".*etcd.*"}[5m])) > 1
          for: 10m
          labels: {severity: critical}
        - alert: etcdHighCommitDurations
          expr: histogram_quantile(0.99, rate(etcd_disk_backend_commit_duration_seconds_bucket{job=~".*etcd.*"}[5m])) > 0.25
          for: 10m
          labels: {severity: warning}
        - alert: etcdMemberCommunicationSlow
          expr: histogram_quantile(0.99, rate(etcd_network_peer_round_trip_time_seconds_bucket{job=~".*etcd.*"}[5m])) > 0.15
          for: 10m
          labels: {severity: warning}
        - alert: etcdHighNumberOfFailedGRPCRequests
          expr: |
            100 * sum(rate(grpc_server_handled_total{job=~".*etcd.*", grpc_code=~"Unknown|FailedPrecondition|ResourceExhausted|Internal|Unavailable|DataLoss|DeadlineExceeded"}[5m])) without (grpc_type, grpc_code)
              / sum(rate(grpc_server_handled_total{job=~".*etcd.*"}[5m])) without (grpc_type, grpc_code) > 1
          for: 10m
          labels: {severity: warning}
        - alert: etcdDatabaseQuotaLowSpace
          expr: |
            (last_over_time(etcd_mvcc_db_total_size_in_bytes{job=~".*etcd.*"}[5m])
              / last_over_time(etcd_server_quota_backend_bytes{job=~".*etcd.*"}[5m])) * 100 > 95
          for: 10m
          labels: {severity: critical}
        - alert: etcdExcessiveDatabaseGrowth
          expr: |
            predict_linear(etcd_mvcc_db_total_size_in_bytes{job=~".*etcd.*"}[4h], 4*60*60)
              > etcd_server_quota_backend_bytes{job=~".*etcd.*"}
          for: 10m
          labels: {severity: warning}
        - alert: etcdDatabaseHighFragmentationRatio
          expr: |
            (last_over_time(etcd_mvcc_db_total_size_in_use_in_bytes{job=~".*etcd.*"}[5m])
              / last_over_time(etcd_mvcc_db_total_size_in_bytes{job=~".*etcd.*"}[5m])) < 0.5
            and etcd_mvcc_db_total_size_in_use_in_bytes{job=~".*etcd.*"} > 104857600
          for: 10m
          labels: {severity: warning}
    - name: etcd-early-warning
      rules:
        - alert: EtcdWalFsyncAboveGuidance
          expr: histogram_quantile(0.99, sum by (instance, le) (rate(etcd_disk_wal_fsync_duration_seconds_bucket{job=~".*etcd.*"}[5m]))) > 0.01
          for: 30m
          labels: {severity: info}
        - alert: EtcdBackendCommitAboveGuidance
          expr: histogram_quantile(0.99, sum by (instance, le) (rate(etcd_disk_backend_commit_duration_seconds_bucket{job=~".*etcd.*"}[5m]))) > 0.025
          for: 30m
          labels: {severity: info}
        - alert: EtcdDatabaseQuota80Percent
          expr: etcd_mvcc_db_total_size_in_bytes{job=~".*etcd.*"} / etcd_server_quota_backend_bytes{job=~".*etcd.*"} > 0.8
          for: 15m
          labels: {severity: warning}
I left out annotations to keep the block readable; copy summary and description from the mixin, and add a runbook_url pointing at the remediation section below. Validate before applying:
# Extract spec into a plain rules file, then:
promtool check rules etcd-rules.yaml
#   SUCCESS: 14 rules found
After loading them, check that Prometheus evaluates every rule without errors (health should be ok for all of them):
curl -s http://localhost:9090/api/v1/rules \
  | jq -r '.data.groups[].rules[] | "\(.name) \(.health) \(.state)"'
When I loaded these rules against the three-member kind cluster, all 14 were healthy, and within minutes EtcdWalFsyncAboveGuidance, EtcdBackendCommitAboveGuidance and etcdMemberCommunicationSlow went to pending: WAL fsync p99 was around 96ms on a laptop disk shared by several clusters. That is the expected result, and a good reminder not to judge etcd hardware on a laptop.
My take: the mixin thresholds are tuned to avoid pages, and that’s right for a pager. The info rules at 10ms and 25ms are what I route to a ticket queue, because a disk that sits above the FAQ guidance for half an hour is the one that pages you next month.
A dashboard layout that answers questions in order
The upstream mixin ships a Grafana dashboard (contrib/mixin/dashboards), and its panel names (RPC rate, DB size, total leader elections per day) match what was on the slide in Amsterdam. I lay mine out top to bottom in the order I’d debug:
| Row | Panels | Query basis |
|---|---|---|
| Health | Members with a leader, current leader, leader elections per day | etcd_server_has_leader, etcd_server_is_leader, changes(...leader_changes_seen_total[1d]) |
| Disk | WAL fsync p99, backend commit p99 (with 10ms and 25ms threshold lines) | the two disk histograms |
| Database | Total size, in-use size and quota on one graph; in-use/total ratio | the three DB gauges |
| Traffic | RPC rate by method, failed RPC ratio, active watch streams | grpc_server_started_total, grpc_server_handled_total |
| Raft | Proposals pending, failed rate, committed minus applied | the proposal series |
| Network | Peer RTT p99 per peer, peer send failures | etcd_network_peer_* |
Putting total, in-use and quota on one graph is the single most useful panel: you see fragmentation as the gap between the first two, and the quota as the ceiling.
What to do when each alert fires
All commands run etcdctl inside a kubeadm etcd pod, which already has the client certificates mounted. A small shell function keeps them short and always talks to the member in the pod you name:
etcdctl_k() {
  local pod="$1"; shift
  kubectl -n kube-system exec "$pod" -- etcdctl \
    --endpoints=https://127.0.0.1:2379 \
    --cacert=/etc/kubernetes/pki/etcd/ca.crt \
    --cert=/etc/kubernetes/pki/etcd/server.crt \
    --key=/etc/kubernetes/pki/etcd/server.key "$@"
}

ETCD_PODS=$(kubectl -n kube-system get pod -l component=etcd -o jsonpath='{.items[*].metadata.name}')
FIRST_POD=${ETCD_PODS%% *}

etcdctl_k "$FIRST_POD" endpoint status --cluster -w table
With etcdctl 3.7 the table includes DB SIZE, IN USE, PERCENTAGE NOT IN USE, QUOTA and IS LEADER columns, which is the same picture as the database panel.
Fsync or commit durations high. Almost always the disk. Check for noisy neighbours on the same volume (container images, logs), move etcd to a dedicated SSD or a provisioned-IOPS volume, and benchmark with fio as the etcd hardware guide suggests. The tuning guide also shows raising etcd’s I/O priority with ionice -c2 -n0 -p $(pgrep etcd).
No leader or frequent leader changes. Look at the disk panels first, then peer RTT, then CPU throttling on the control plane nodes. If members are down or quorum is lost, follow fixing an unavailable etcd cluster.
Failed proposals. Usually a symptom of the above: proposals fail during elections or without quorum. Fix leadership and they stop.
High fragmentation. Defragment one member at a time. Defrag blocks reads and writes on that member while it rebuilds, and it only applies to the member you target:
for pod in $ETCD_PODS; do
  etcdctl_k "$pod" defrag
done
# Finished defragmenting etcd member[https://127.0.0.1:2379]. took ...
My habit is to do the leader (IS LEADER = true in the status table) last, so if a defrag misbehaves it happens on a follower first.
Quota low or growing fast. First find out what is growing: Events, a CRD with huge objects, or a controller writing in a loop. In Kubernetes you rarely need manual compaction, because kube-apiserver already requests one every 5 minutes (--etcd-compaction-interval, default 5m). Defrag reclaims the space. If the NOSPACE alarm has already fired, the recovery from the etcd maintenance guide is:
etcdctl_k "$FIRST_POD" alarm list
# memberID:... alarm:NOSPACE
# compact (only if apiserver compaction is disabled or stuck), then:
for pod in $ETCD_PODS; do etcdctl_k "$pod" defrag; done
etcdctl_k "$FIRST_POD" alarm disarm
If the data is legitimately bigger, raise --quota-backend-bytes. The FAQ calls 8GB a suggested maximum for normal environments and etcd warns at startup above that, and the node needs at least as much RAM as the quota.
OpenShift notes
According to the session, OpenShift’s etcd Operator automates defragmentation and history compaction and restores quorum if a member becomes unhealthy, so the fragmentation runbook above is mostly handled for you. The database size defaults to 8GB and can be raised to 32GB as a Technology Preview, and a hardware speed tolerance setting (Standard or Slower) makes the cluster more tolerant of latency. The metric names are the same, so the PromQL and the dashboard layout carry over.

The OpenShift Commons stage at Strandzuid, with the event logo on the screens.