The Elastic Agent Builder MCP server turns the tools you define in Kibana into Model Context Protocol tools that any MCP client can list and call. Most tutorials show it from Claude Desktop or VS Code, with an LLM choosing what to call. I wanted to see the plumbing without the LLM: which tools work on their own, what an Elastic Workflows YAML file looks like when it runs as a tool, which privileges the API key needs, and what the errors look like. So I ran Elasticsearch and Kibana 9.5.4 on my laptop and called everything from a small Python MCP client and the MCP Inspector CLI.
This came out of the AI Native Netherlands meetup at Elastic in Amsterdam on 15 January 2026. Hans Heerooms, Solutions Architect at Elastic, demoed a shop assistant with a parameterised ES|QL tool, registered a YAML workflow as a tool, and finished by calling that tool from VS Code through MCP with an API key. Back then his slide still said “Preview: Workflows in Elastic as tool”. Everything below is my own test on made-up data, not a copy of his demo.
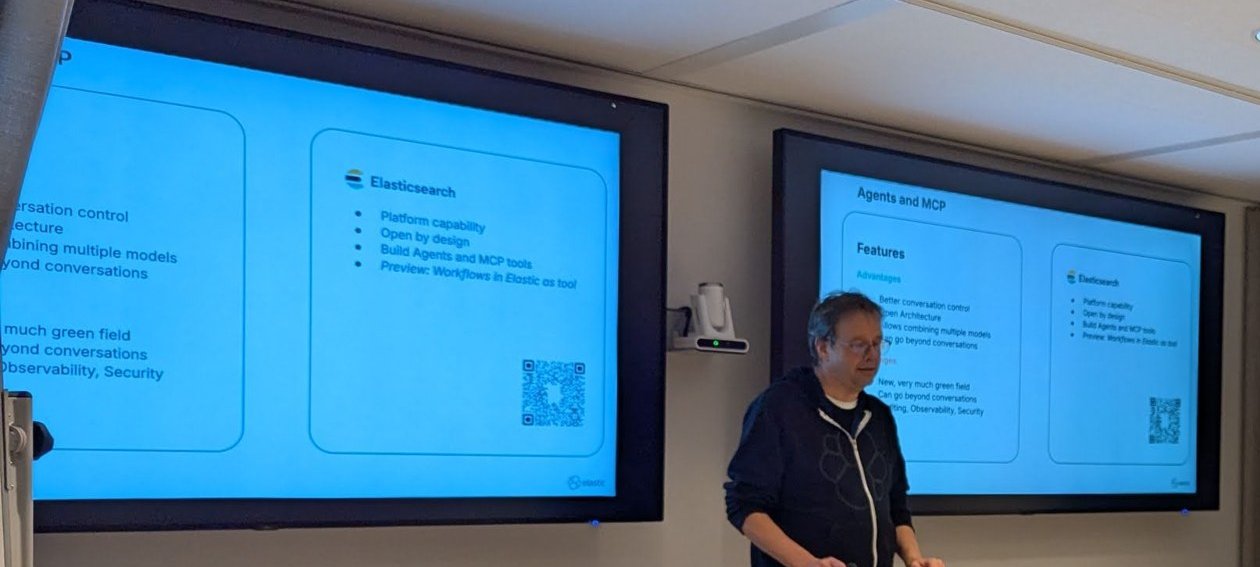
The slide from the talk that marked workflows-as-tools as a preview.
Versions and licensing
What I ran. Elasticsearch and Kibana 9.5.4 (the newest released 9.x on 3 October 2026) on Docker Desktop 4.53.0, Apple M1 Pro, macOS 26.6.2. The client side was Python 3.13.3 with the official MCP Python SDK 2.3.0 and @modelcontextprotocol/inspector 2.9.0.
Which version you need. Elastic’s docs say the Agent Builder MCP server has been generally available since 9.3 (preview in 9.2) at {KIBANA_URL}/api/agent_builder/mcp, or {KIBANA_URL}/s/{SPACE_NAME}/api/agent_builder/mcp for a non-default space. Workflows are GA since 9.4 and were a preview in 9.3. Note that workflow tools (a workflow exposed as an Agent Builder tool) are still labelled preview on the Elastic Stack. On 9.5.4 I did not have to flip any advanced setting for the Workflows API to work.
Licence. On the self-managed subscriptions page, Agent Builder (including “External integration - API/MCP/A2A”) and Elastic Workflows are ticked only in the Enterprise column, not Basic or Platinum. To test locally you therefore need the 30-day trial. Elastic’s start-local script sets that up for you, and so does my compose file below with xpack.license.self_generated.type=trial. After 30 days the cluster drops to Basic and these features go away.
Run Elasticsearch and Kibana locally
The quickest route is curl -fsSL https://elastic.co/start-local | sh. I wrote my own compose file with the same essentials so I could cap the heap at 1 GB and the memory at 2 GB per container.
name: elastic-deepdive
services:
  elasticsearch:
    image: docker.elastic.co/elasticsearch/elasticsearch:${ES_VERSION}   # 9.5.4
    environment:
      - discovery.type=single-node
      - ELASTIC_PASSWORD=${ELASTIC_PASSWORD}
      - xpack.security.enabled=true
      - xpack.security.http.ssl.enabled=false          # local only
      - xpack.license.self_generated.type=trial        # Enterprise features for 30 days
      - ES_JAVA_OPTS=-Xms1g -Xmx1g
    mem_limit: 2g
    ports: ["127.0.0.1:9200:9200"]
    volumes: ["esdata:/usr/share/elasticsearch/data"]
    healthcheck:
      test: ["CMD-SHELL", "curl -sf -u elastic:${ELASTIC_PASSWORD} http://localhost:9200/_cluster/health"]
      interval: 10s
      retries: 30
  kibana_setup:          # one-shot: set the kibana_system password
    image: docker.elastic.co/elasticsearch/elasticsearch:${ES_VERSION}
    depends_on: { elasticsearch: { condition: service_healthy } }
    command: >
      bash -c 'until curl -s -u "elastic:${ELASTIC_PASSWORD}" -X POST http://elasticsearch:9200/_security/user/kibana_system/_password
      -H "Content-Type: application/json" -d "{\"password\":\"${KIBANA_SYSTEM_PASSWORD}\"}" | grep -q "^{}"; do sleep 2; done'
  kibana:
    image: docker.elastic.co/kibana/kibana:${ES_VERSION}
    depends_on: { kibana_setup: { condition: service_completed_successfully } }
    environment:
      - ELASTICSEARCH_HOSTS=http://elasticsearch:9200
      - ELASTICSEARCH_USERNAME=kibana_system
      - ELASTICSEARCH_PASSWORD=${KIBANA_SYSTEM_PASSWORD}
      - XPACK_ENCRYPTEDSAVEDOBJECTS_ENCRYPTIONKEY=${KIBANA_ENCRYPTION_KEY}
    mem_limit: 2g
    extra_hosts: ["host.docker.internal:host-gateway"]   # lets workflows reach my local webhook
    ports: ["127.0.0.1:5601:5601"]
volumes:
  esdata:
GET /_license came back with "type" : "trial" and an expiry 30 days out. Plan for disk: the two images were 1.97 GB (Elasticsearch) and 2.83 GB (Kibana) as reported by docker images. The Elasticsearch volume reached 1.18 GB with only 250 documents of mine, because the cluster had downloaded .elser_model_2 into .ml-inference-native (559 MB) without me asking for it. On my first attempt I hit my own 1.5 GB free-disk guard and tore everything down. The second run went through with a watchdog script that would run docker compose down -v if free space dropped below the guard.
Load a small e-commerce dataset
A seeded Python script writes 50 customers and 200 orders as _bulk NDJSON: customer ID, product, quantity, total_eur, a status of delivered, shipped, pending or cancelled, and an order_date in the last 60 days. The mappings that matter are keywords for IDs and status:
curl -u "elastic:$ELASTIC_PASSWORD" -X PUT localhost:9200/shop-orders -H 'Content-Type: application/json' -d '{
  "mappings": {"properties": {
    "order_id": {"type": "keyword"}, "customer_id": {"type": "keyword"},
    "product": {"type": "text", "fields": {"raw": {"type": "keyword"}}},
    "quantity": {"type": "integer"}, "total_eur": {"type": "double"},
    "status": {"type": "keyword"}, "order_date": {"type": "date"}}}}'
curl -u "elastic:$ELASTIC_PASSWORD" -X POST "localhost:9200/_bulk?refresh=true" \
  -H 'Content-Type: application/x-ndjson' --data-binary @data/orders.ndjson
I did the same for shop-customers and created an empty shop-followups index (customer ID, counts, a created_at date) for the workflow to write into.
Create the custom tools
Tools are created with POST /api/agent_builder/tools (fields as in the Kibana API examples). I created them as the elastic superuser because this was setup work on a throwaway cluster.
An ES|QL tool with parameters. Parameters are referenced as ?name in the query and declared under params. optional plus defaultValue makes limit optional:
{
  "id": "shop.customer_orders",
  "type": "esql",
  "description": "Return the most recent orders for one customer, newest first.",
  "tags": ["shop"],
  "configuration": {
    "query": "FROM shop-orders | WHERE customer_id == ?customer_id | SORT order_date DESC | KEEP order_id, order_date, product, quantity, total_eur, status | LIMIT ?limit",
    "params": {
      "customer_id": {"type": "string", "description": "Customer ID, for example C007"},
      "limit": {"type": "integer", "description": "Maximum number of orders to return", "optional": true, "defaultValue": 5}
    }
  }
}
An index search tool. It only needs a pattern:
{ "id": "shop.customer_search", "type": "index_search",
  "description": "Search the customer directory (name, country, loyalty tier).",
  "configuration": { "pattern": "shop-customers" } }
curl -u "elastic:$ELASTIC_PASSWORD" -X POST localhost:5601/api/agent_builder/tools \
-H 'kbn-xsrf: true' -H 'Content-Type: application/json' -d @tools/shop-customer-orders.jsonKibana answers with the tool plus a generated JSON Schema. For the ES|QL tool it marked customer_id as required and gave limit a default of 5. For the index search tool the schema is a single required nlQuery string. That is a natural-language query, and it is the first sign that this tool needs a model, as the index search docs say.
An Elastic Workflows YAML file
The workflow checks one customer’s pending orders. If there are any, it indexes a follow-up document and POSTs to a webhook. For the webhook I ran a 20-line Python http.server on my Mac at 127.0.0.1:8787, which Kibana reaches as host.docker.internal on Docker Desktop.
name: pending-order-followup
description: Check a customer's pending orders and, if any, record a follow-up and notify a webhook.
enabled: true
tags: [shop, demo]

triggers:
  - type: manual
    inputs:                       # 9.5: inputs live on the manual trigger
      - name: customer_id
        type: string
        required: true
        description: Customer ID, for example C007

consts:
  webhook_url: http://host.docker.internal:8787/followup

steps:
  - name: pending_orders
    type: elasticsearch.esql.query
    with:
      query: >
        FROM shop-orders
        | WHERE customer_id == ? AND status == "pending"
        | STATS pending = COUNT(*), value_eur = SUM(total_eur)
      params:
        - "{{ inputs.customer_id }}"   # bound as a parameter, not pasted into the query

  - name: has_pending
    type: if
    condition: "steps.pending_orders.output.values.0.0 > 0"
    steps:
      - name: record_followup
        type: elasticsearch.index
        with:
          index: shop-followups
          id: "{{ execution.id }}"
          op_type: create
          document:
            customer_id: "{{ inputs.customer_id }}"
            pending_orders: "${{ steps.pending_orders.output.values[0][0] }}"
            pending_value_eur: "${{ steps.pending_orders.output.values[0][1] }}"
            created_at: "${{ execution.startedAt }}"
            workflow: "{{ workflow.name }}"
      - name: notify_webhook
        type: http
        with:
          url: "{{ consts.webhook_url }}"
          method: POST
          headers:
            Content-Type: application/json
          body:
            customer_id: "{{ inputs.customer_id }}"
            pending_orders: "${{ steps.pending_orders.output.values[0][0] }}"
            followup_id: "{{ execution.id }}"
    else:
      - name: nothing_to_do
        type: console
        with:
          message: "No pending orders for {{ inputs.customer_id }}"
How it works:
elasticsearch.esql.queryreturns the ES|QL response, so the count sits atoutput.values[0][0]. The step’sparamsmust be a plain list of values bound to?placeholders. My first try with a named map (- customer_id: ...) failed validation with0 must be one of: (number | string | boolean | null).iftakes a KQL-style condition over the execution context. The examples bundled in the Kibana source use the same style, such assteps.get_index.output : true.{{ ... }}renders a string.${{ ... }}keeps the value’s type, which is why the counts arrive as numbers.op_type: createis there for least privilege. More on that below.
I created it with POST /api/workflows/workflow and a body of {"id": "pending-order-followup", "yaml": "..."}, then ran it with POST /api/workflows/workflow/pending-order-followup/run and {"inputs": {"customer_id": "C016"}}. The run API returns {"workflowExecutionId": "..."}, and GET /api/workflows/executions/{id} shows each step. The steps took 128 ms (ES|QL), 445 ms (condition), 246 ms (index) and 109 ms (HTTP). My webhook logged:
POST /followup {"customer_id":"C016","pending_orders":2,"followup_id":"b9402d25-e879-41f1-85ec-8c1a08121bdd"}To check YAML without saving it, Kibana has POST /api/workflows/validate. In 9.5.4 it is an internal route. It answered 400 ... exists but is not available with the current configuration until I added x-elastic-internal-origin: kibana and elastic-api-version: 1. Fine for a local lint loop, but don’t build CI on it, because it can change without notice.
Expose the workflow as a tool
A workflow tool has type workflow. The configuration keys workflow_id and wait_for_completion come from the 9.5 Kibana source, and the docs describe the same settings in the UI.
{
  "id": "shop.pending_order_followup",
  "type": "workflow",
  "description": "If the customer has pending orders, record a follow-up and notify the support webhook.",
  "configuration": { "workflow_id": "pending-order-followup", "wait_for_completion": true }
}
Kibana derived the tool schema from the trigger inputs: one required string, customer_id, with my description.
Call the Elastic Agent Builder MCP server without an LLM
The MCP client needs an API key. I started from the read-only example in Elastic’s API key guide, narrowed it to my two indices and set a one-day expiry:
{
  "name": "mcp-shop-readonly",
  "expiration": "1d",
  "role_descriptors": {
    "mcp-shop-readonly": {
      "cluster": ["monitor_inference"],
      "indices": [
        { "names": ["shop-orders", "shop-customers"], "privileges": ["read", "view_index_metadata"] }
      ],
      "applications": [{
        "application": "kibana-.kibana",
        "privileges": ["feature_agentBuilder.read", "feature_actions.read", "feature_workflowsManagement.read"],
        "resources": ["space:default"]
      }]
    }
  }
}
The endpoint speaks Streamable HTTP. A plain curl is enough to see the wire format:
curl -s -X POST http://localhost:5601/api/agent_builder/mcp \
  -H "Authorization: ApiKey $KEY" -H 'Content-Type: application/json' \
  -H 'Accept: application/json, text/event-stream' \
-d '{"jsonrpc":"2.0","id":1,"method":"initialize","params":{"protocolVersion":"2025-06-18","capabilities":{},"clientInfo":{"name":"curl","version":"0"}}}'{"result":{"protocolVersion":"2025-06-18","capabilities":{"tools":{"listChanged":true}},"serverInfo":{"name":"elastic-mcp-server","version":"0.0.1"}},"jsonrpc":"2.0","id":1}No Mcp-Session-Id header came back, and a bare tools/call without initialize also worked. The Python client uses the official SDK. In version 2.x, fields are snake_case (input_schema, is_error). My first run crashed on inputSchema.
import asyncio, json, os
from mcp import Client
from mcp.client.streamable_http import streamable_http_client
from mcp.shared._httpx_utils import create_mcp_http_client

URL = os.environ.get("KIBANA_URL", "http://localhost:5601") + "/api/agent_builder/mcp"
HEADERS = {"Authorization": f"ApiKey {os.environ['ELASTIC_MCP_API_KEY']}"}

async def main():
    async with create_mcp_http_client(headers=HEADERS) as http:
        async with Client(streamable_http_client(URL, http_client=http)) as client:
            tools = await client.list_tools()
            print(len(tools.tools), "tools")
            result = await client.call_tool("shop_customer_orders", {"customer_id": "C016", "limit": 3})
            print(result.is_error, result.content[0].text)

asyncio.run(main())
tools/list returned 69 tools: my three plus the built-in platform, security, observability and streams tools. The ES|QL tool call (formatted, query field shortened):
{"results":[
  {"type":"query","data":{"esql":"FROM shop-orders\n| WHERE customer_id == \"C016\"\n| SORT order_date DESC ..."}},
  {"type":"esql_results","data":{"columns":[{"name":"order_id","type":"keyword"}, "..."],
   "values":[["O0036","2026-09-30T07:00:00.000Z","Rain jacket",1,89,"shipped"],
             ["O0087","2026-09-22T05:00:00.000Z","Rain jacket",1,89,"pending"],
             ["O0172","2026-09-16T13:00:00.000Z","Daypack 20L",3,207,"delivered"]]}}]}
The MCP Inspector CLI gives the same result without writing code:
npx -y @modelcontextprotocol/inspector@latest --cli http://localhost:5601/api/agent_builder/mcp \
  --transport http --header "Authorization: ApiKey $KEY" \
  --method tools/call --tool-name shop_customer_orders --tool-arg customer_id=C034 --tool-arg limit=2
The errors I hit
MCP error -32602: Tool shop.customer_orders not found. MCP tool names replace the dots in tool IDs with underscores. Callshop_customer_orders.- Workflow tool with the read-only key:
Unauthorized to execute workflow 'pending-order-followup'. The 'workflowsManagement' execute and read privileges are required.The fix is the sub-feature privilegefeature_workflowsManagement.workflow_execute, which I found asworkflow_executein the 9.5 Kibana feature definition. - Then:
security_exception: action [indices:data/write/index] is unauthorized for API key id [...] on indices [shop-followups]. The workflow ran its Elasticsearch steps with the caller’s API key. The MCP client’s key needs every index privilege the workflow uses. create_docwas not enough:action [indices:data/write/index:op_type/index] is unauthorized. An index request with an explicitidis an overwrite unless you say otherwise. Addingop_type: createto the step madecreate_docsufficient.- Index search tool:
{"type":"error","data":{"message":"No connector available"}}. It needs an LLM connector to turnnlQueryinto a query. Without one it cannot run. - Errors are not always
isError. Unknown tools and schema violations (a missingcustomer_idgaveInvalid input: expected string, received undefined) came back withisError: true. The authorisation and connector failures above came back asisError: falsewith a result oftype: "error", or a workflowstatus: "failed", inside the text. Check both. {{ execution.startedAt }}renders asSat Oct 03 2026 17:16:08 GMT+0000 (Coordinated Universal Time), which is not a valid date for adatefield.${{ execution.startedAt }}gave2026-10-03T17:22:18.152Z.- Top-level
inputs:is silently dropped in 9.5. It validated, and a run still received the value I passed, but the parsed definition had no inputs, so nothing declared or checked them. The 9.5 schema reads inputs from the manual trigger, while the 9.4 schema still had a top-levelinputskey. The workflow tool builds its parameters from the declared inputs, so put them on the trigger.
With the final key below, the workflow tool returned "status":"completed" with the index result ("result":"created") and the webhook response in output. For C001, a customer with no pending orders, it returned "output":["No pending orders for C001"].
Security notes for the MCP endpoint
"indices": [
  { "names": ["shop-orders", "shop-customers"], "privileges": ["read", "view_index_metadata"] },
  { "names": ["shop-followups"], "privileges": ["create_doc"] }
],
"applications": [{
  "application": "kibana-.kibana",
  "privileges": ["feature_agentBuilder.read", "feature_actions.read",
                 "feature_workflowsManagement.read", "feature_workflowsManagement.workflow_execute"],
  "resources": ["space:default"]
}]- Kibana privileges gate the endpoint, index privileges gate the data. A key with only index
readgot403 ... granted by the Kibana privileges [agentBuilder:read]. A request without a key got401. tools/listis not filtered by data access. The read-only key still saw all 69 tools, including security and observability ones. What stops misuse is the key’s index privileges at call time. To limit what a client sees, use a separate Kibana space per audience.- A workflow tool executes as the caller. Granting
workflow_executeis not enough on its own. The key also needs the index privileges of every Elasticsearch step. That’s good for least privilege, but you have to review the whole workflow before handing out the key. - ES|QL parameters are bound, not concatenated. I sent
customer_id=C016" OR customer_id != "x. The tool escaped it inside the string literal and returned zero rows. - Tool output goes back to the client. The workflow output included the webhook’s response headers and body. Don’t call endpoints whose responses you wouldn’t want an agent to read.
- Keys: Elastic’s guide says Agent Builder keys must be created by a user, not by another API key, and that a key without role descriptors takes a snapshot of its creator’s privileges. Set an
expiration, scoperesourcesto one space, and keep management keys (feature_agentBuilder.all) away from chat clients. On self-managed stacks, OAuth for the MCP server is not available. The docs list it as Serverless only.
What I didn’t test
I had no LLM connector, so I did not run the index search tool, the agent chat, or the AI workflow steps (ai.prompt, ai.classify, ai.summarize and ai.agent, which invokes an Agent Builder agent, per the AI steps docs). A natural next step would be an ai.summarize step after the ES|QL query, but that is untested here. I also did not try OAuth, the Inspector web UI, or TLS.
My take
The useful split is between tools that are deterministic and tools that need a model. ES|QL and workflow tools ran fine with no LLM in the loop, which means you can test, version and review them like any other API, with curl in CI. Keep the “generate a query” tools for exploration, and treat each workflow tool’s API key as a service account whose privileges you have read line by line. I made the same argument about retrieval in enterprise RAG architecture patterns. If you also want traces of those tool calls, the SRE NL evening at the same Elastic office covered the OpenTelemetry side.