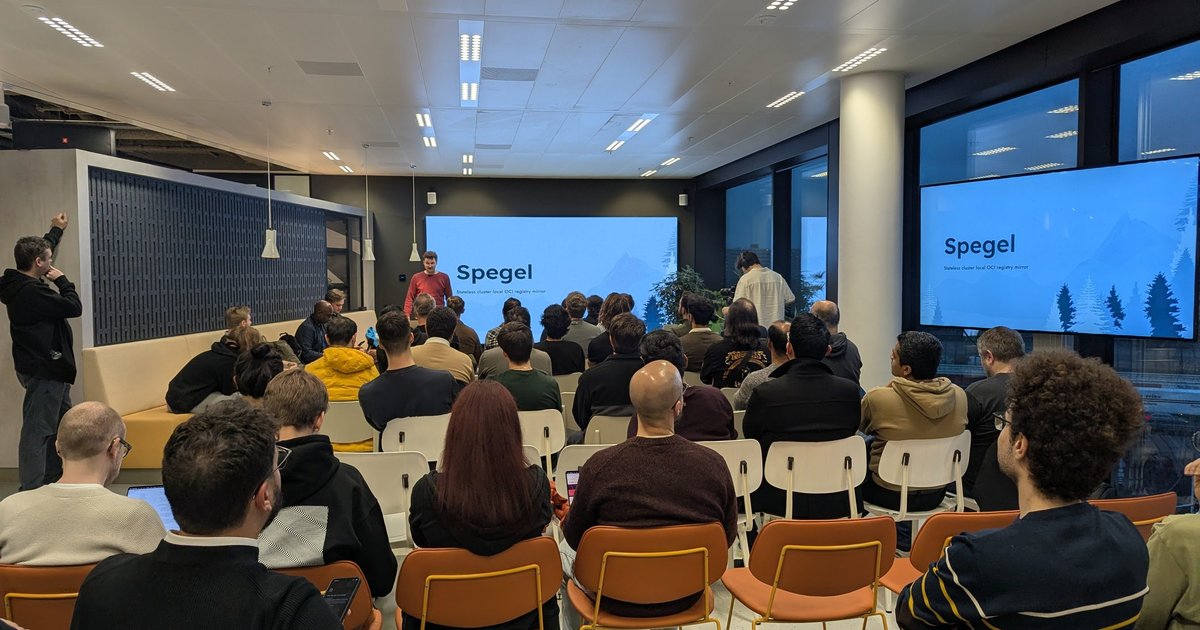
The Dutch Cloud Native & AI Community Group met twice more in Amsterdam at the end of 2025, and I went to both. On Thursday 23 October the main talk was about Spegel, a peer-to-peer image mirror for Kubernetes nodes. On Monday 15 December the group met in collaboration with Dash0, with a double bill: OpenTelemetry and Perses from Dash0’s developer advocate, then a Rust project that set out to beat Kafka on raw write throughput.
These notes are written from the slides I photographed, plus two short phone clips from the October evening. Where I add context from project documentation or my own opinion, I say so.
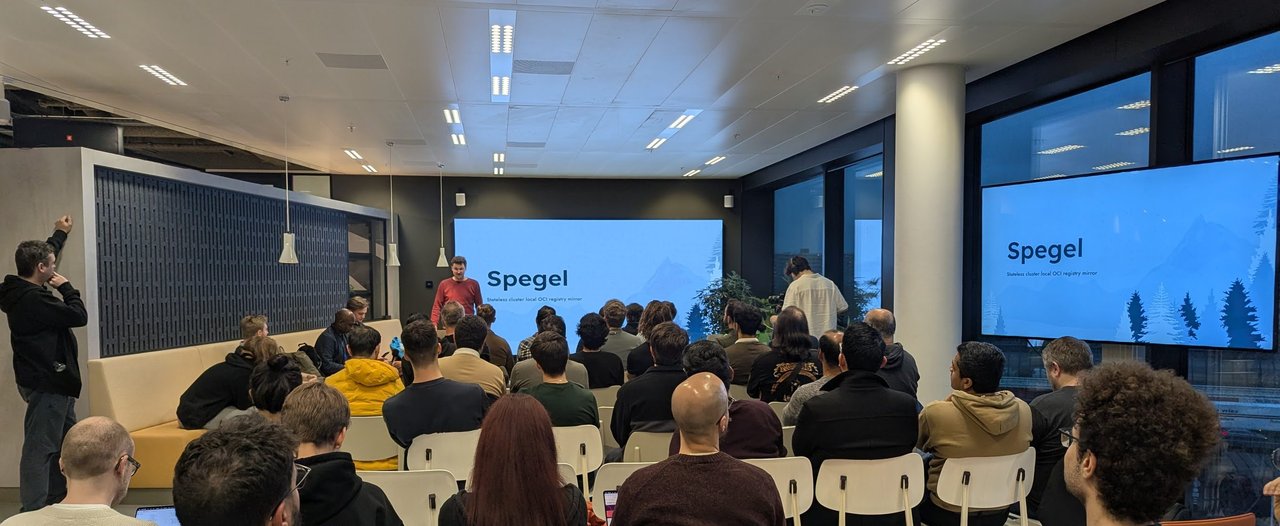
23 October 2025: Spegel on both screens before the talk.
23 October: the evening and the agenda
The September meetup at ASML in Veldhoven had announced this one for 23 October in Amsterdam at JetBrains (I wrote that evening up in Dutch Cloud Native at ASML: Kubewarden, Argo CD, GitOps). The welcome slide showed the group’s name, Dutch Cloud Native & AI Community Group, the Meetup logo and cloudnative.amsterdam.
The agenda on screen was simple:
- 17:30 doors open
- 18:15 first talk
- 18:45 pizza
- 19:45 second talk
- 20:30 lightning talks and networking
- 21:30 doors close
Before the talks, the hosts put up a slide for KubeCon + CloudNativeCon North America 2025 (10–13 November, Atlanta, Georgia) with a registration code for the community.
Spegel: nodes pulling images from each other
Philip Laine presented Spegel, subtitled on his title slide “Stateless cluster local OCI registry mirror”. His closing slide pointed to spegel.dev and github.com/spegel-org/spegel.
Planting the seed: a cluster at 1 AM
The origin story slide was called “Planting the Seed”, and it read like an incident report:
- A presentation about saving a cluster at 1 AM
- Docker Hub is down
- Critical pods require images from Docker Hub
- No ability to scale up
- Docker export the images from the old node
- SCP the image to the new node
The diagram showed exactly that: a node, docker export to an image tarball, scp to a new node. The images the cluster needed were already on disk on the existing nodes. The registry was the only thing missing.
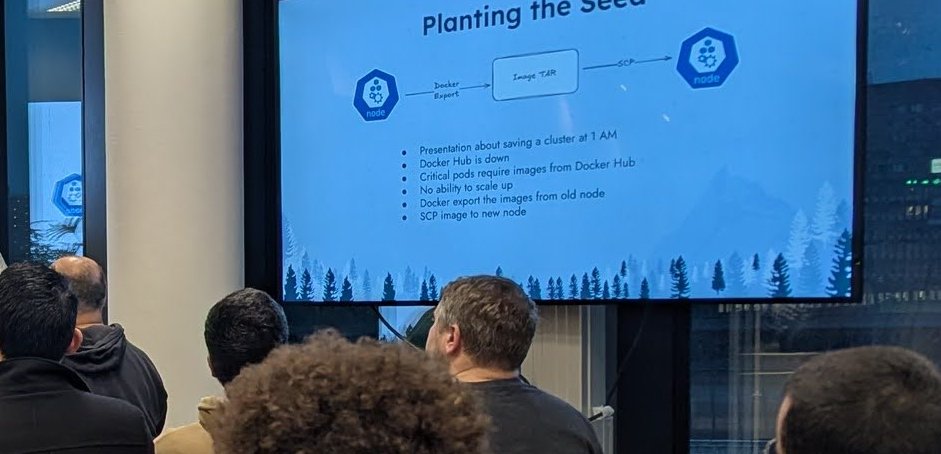
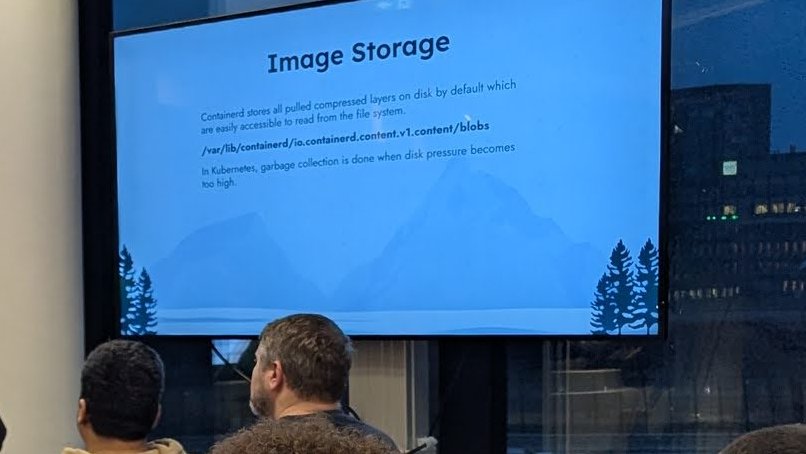
Left: the 1 AM incident that started it. Right: where containerd keeps the layers that Spegel serves.
How it works
The next slide put it in one line: Spegel “enables Kubernetes nodes to pull images from each other”, with a ring of nodes requesting layers by digest from their neighbours and a registry off to the side.
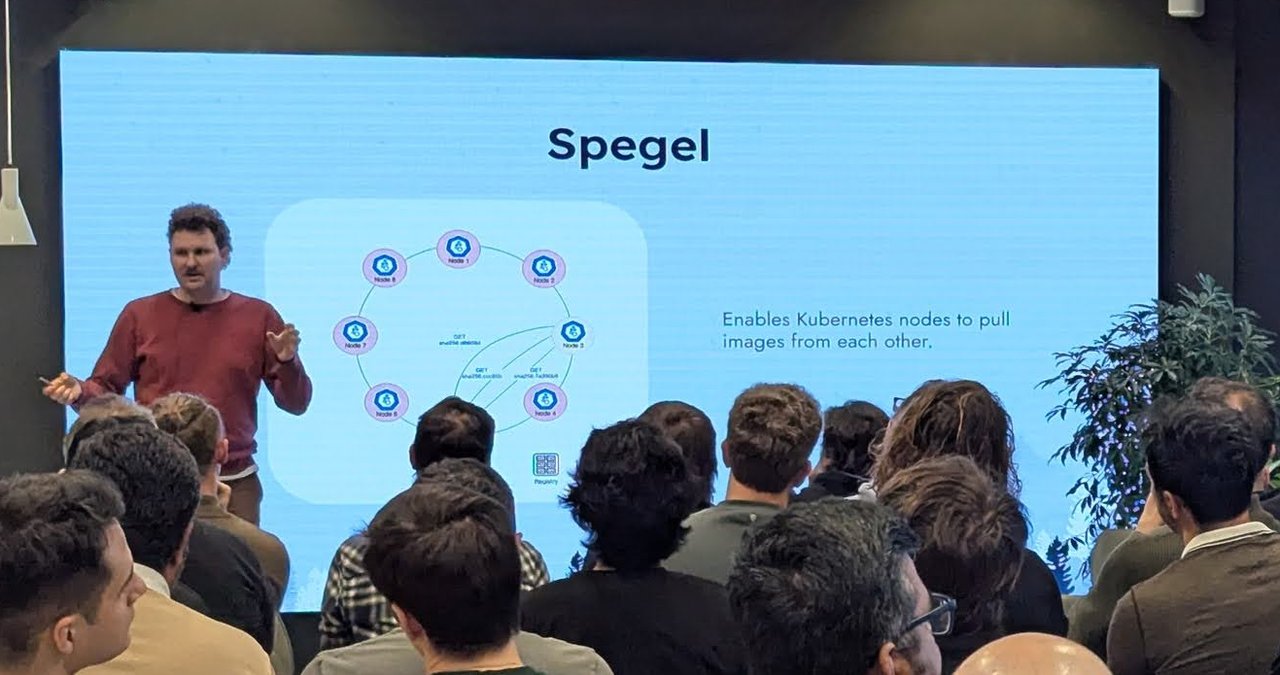
Philip Laine explaining the peer-to-peer ring.
In a short clip I recorded during this part, he explained that once an image is inside the cluster, the next node that wants the same image can fetch it from the other node.
The “Image Storage” slide explained why no extra storage is needed. containerd keeps every pulled compressed layer on disk by default, under /var/lib/containerd/io.containerd.content.v1.content/blobs, where it can be read straight from the file system. In Kubernetes, garbage collection removes them only when disk pressure gets too high.
The Spegel documentation describes the rest of the mechanism. Spegel runs a read-only OCI registry on every host and integrates with containerd to serve images containerd has already pulled and cached. A pull is first redirected to the local Spegel instance. Each instance is a member of a DHT, so it can quickly find which node has the content. If another node has it, the request is forwarded and served from that node’s containerd cache. If no node has it, the pull falls back to the upstream registry. The README lists the use cases: caching images from external registries, surviving registry outages, faster pulls and pod start-up, getting around Docker Hub rate limits, less egress traffic, and edge deployments. The project is MIT licensed and was initially developed at Xenit AB.
Spegel + KServe
The slide I liked most was “Spegel + KServe”:
- Package models in OCI artifacts
- Use OCI volumes to mount models
- Models are cached by containerd
- Spegel enables sharing of models
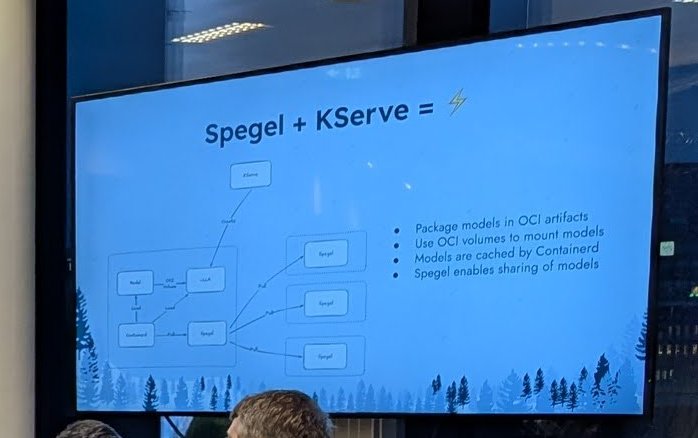
Model weights as OCI artifacts, shared between nodes by Spegel.
My take: this is the part that matters for AI platforms. Container images are a few hundred megabytes; model weights are tens or hundreds of gigabytes, and every new GPU node pulls them again. Kubernetes image volumes mount OCI content straight into a pod. The feature arrived in v1.31 and the documentation now lists it as stable since v1.36. Once models are OCI artifacts that containerd caches, a node-local P2P mirror is a cheap way to stop every scale-up from hammering the registry. I cover the wider options, including Harbor and Dragonfly, in The AI Model Weight Problem.
The thank-you slide closed with questions and the Spegel links.
The next talk: a slide that said “AI”
The agenda listed the second talk only as “Talk 2: Kelsey”. My last photos of the evening show the next speaker in front of a slide that said just “AI”, and I recorded a short clip of that opening. He joked that in Silicon Valley a few slides like that are enough to raise a funding round, then said that was the end of his AI portion: “This is the first technology wave in my entire career that I’ve consciously chosen not to serve.” His reason was that he can afford to, and that the point of work is getting to choose the work you want to do. I didn’t record the rest of the talk.
15 December: Dash0 hosts a double-header
The December meetup’s welcome slide read “Welcome to the Dutch Cloud Native & AI Community Meet-up, 15th of December 2025, in collaboration with Dash0”. The room had sofas and armchairs in place of rows of chairs, a Dash0 lectern and a Dash0 roll-up banner: “Observability, Simplified. AI-Native Observability Platform”, with ticks for “Removing Vendor Lock-in”, “Simple Pricing Model” and “OpenTelemetry-native”.
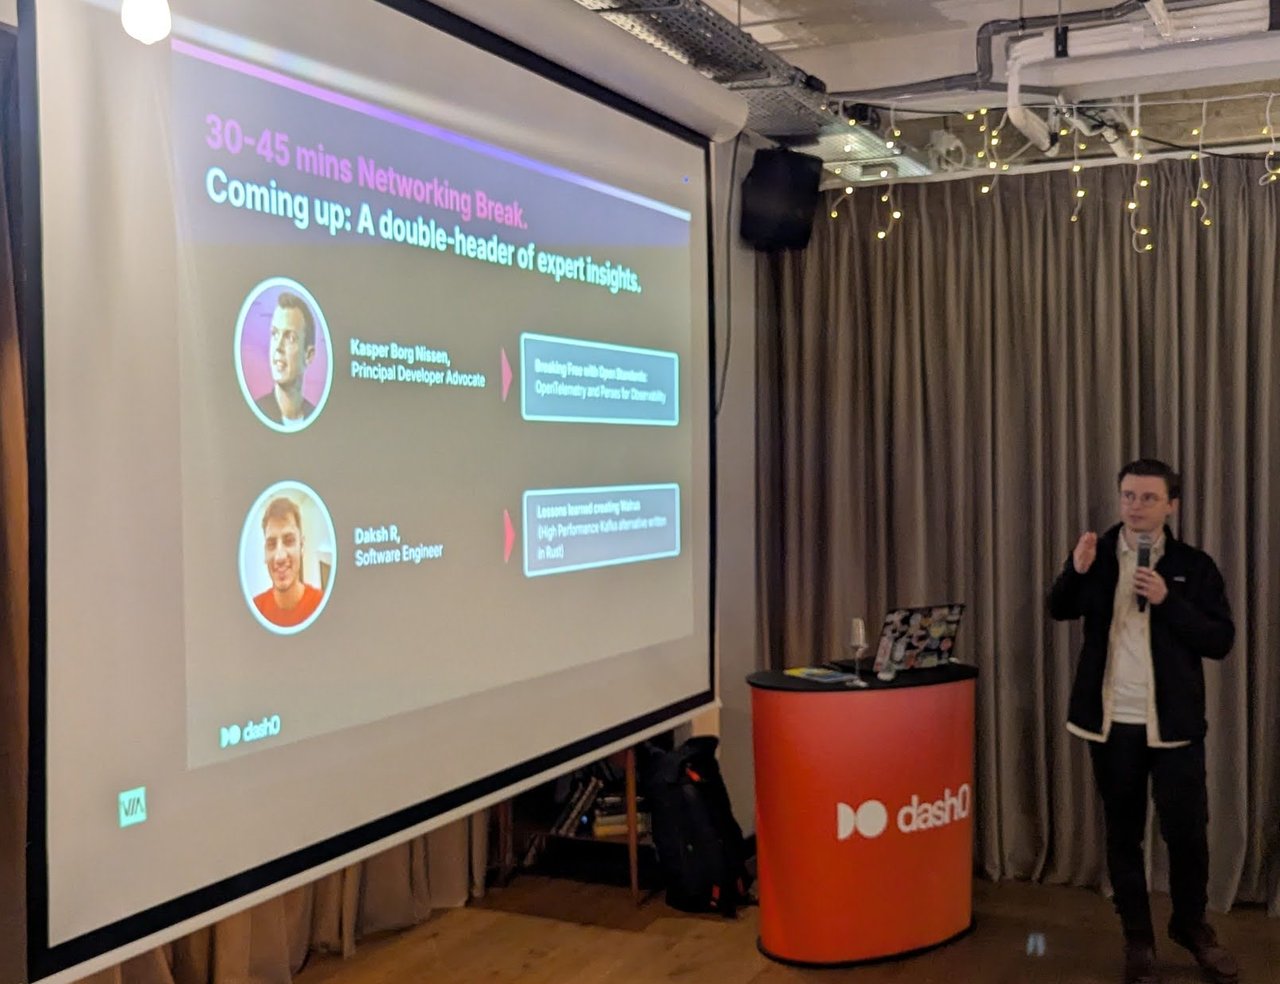
The agenda slide: two talks with a 30–45 minute networking break.
The agenda slide promised “a double-header of expert insights”:
- Kasper Borg Nissen, Principal Developer Advocate: Breaking Free with Open Standards: OpenTelemetry and Perses for Observability
- Daksh R, Software Engineer: Lessons learned creating Walrus (High Performance Kafka alternative written in Rust)
Kasper Borg Nissen: breaking free with open standards
Kasper put the conclusion up early. His tl;dr slide had four bullets:
- OpenTelemetry is standardising telemetry collection.
- Perses is standardising dashboarding.
- Applying platform engineering principles turns observability into a seamless, scalable and developer-friendly experience.
- Building on open standards lets you move freely between vendors, which keeps them on their toes and gives you the best possible experience.
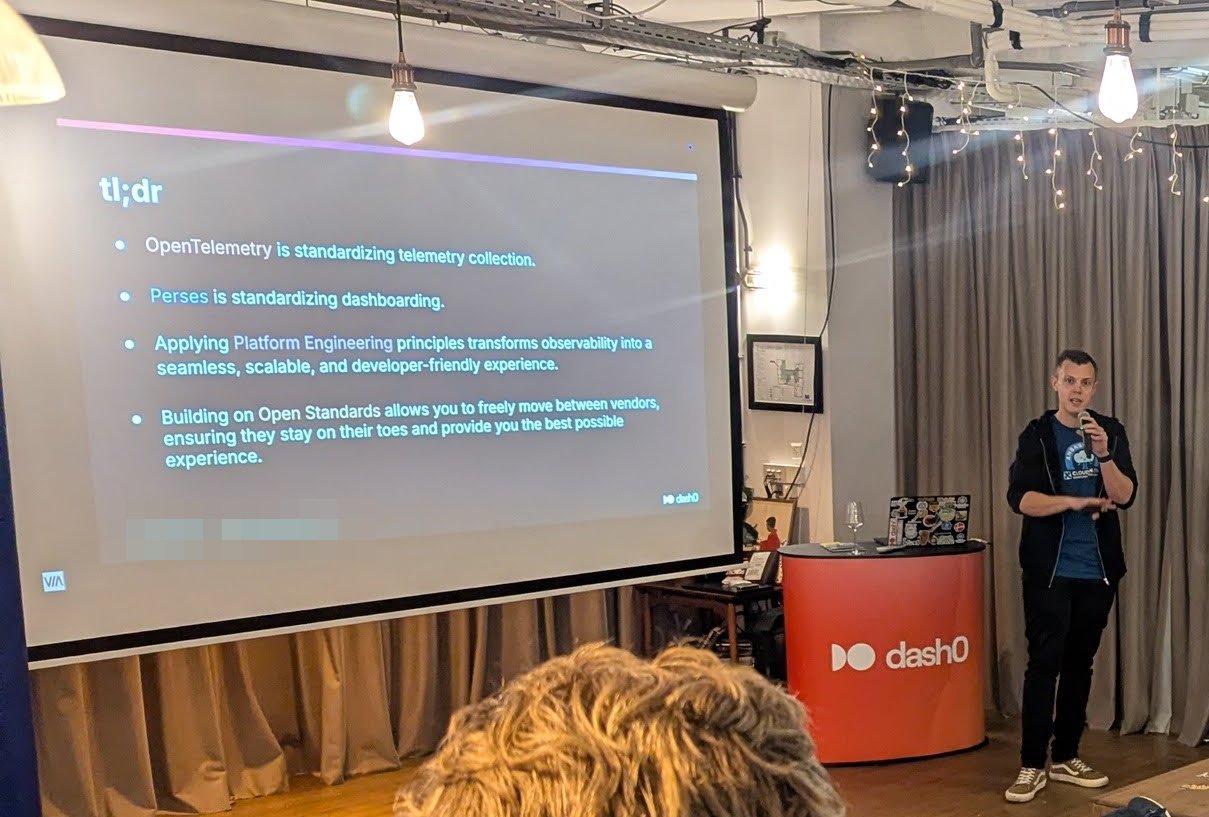
The tl;dr came first.
The haystack problem
The problem slide was a hand-drawn sketch: tabs for logs, metrics, traces, RUM and profiling, “hundreds+ thousands of micro services” feeding into one big haystack, and log lines that say level=DEBUG, level=debug and LEVEL=DEBUG. Three spellings of the same attribute is the problem in one picture: without shared conventions, the data can’t be correlated.
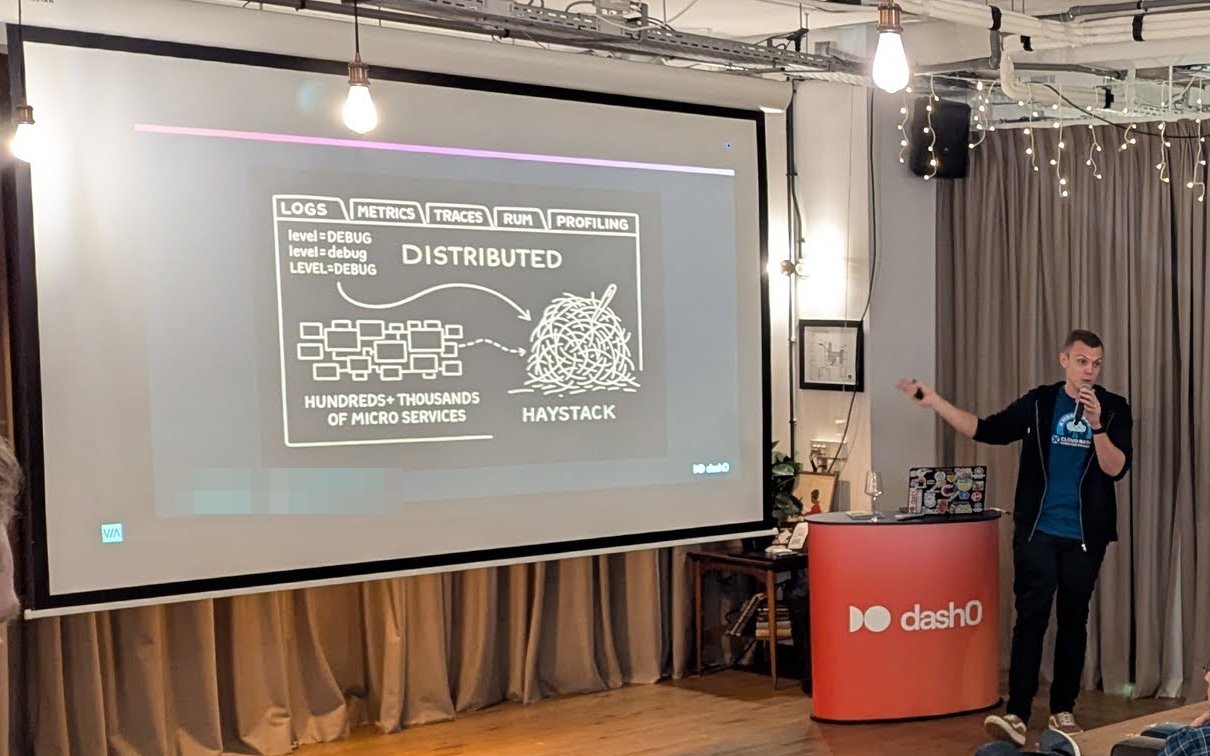
Distributed systems turn telemetry into a haystack.
OpenTelemetry in a nutshell
The “OpenTelemetry in a nutshell” slide described the project as the “2nd largest CNCF project by contributor count”, and as “a set of various things focused on letting you collect telemetry about systems”: data models, API specifications, semantic conventions, library implementations in many languages, utilities, “and much more”.
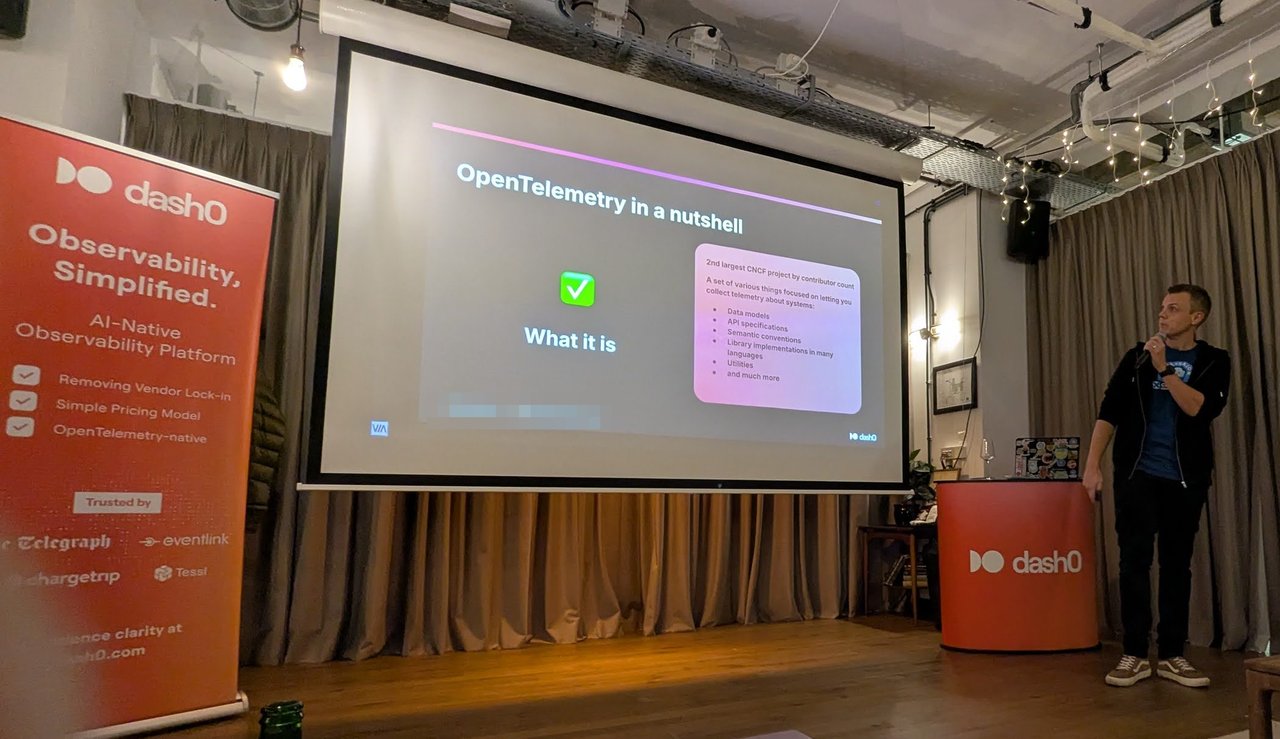
“What it is”: the OpenTelemetry building blocks.
That matches the project’s own What is OpenTelemetry? page. It lists a specification, OTLP, semantic conventions, APIs, language SDKs, instrumentation libraries, zero-code instrumentation, the Collector and Kubernetes tooling. It also says plainly that OpenTelemetry “is not an observability backend”: storage and visualisation are left to other tools. That gap is where Perses comes in. Perses is a CNCF Sandbox dashboard project with an open dashboard specification and dashboards-as-code SDKs in CUE and Go.
A book, a whitepaper and a demo
Near the end, Kasper held up a copy of OpenTelemetry For Dummies. The cover lists him and Ayooluwa Isaiah as authors, and the slide offered a free copy. Dash0 publishes it as a free Dash0 Special Edition download. The next slide pointed to a whitepaper, Observability for platform engineers, published by Platform Engineering with Dash0.
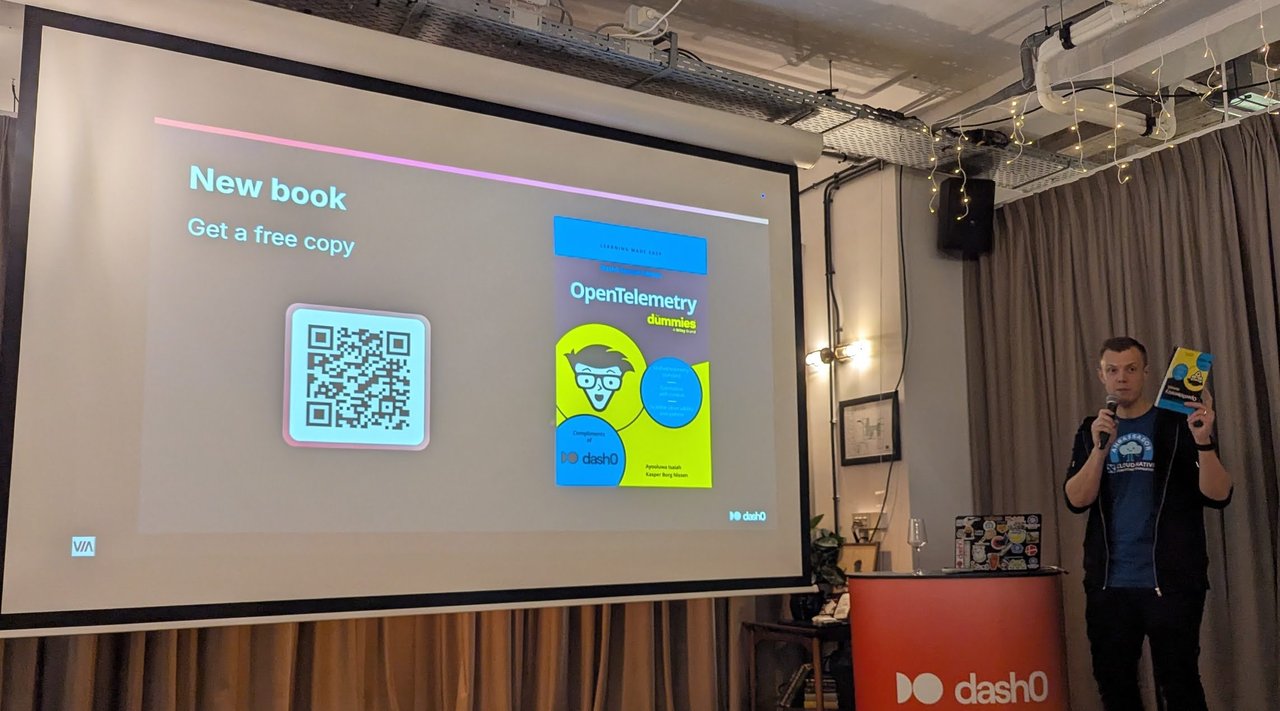
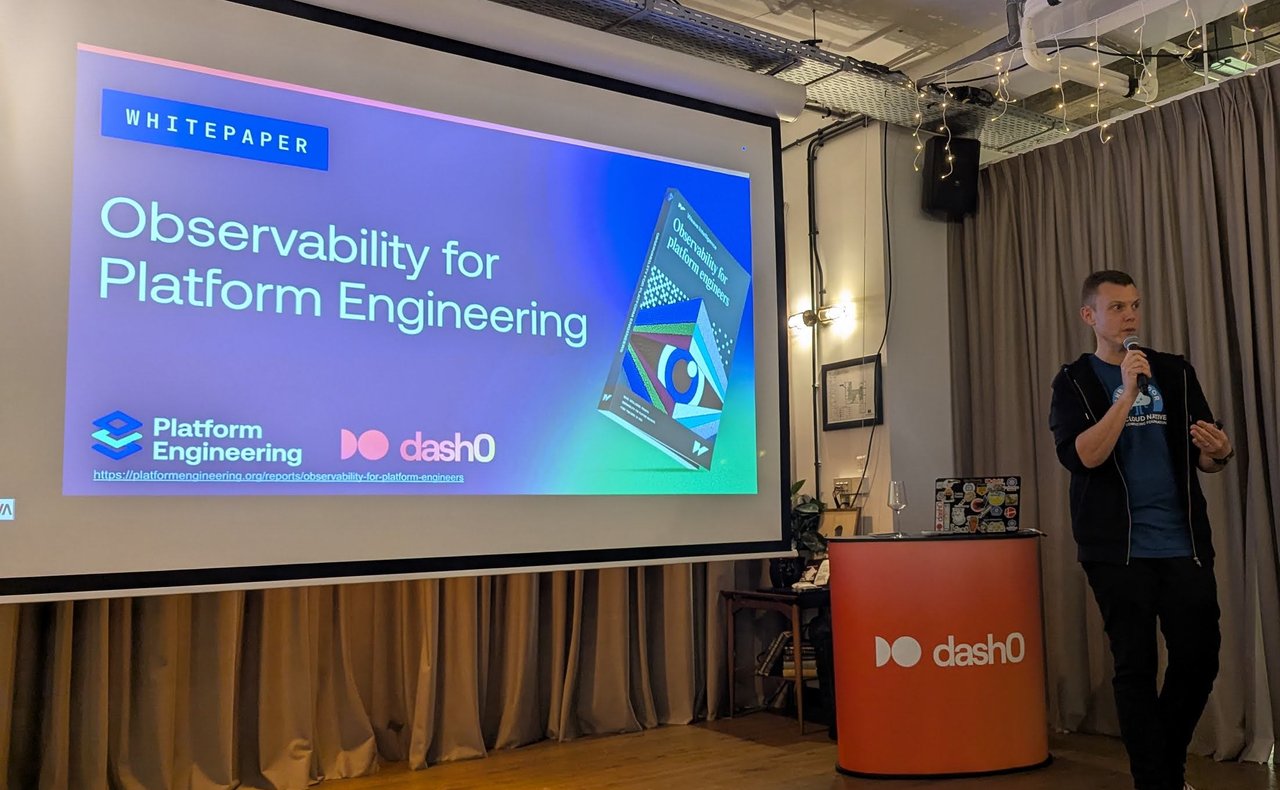
Left: OpenTelemetry For Dummies. Right: the Observability for Platform Engineering whitepaper.
The thank-you slide linked the demo, dash0hq/otel-platform-demo. According to its README, it combines a Backstage developer portal with OpenTelemetry-instrumented microservices on a kind cluster. A Backstage template creates a new service, an OpenTelemetry Operator annotation turns on auto-instrumentation, the Collector hashes a sensitive span attribute (user.email), and the same template generates a Perses dashboard for the new service.
My take: that demo is the tl;dr made concrete. The golden path gives you telemetry and a dashboard without anyone writing instrumentation code, and both are built on open standards, so the backend stays replaceable. That is what I want from a platform team. I go through the OpenTelemetry side in OpenTelemetry on Kubernetes: The 2026 Observability Stack.
Daksh R: lessons learned creating Walrus
After the networking break, Daksh R talked about Walrus, billed on the agenda as a “High Performance Kafka alternative written in Rust”. The slide I photographed was a benchmark: Write Throughput Comparison and Write Bandwidth Comparison over about 60 seconds, for Walrus, RocksDB and Kafka.
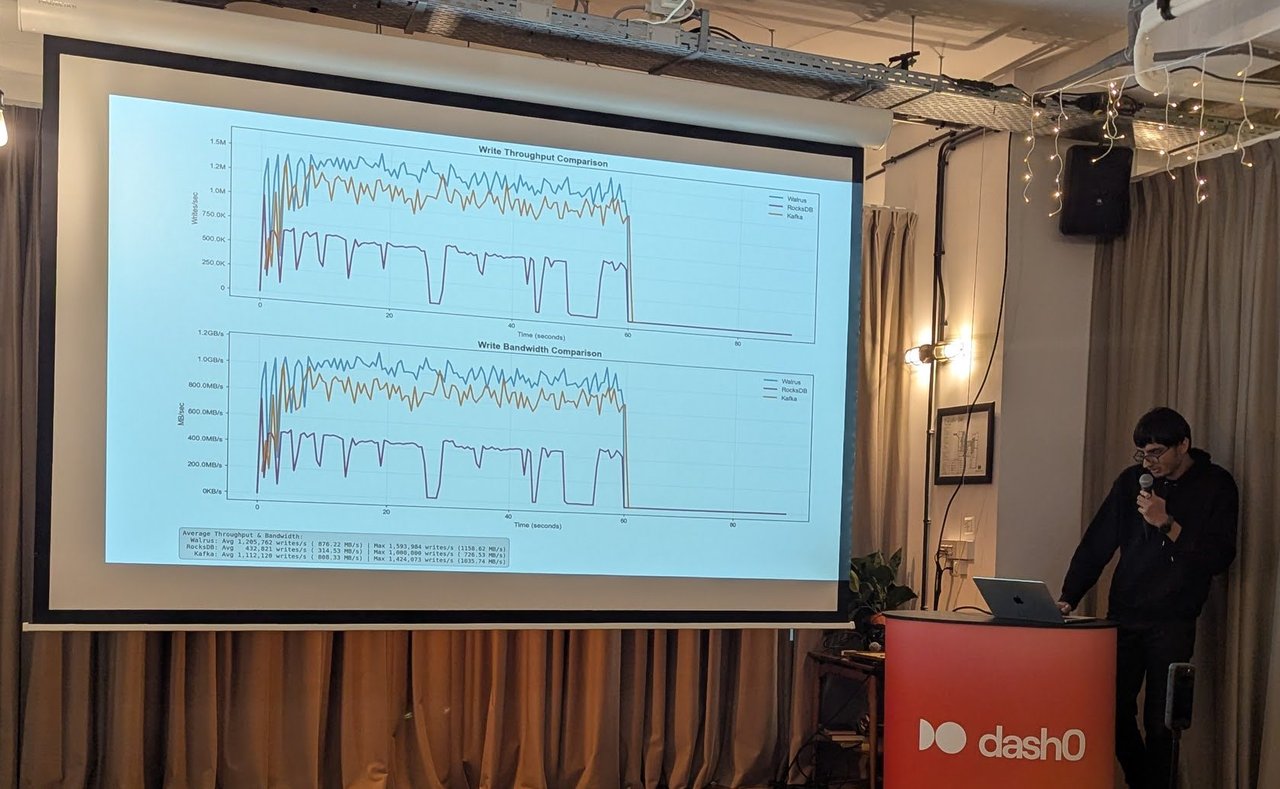
Walrus against RocksDB and Kafka on writes per second and MB/s.
The legend under the charts gave the averages and peaks:
| System | Avg writes/s | Avg MB/s | Max writes/s | Max MB/s |
|---|---|---|---|---|
| Walrus | 1,205,762 | 876.22 | 1,593,984 | 1,158.62 |
| Kafka | 1,112,120 | 808.33 | 1,424,073 | 1,035.74 |
| RocksDB | 432,821 | 314.53 | 1,000,000 | 726.53 |
These are the same numbers as the “no fsync” table in the Walrus README, which describes Walrus as a distributed message streaming platform on a log storage engine, with Raft for metadata, segment-based leadership rotation and io_uring on Linux. It’s MIT licensed.
My take: read the README’s second table too. With fsync on every write, all three land at about 5,000 writes per second (RocksDB 5,222, Walrus 4,980, Kafka 4,921 on average), and the README notes the comparison uses a single Kafka broker with no replication and no network overhead. That doesn’t take anything away from the project. It is a reminder that “faster than Kafka” depends on the durability settings, and those are what decide the result in production.