When you debug a Bazel build, the error message is rarely the whole story. A missing file can mean an undeclared dependency, a green build can be serving a stale output, and a flaky test can hide behind a retry. In this tutorial I break a small Bazel workspace in four realistic ways on purpose, then pin each failure down with the tool that answers the question fastest: --sandbox_debug, bazel aquery, --toolchain_resolution_debug, a diff of two execution logs, the Build Event Protocol and the JSON trace profile.
At the Uber x EngFlow Build Meetup in Amsterdam on 28 January 2026, Ed Schouten’s Bonanza talk had a slide on its evaluation framework. Because the client receives the full build graph after every build, the slide said, there’s no need for a separate Build Event Stream, and no need for debugging flags like --toolchain_resolution_debug, --sandbox_debug or --verbose_failures. Bonanza is still experimental. Most of us run Bazel today, so I wanted to see what those flags and the event stream actually tell you. Everything below is my own lab, not content from the talk.
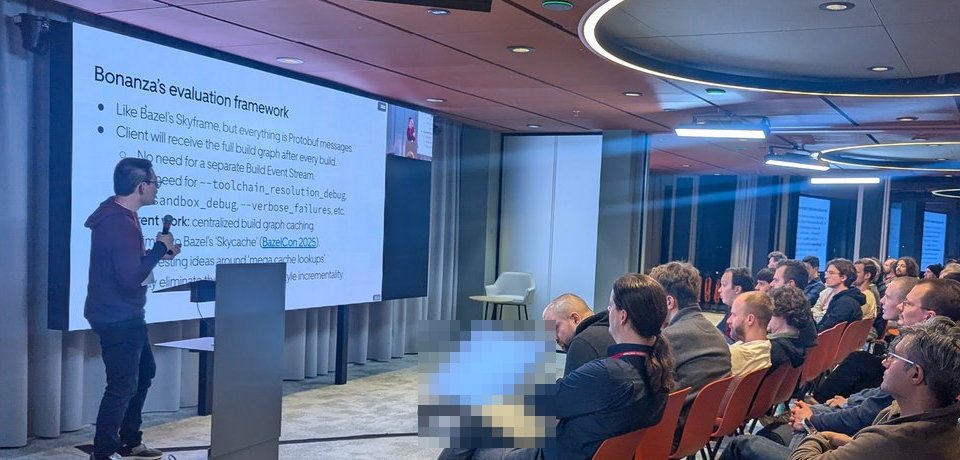
The Bonanza slide that lists the Bazel debugging flags it wants to make unnecessary.
Versions. Bazel 9.2.0 through Bazelisk 1.29.0 on macOS (Apple silicon), so actions run in the darwin-sandbox. The only modules are rules_shell 0.6.1 and platforms 1.0.0: genrules, two sh_test targets and a tiny custom toolchain, no compilers. I checked every flag against bazel help test --long for 9.2.0 and the user manual. In the output below, <output_base> and <lab> stand for my long local paths.
The toolbox: which flag answers which question
| Question | Tool |
|---|---|
| Which command failed, and what did it see? | --verbose_failures, --sandbox_debug, --subcommands |
| What are this action’s inputs and command line? | bazel aquery |
| Why was no toolchain found? | --toolchain_resolution_debug=<regex> |
| Why did this action rerun (or not)? | --explain, --execution_log_json_file (diff two runs) |
| What failed, what was slow, what was cached, for the whole run? | --build_event_json_file |
| Where did the wall time go? | --profile and the JSON trace profile |
Failure 1: a missing dependency the sandbox catches
The genrule reads app/config.txt but only declares the template:
genrule(
    name = "report",
    srcs = ["report.tmpl"],
    outs = ["report.txt"],
    cmd = "cat $(location report.tmpl) app/config.txt > $@",
)
ERROR: <lab>/demo/app/BUILD.bazel:2:8: Executing genrule //app:report failed: (Exit 1): bash failed: ...
Use --sandbox_debug to see verbose messages from the sandbox and retain the sandbox build root for debugging
cat: app/config.txt: No such file or directoryThe file exists in the workspace, so the error looks wrong. Rerun with --sandbox_debug. The help text says it does two things: “the sandbox root contents are left untouched after a build” and it “prints extra debugging information on execution”. The error now shows the full sandbox-exec invocation and the sandbox directory, and the sandbox is still there afterwards:
cd <output_base>/sandbox/darwin-sandbox/2/execroot/_main && find ../app/report.tmpl
./external/bazel_tools/tools/genrule/genrule-setup.sh
./bazel-out/darwin_arm64-fastbuild/bin/appOnly declared inputs are linked into the sandbox. bazel aquery says the same thing without building anything:
bazel aquery //app:report Inputs: [app/report.tmpl, external/bazel_tools/tools/genrule/genrule-setup.sh]
Outputs: [bazel-out/darwin_arm64-fastbuild/bin/app/report.txt]
Environment: [PATH=/bin:/usr/bin:/usr/local/bin]Two traps here. First, --spawn_strategy=local makes the build pass (1 local in the processes line), because a local action runs in the execroot, where the whole source tree is visible. That’s how undeclared inputs survive on one laptop. Second, --subcommands prints the command with cd <output_base>/execroot/_main, not the sandbox path, so if you paste it into a shell it works too. Use the sandbox, not the printed command, to reproduce what the action saw.
The fix is to declare the file: srcs = ["report.tmpl", "config.txt"] and cmd = "cat $(SRCS) > $@". After that, aquery lists app/config.txt as an input.
Failure 2: a non-hermetic genrule that reads a host file
This one doesn’t fail. That’s the problem.
genrule(
    name = "buildinfo",
    outs = ["buildinfo.txt"],
    cmd = "sed s/^/tool_version=/ <lab>/host/VERSION > $@",
)
I built it with 1.4.2 in the host file, changed the file to 1.5.0, and built again:
INFO: 1 process: 1 internal.
INFO: Build completed successfully, 1 total action
tool_version=1.4.2
Stale output, green build. --explain=explain.log lists only Executing action 'BazelWorkspaceStatusAction stable-status.txt': unconditional execution is requested., because Bazel doesn’t know the genrule depends on that file. The darwin sandbox didn’t catch it either: the generated sandbox.sb profile contained (allow default) and (deny file-write*) with a few writable paths, so reads from the host file system are allowed.
Two tools make the hidden dependency visible. The execution log lists what Bazel thinks the action read. With --execution_log_json_file=exec.json, the record for //app:buildinfo had a single input, genrule-setup.sh, and "remoteCacheable": true. With a remote cache, whichever machine builds first would publish its tool version to everyone. Then --sandbox_block_path turns the hidden read into an error. Sandbox flags aren’t part of the action key, so I ran bazel clean first to force the action to run:
bazel clean
bazel build //app:buildinfo --sandbox_block_path=<lab>/host
sed: <lab>/host/VERSION: Operation not permitted
Target //app:buildinfo failed to buildThe fix is to make the file a tracked input. For a directory outside the workspace, new_local_repository from @bazel_tools//tools/build_defs/repo:local.bzl works with Bzlmod through use_repo_rule:
# MODULE.bazel
new_local_repository = use_repo_rule("@bazel_tools//tools/build_defs/repo:local.bzl", "new_local_repository")

new_local_repository(
    name = "host_tool",
    path = "<lab>/host",
    build_file_content = 'exports_files(["VERSION"])',
)
genrule(
name = "buildinfo",
srcs = ["@host_tool//:VERSION"],
outs = ["buildinfo.txt"],
cmd = "sed s/^/tool_version=/ $< > $@",
)Now changing VERSION reruns the action and the output says tool_version=1.5.0.
Why did it rerun? —explain vs an execution log diff
--explain with --verbose_explanations gave me this for the rerun:
Executing action 'Executing genrule //app:buildinfo': action changed since cached execution.I got the same sentence when I edited a source file and when I changed the genrule’s cmd. It tells you that an action reran, not what changed. For that, write an execution log on both builds and diff them. The JSON log is a stream of SpawnExec objects with commandArgs, environmentVariables, inputs (path and digest), listedOutputs, runner, cacheHit and metrics. This script compares two of them:
#!/usr/bin/env python3
"""Explain why actions reran: diff two --execution_log_json_file logs."""
import json
import sys


def records(path):
    """The log is a stream of JSON objects, not one array."""
    text, dec, i = open(path).read(), json.JSONDecoder(), 0
    while True:
        while i < len(text) and text[i].isspace():
            i += 1
        if i == len(text):
            return
        obj, i = dec.raw_decode(text, i)
        yield obj


def index(path):
    out = {}
    for r in records(path):
        key = (r.get("targetLabel", "?"), tuple(r.get("listedOutputs", [])))
        out[key] = {
            "args": r.get("commandArgs", []),
            "env": {e["name"]: e["value"] for e in r.get("environmentVariables", [])},
            "inputs": {i["path"]: i.get("digest", {}).get("hash") for i in r.get("inputs", [])},
        }
    return out


old, new = index(sys.argv[1]), index(sys.argv[2])
for key in sorted(old.keys() & new.keys()):
    a, b, why = old[key], new[key], []
    if a["args"] != b["args"]:
        why.append("command line changed")
    for k in sorted(a["env"].keys() | b["env"].keys()):
        if a["env"].get(k) != b["env"].get(k):
            why.append(f"env {k}: {a['env'].get(k)!r} -> {b['env'].get(k)!r}")
    for p in sorted(a["inputs"].keys() | b["inputs"].keys()):
        x, y = a["inputs"].get(p), b["inputs"].get(p)
        if x != y:
            why.append(f"input {p}: {str(x)[:12]} -> {str(y)[:12]}")
    if why:
        print(key[0])
        for w in why:
            print("   ", w)
bazel build //app:buildinfo --execution_log_json_file=exec-1.json
echo 1.5.0 > <lab>/host/VERSION
bazel build //app:buildinfo --execution_log_json_file=exec-2.json
python3 execlog_diff.py exec-1.json exec-2.json//app:buildinfo
input external/+new_local_repository+host_tool/VERSION: b99b4c7cdf23 -> acb57a7135b2The log only contains actions that ran, so an action that was a local cache hit in one build won’t appear. For cross-machine comparisons, run bazel clean before each build, as the remote cache debugging guide describes. That guide recommends --execution_log_compact_file for large builds, which is smaller but needs the //src/tools/execlog:parser tool from the Bazel source to read. --execution_log_sort defaults to true for the JSON and binary formats, so two logs line up. My bazel-remote post uses the same log to find remote cache misses from --action_env, PATH and stamping.
Failure 3: no matching toolchain
I wrote a tiny greeter toolchain type and rule (a toolchain_type, a rule that returns platform_common.ToolchainInfo, and a rule that reads ctx.toolchains["//tc:toolchain_type"]). Only a Linux toolchain was registered, the way a team might set it up for CI runners:
toolchain(
    name = "linux",
    exec_compatible_with = ["@platforms//os:linux"],
    target_compatible_with = ["@platforms//os:linux"],
    toolchain = ":linux_impl",
    toolchain_type = ":toolchain_type",
)
On my Mac:
ERROR: <lab>/demo/app/BUILD.bazel:23:9: While resolving toolchains for target //app:hello (2d89340): No matching toolchains found for types:
  //tc:toolchain_type
To debug, rerun with --toolchain_resolution_debug='//tc:toolchain_type'
Bazel prints the exact flag to use:
INFO: ToolchainResolution: Performing resolution of //tc:toolchain_type for target platform @@platforms//host:host
      ToolchainResolution:   Rejected toolchain //tc:linux (resolves to //tc:linux_impl) ; mismatching values: linux
      ToolchainResolution: No //tc:toolchain_type toolchain found for target platform @@platforms//host:host.
bazel query --output=build @platforms//host:host shows what the host platform is: @platforms//cpu:aarch64 and @platforms//os:osx. The more interesting case is cross-building. I added a platform with @platforms//os:linux and @platforms//cpu:arm64 and passed --platforms=//:linux_arm64:
ToolchainResolution:   Toolchain //tc:linux (resolves to //tc:linux_impl) is compatible with target platform, searching for execution platforms:
ToolchainResolution:     Incompatible execution platform @@platforms//host:host; mismatching values: linux
The target constraint matched, the execution constraint didn’t. exec_compatible_with says where the toolchain can run, so this one can only be used on a Linux machine. My greeter writes a file and runs nothing, so I removed exec_compatible_with and added a macOS toolchain with target_compatible_with = ["@platforms//os:macos"]. The debug output then ends with Selected //tc:macos_impl to run on execution platform @@platforms//host:host, and --platforms=//:linux_arm64 selects the Linux one. Scope the regex to the type you care about: the help text warns the output “is very complex”.
Failure 4: a flaky, slow test
//tests:service_test simulates waiting for a dependency that is sometimes slow: it sleeps 0 to 3 seconds and fails at 3. One bazel test usually passes. --runs_per_test shows the truth:
bazel test //tests:all --runs_per_test=8//tests:unit_test PASSED in 1.0s
Stats over 8 runs: max = 1.0s, min = 0.1s, avg = 0.2s, dev = 0.3s
//tests:service_test FAILED in 1 out of 8 in 3.8s
Stats over 8 runs: max = 3.8s, min = 0.8s, avg = 1.8s, dev = 1.1sEach run gets its own log under bazel-testlogs/tests/service_test/run_N_of_8/test.log, and the failing one said waiting 3s for the fake service and service did not answer within 2s. A large dev next to a failure is the flaky-and-slow signature.
--flaky_test_attempts=3 retries a failed test. In one of my runs the first attempt failed and the second passed:
FAIL: //tests:service_test (Exit 1) (see .../service_test/test_attempts/attempt_1.log)
//tests:service_test                  FLAKY, failed in 1 out of 2 in 3.1s
Retries hide the problem from the build result, which is why I’d use them only with a report of FLAKY tests (next section). The real fix was to poll for readiness with a 10-second deadline instead of a fixed budget. To confirm it, I used --runs_per_test=20: PASSED, Stats over 20 runs: max = 3.2s, min = 0.1s, avg = 2.0s. The test is still slow, and the profile shows where that matters.
Bazel Build Event Protocol: summarise a whole run
The Build Event Protocol is a stream of protobuf messages that describe one invocation. --build_event_json_file writes it as one JSON object per line (--build_event_binary_file and --build_event_text_file also exist). I ran everything at once, with failure 1 put back:
bazel test //... --keep_going \
  --runs_per_test=//tests:service_test@4 \
  --build_event_json_file=bep.json \
  --build_event_publish_all_actions \
  --profile=profile.json.gz
The 92 events included started, targetConfigured, targetCompleted (8), actionCompleted (19), testResult (5), testSummary (2), buildMetrics and buildFinished. By default only failed actions get an actionCompleted event. --build_event_publish_all_actions publishes every action, with startTime and endTime. Two quick jq checks:
# Targets that failed
jq -r 'select(.id.targetCompleted and (.completed.success | not)) | .id.targetCompleted.label' bep.json
# Test verdicts
jq -r 'select(.id.testSummary) | "\(.id.testSummary.label) \(.testSummary.overallStatus) runs=\(.testSummary.totalRunCount)"' bep.json
//app:report
//tests:unit_test PASSED runs=1
//tests:service_test FAILED runs=4Note the success | not: protobuf JSON drops false fields, so a failed target has no success key at all. For a fuller report I use a short script that prints failed actions with their stderr, every test attempt, the slowest actions and the cache statistics from buildMetrics.actionSummary:
#!/usr/bin/env python3
"""Summarise a --build_event_json_file: failures, tests, slow actions, cache."""
import json
import sys
from datetime import datetime
from pathlib import Path
from urllib.parse import urlparse


def seconds(start, end):
    parse = lambda s: datetime.fromisoformat(s.replace("Z", "+00:00"))
    return (parse(end) - parse(start)).total_seconds()


events = [json.loads(line) for line in open(sys.argv[1])]
actions = [e["action"] for e in events if "actionCompleted" in e["id"]]
tests = [(e["id"]["testResult"], e["testResult"]) for e in events if "testResult" in e["id"]]
metrics = next((e["buildMetrics"] for e in events if "buildMetrics" in e["id"]), {})

print("== Failed actions")
for a in actions:
    if a.get("success"):
        continue
    print(f"{a['label']}  {a['type']}  exit={a.get('exitCode')}")
    path = urlparse(a.get("stderr", {}).get("uri", "")).path
    if path and Path(path).exists():
        for line in Path(path).read_text().splitlines()[:5]:
            print("   ", line)

print("== Test attempts")
for tid, res in tests:
    print(f"{tid['label']}  run {tid['run']} attempt {tid['attempt']}  "
          f"{res['status']}  {res.get('testAttemptDuration', '?')}")

print("== Slowest actions (needs --build_event_publish_all_actions)")
timed = [(seconds(a["startTime"], a["endTime"]), a) for a in actions if "startTime" in a]
for secs, a in sorted(timed, key=lambda t: t[0], reverse=True)[:5]:
    print(f"{secs:6.2f}s  {a['type']:<12} {a['label']}")

summary = metrics.get("actionSummary", {})
print("== Where actions ran")
for r in summary.get("runnerCount", []):
    print(f"{r['name']:<20} {r['count']}")
cache = summary.get("actionCacheStatistics", {})
print(f"local action cache: hits={cache.get('hits', 0)} misses={cache.get('misses', 0)}")
for d in cache.get("missDetails", []):
    if d.get("count"):
        print(f"   miss {d['reason']}: {d['count']}")
== Failed actions
//app:report Genrule exit=1
cat: app/config.txt: No such file or directory
== Test attempts
//tests:unit_test run 1 attempt 1 PASSED 0.099s
//tests:service_test run 3 attempt 1 PASSED 2.155s
//tests:service_test run 2 attempt 1 FAILED 3.091s
//tests:service_test run 1 attempt 1 FAILED 3.093s
//tests:service_test run 4 attempt 1 FAILED 3.096s
== Slowest actions (needs --build_event_publish_all_actions)
3.14s TestRunner //tests:service_test
3.14s TestRunner //tests:service_test
3.13s TestRunner //tests:service_test
2.20s TestRunner //tests:service_test
0.14s TestRunner //tests:unit_test
== Where actions ran
total 19
internal 13
darwin-sandbox 11
local action cache: hits=0 misses=19
miss NOT_CACHED: 13
miss UNCONDITIONAL_EXECUTION: 6After bazel shutdown and the same command again, the console said 13 action cache hit and the script printed hits=13 misses=6. The stderr URI points into bazel-out/_tmp/actions, so read it before the next build. The started event carries user, host and workspaceDirectory, so treat a BEP file as internal data before you attach it to a public issue.
The JSON trace profile
Bazel writes a profile for every build-like command by default (--generate_json_trace_profile is auto) into the output base, with a command.profile.gz symlink to the latest one. --profile=profile.json.gz puts it where you want. The JSON trace profile docs say to open chrome://tracing, click “Load” and pick the file, compressed or not. The Perfetto UI also opens Chrome JSON trace files. The rows to look at first are “Critical Path”, the “action count” counter and “Main Thread”.
Older guides use bazel analyze-profile. In 9.2.0 that returns Command 'analyze-profile' not found, and it isn’t in the command list of bazel help. The docs point to the Bazel Invocation Analyzer for automated suggestions instead. For a quick terminal answer, the trace is plain JSON (traceEvents, with thread names in metadata events):
#!/usr/bin/env python3
"""Critical path and slowest actions from a Bazel JSON trace profile."""
import gzip
import json
import sys

opener = gzip.open if sys.argv[1].endswith(".gz") else open
events = json.load(opener(sys.argv[1], "rt"))["traceEvents"]
threads = {(e["pid"], e["tid"]): e["args"]["name"]
           for e in events if e.get("ph") == "M" and e.get("name") == "thread_name"}
spans = [e for e in events if e.get("ph") == "X"]

print("== Critical path")
for e in spans:
    if threads.get((e["pid"], e["tid"])) == "Critical Path":
        print(f"{e['dur'] / 1e6:6.2f}s  {e['name']}")
print("== Slowest actions")
actions = [e for e in spans if e.get("cat") == "action processing"]
for e in sorted(actions, key=lambda e: e["dur"], reverse=True)[:5]:
    print(f"{e['dur'] / 1e6:6.2f}s  {e.get('args', {}).get('mnemonic', '?'):<10} {e['name']}")
== Critical path
0.00s action 'Creating source manifest for //tests:service_test'
0.00s action 'Creating runfiles tree bazel-out/darwin_arm64-fastbuild/bin/tests/service_test.runfiles'
0.00s runfiles for //tests:service_test
3.14s action 'Testing //tests:service_test (run 4 of 4)'The run took 4.0 seconds with a 3.15-second critical path, and almost all of it was one slow test run. That’s what a slow integration test does to every pull request.
A debug config for CI
I keep these flags behind a config so a failing CI job can be rerun with one change. I ran Bazel from the workspace root, and the relative paths landed there:
# .bazelrc — use with: bazel test --config=debug //...
build:debug --verbose_failures
build:debug --build_event_json_file=bep.json
build:debug --build_event_publish_all_actions
build:debug --execution_log_compact_file=exec.log
build:debug --profile=profile.json.gz
build:debug --explain=explain.log
Upload the four files as CI artifacts. --sandbox_debug and --toolchain_resolution_debug stay out: the first leaves sandbox directories behind, the second floods the log, and both are for a rerun once you know which action or toolchain type to look at.
My take
Most Bazel debugging comes down to one question: what did the action see, compared with what you think it saw? aquery and the sandbox answer it for one action, the execution log for every action, and the BEP for the whole invocation. The Bonanza slide is right that these are many separate tools to learn. Until something like it is production-ready, I’d make the BEP summary and a weekly --runs_per_test job part of the platform team’s CI, and treat every FLAKY result as a bug.