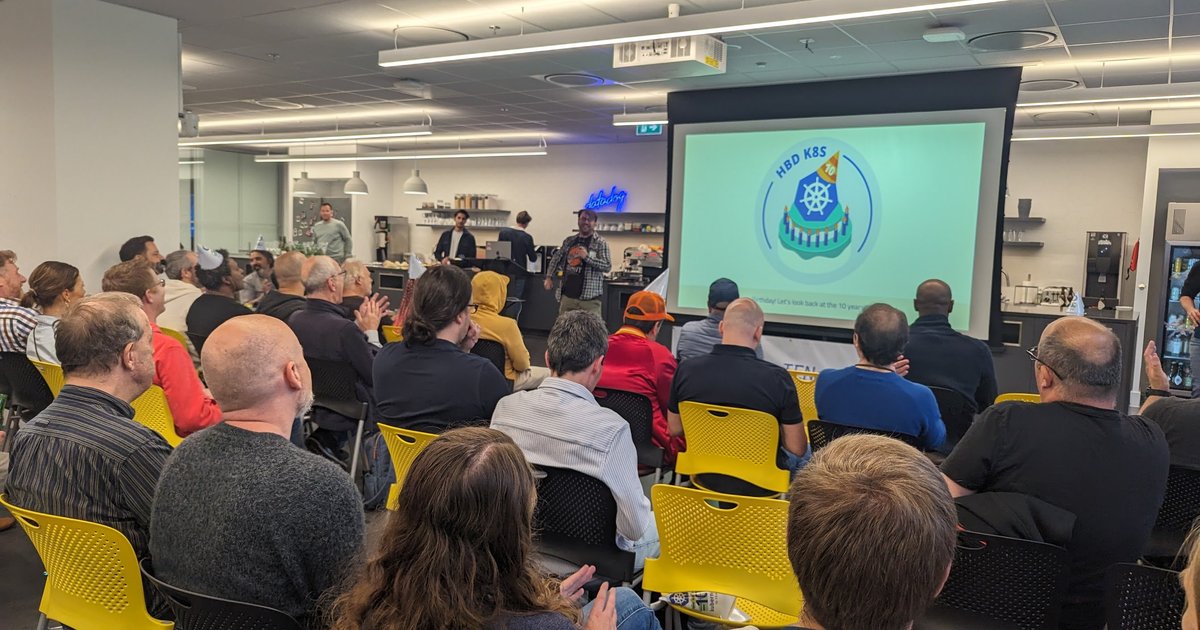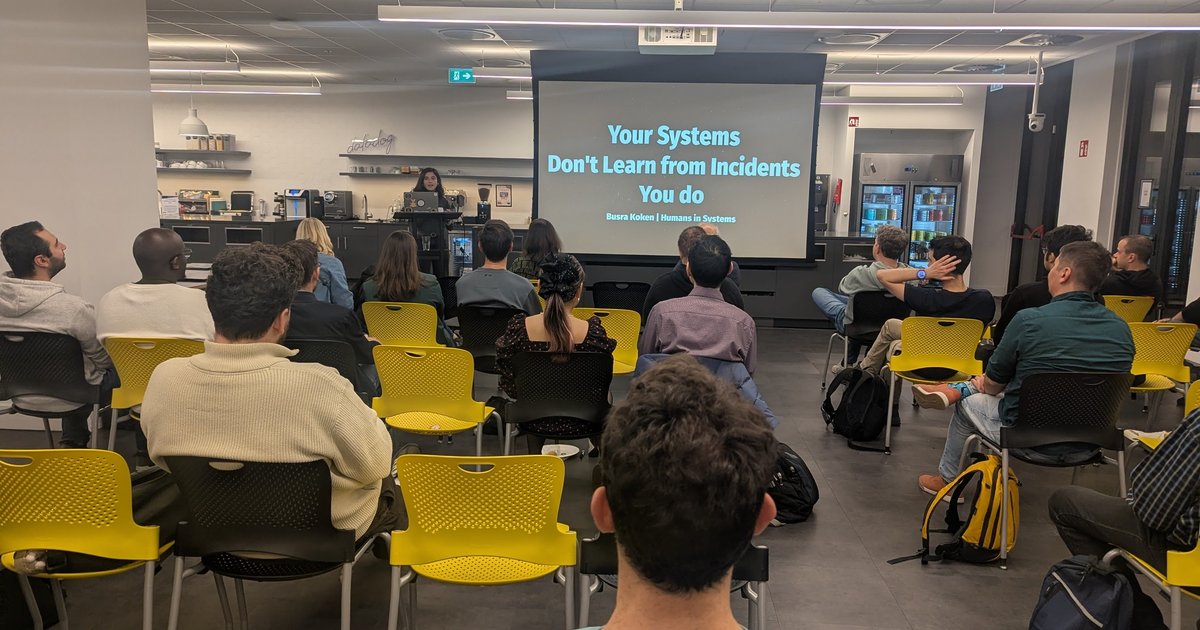
On Thursday 24 April 2025 I went to a “Celebrating 10 years of K8s” meetup at the Datadog office in Amsterdam, a Kubernetes birthday evening held in a meetup room with orange streamers and a disco ball. The speakers’ names were not on the slides I photographed, so I describe the talks by their slides rather than by person. The most technical session was a story about KubeHound, Datadog’s open source Kubernetes attack graph tool, and that is where most of this post goes.
Celebrating 10 years of K8s
The opening slide read “Celebrating 10 years of K8s @Datadog Office Amsterdam”, with a party-hat Kubernetes logo and a “Hosted by” strip that included the Datadog logo. It is the follow-up to the first birthday evening in the same office, which I covered in Kubernetes 10th Birthday Meetup in Amsterdam.
The opening slide, with the Hosted by logos along the bottom.
One talk was titled “Observability & K8s: How Observability Drives Kubernetes”. Part of it was a survey slide: its headline said that, in a survey of 500 companies, a share planned to move VMs to Kubernetes within two years, and next to it a chart read “80% are building most of their new apps on cloud-native”. The speaker asked the room questions during that slide and several people raised their hands.
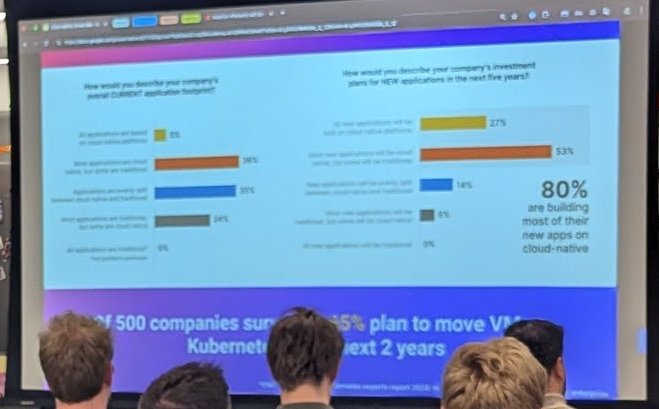
The survey slide. The speaker asked the room questions while it was up.
A later slide borrowed the reliability hierarchy from Google’s “Site Reliability Engineering” book: product at the top, then development, capacity planning, testing and release procedures, and postmortem and root-cause analysis lower down. The SRE book chapter on practicing SRE describes it as a hierarchy of service needs, in the style of Maslow’s, from monitoring at the base up to product design. It is a useful reminder that capacity planning sits between the basics and building features.
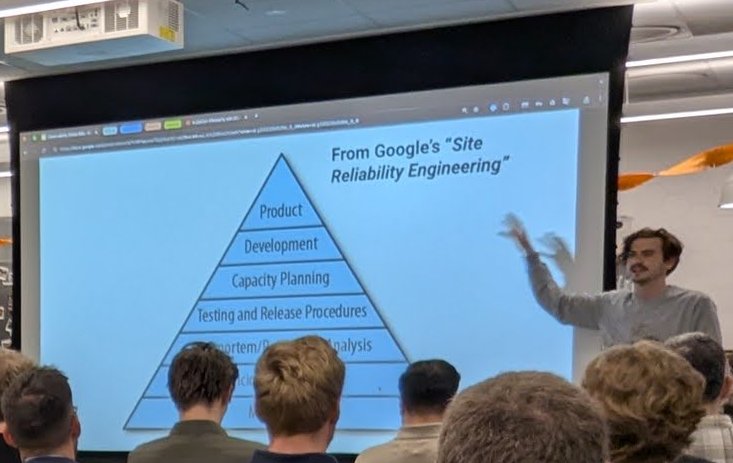
The reliability pyramid from the SRE book, with the speaker gesturing at the top of the screen.
KubeHound: attack paths as a graph
According to the KubeHound documentation, the tool “creates a graph of attack paths in a Kubernetes cluster”, so you can see direct and multi-hop routes an attacker could take, and the site lists more than 25 attacks, from container escapes to lateral movement. The GitHub repository describes it as a Kubernetes attack graph tool for automated calculation of attack paths between assets in a cluster, under the Apache 2.0 licence. The graph is queried with Gremlin, and a small DSL covers the basic cases.
The talk covered that DSL first. The slide, titled “KubeHound DSL: UX above all”, said the team built a custom Domain Specific Language on top of Gremlin to improve the user experience, with more than 20 custom wrappers that make it easy to generate attack paths.
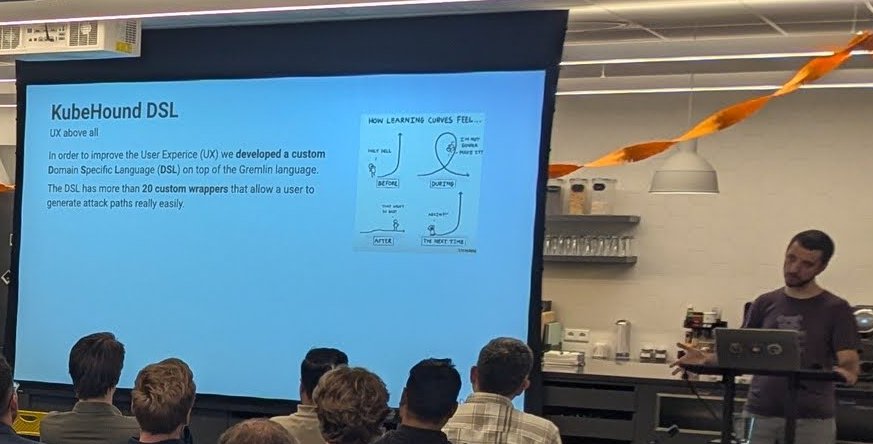
The KubeHound DSL slide: a Gremlin wrapper aimed at making attack paths easy to ask for.
Another slide pointed at kubehound.io as “the reference table for all Kubernetes attacks implemented in KubeHound”.
The reference table slide.
From Neo4j proof of concept to in-memory graph
The part I liked best was the performance story. The proof of concept, v0.1, was Neo4j based. The slide gave two numbers: 10 hours to ingest 25k pods, and 1 hour to dump all objects using a bash script.
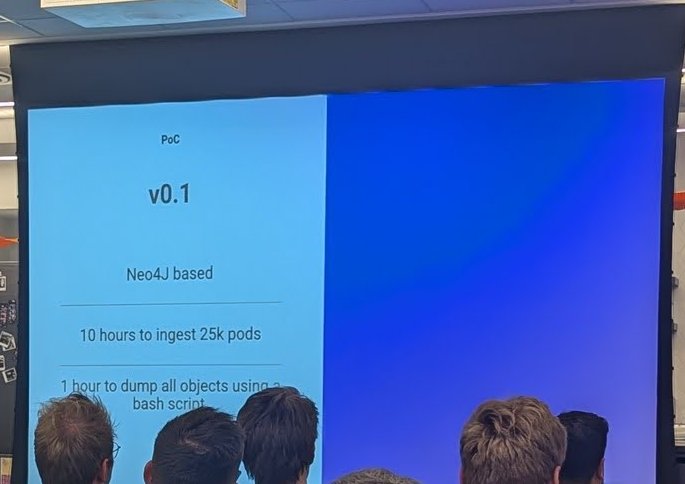
The v0.1 proof of concept and its ingestion times.
The “Performance improvements” slide listed four changes: use an in-memory graph backend, tune the graph to better optimise for writes, optimise the queries used to generate edges, and optimise Kubernetes API querying. It carried a “30 sec building graph” label. The kubehound.io page today quotes about 5 minutes for a cluster of 25,000 pods, which is in the same direction as the talk.
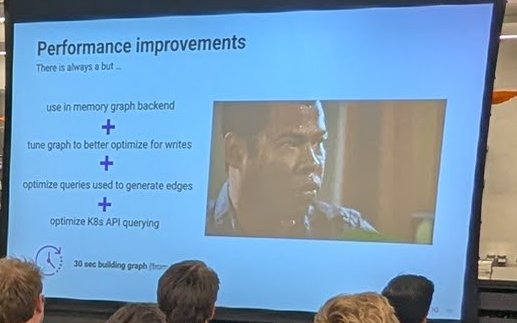
The four performance changes, with a meme image on the right.
The last slide in this part, “Some metrics in Datadog”, gave the running cost:
- 60gb: a memory-only backend for JanusGraph that can hold all of Datadog’s clusters.
- 20cpu: total CPU used in production to process all the data, from the ingestor to the databases.
- 10gb: the size of all daily snapshots in their S3 bucket, with the Kubernetes resources compressed well.
- 1min: the average time to rehydrate a dump into KubeHound.
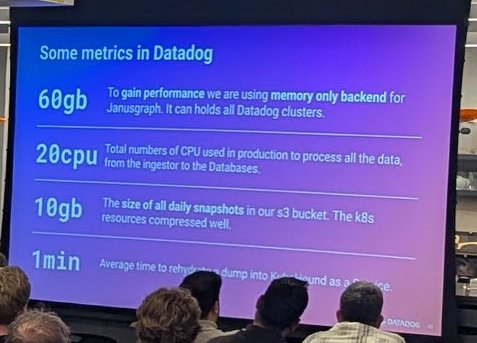
Production numbers for KubeHound at Datadog, as shown on the slide.
What the observability talk said about moving to Kubernetes
My recording of the “Observability & K8s” session starts in the middle of the talk, so this is a partial account, paraphrased from the audio. The speaker walked through the pains that show up as teams adopt Kubernetes and what observability adds to each. It was a vendor talk and used Datadog screens, but the speaker did say you could build the same thing yourself.
- One view across clouds. Teams often have Azure Monitor, CloudWatch, a cloud console and Prometheus open at once. The suggestion was a single place for hosts and for clusters, whether they run on AKS, EKS, GKE or on premises, where from a node you can jump to its YAML, its pods and related data.
- Distributed tracing for microservices. With a demo web store (shipping, promotions, notifications, recommendations, payments and a user database), a 500 on checkout does not tell you which downstream service failed. Tracing a request from the front end lets you work backwards, and you can then check the container that ran at the time for CPU, memory or scheduling problems even if the container no longer exists. His advice was to start with tracing before digging into infrastructure.
- Release velocity needs version tracking. At a minimum you should see error rate and latency per service version and be able to roll back when a new version spikes. Kubernetes annotations make version tagging easy, and connecting CI/CD runs and commits to the observability view speeds up finding the change that caused a failure.
- Smart alerting. SLOs should not be 99.9999 percent unless you never touch the system; define them around user journeys, so that in the morning you look at five SLOs instead of 150 alerts, which reduces war rooms and incidents.
- Anomaly detection last. Once alerting and automation have made things stable, the next level is a system that tells you when something unexpected happens, such as a deployment that normally has zero unready pods now having four, ideally correlated with a recent version change so a rollback takes minutes rather than hours. He said some customers use this as their home page.
My take
Attack-path tooling is easy to demo on one kind cluster and hard to run across a whole fleet, so I valued the honest story: a first version that took ten hours, then a deliberate move to snapshots and an in-memory graph. The shape of the fix, snapshot once, rehydrate fast and query the graph, applies to other cluster-wide analysis too. If you want to harden your own clusters first, start with RBAC best practices and the Kubernetes security hardening checklist, then use a tool like KubeHound to find the paths you missed.