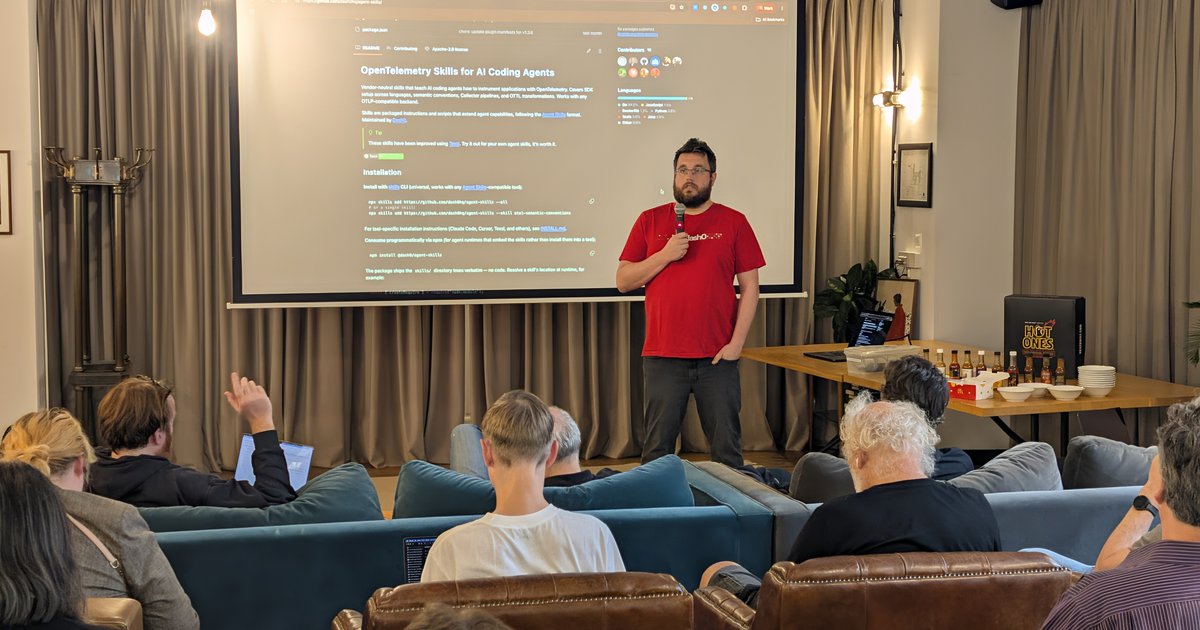
On Tuesday evening, after Arch9, I went to Mindspace Damsquare on the Nieuwezijds Voorburgwal, where Dash0 has its office, for the Site Reliability Engineering NL meetup: OpenTelemetry turn up the heat with Dash0. The programme had one talk, “All the ways you can autoinstrument with OpenTelemetry”, by Michele Mancioppi, co-founder and Chief Architect at Dash0 and an OpenTelemetry maintainer, then an AMA with hot sauces, then an OTel pub quiz. These notes come from the slides I photographed and from my recordings of the evening.
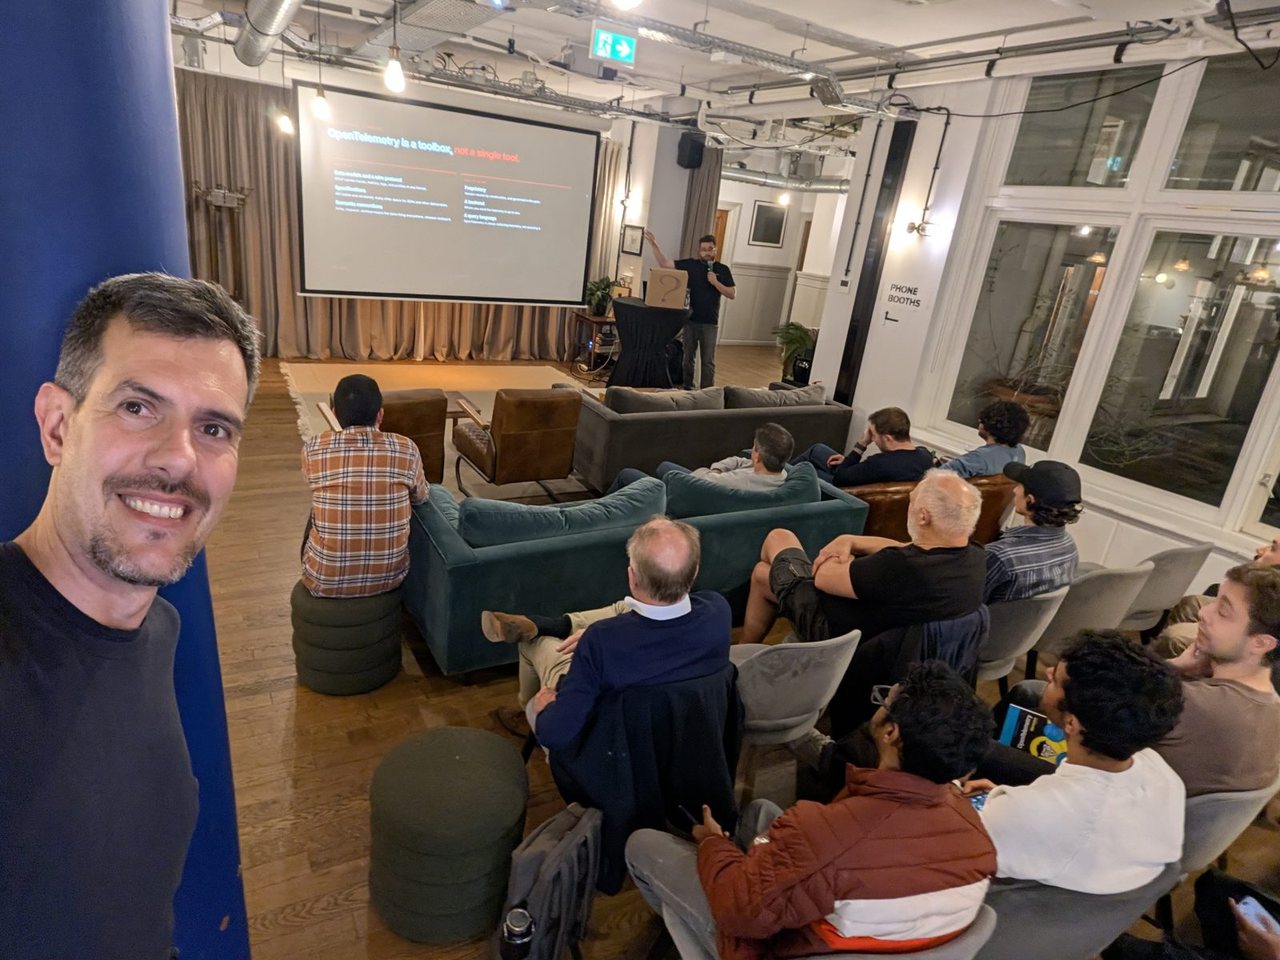
A toolbox, not a tool
Michele’s first slide, “thirty seconds, I promise”, said what OpenTelemetry is: data models and a wire protocol (OTLP carries traces, metrics, logs and profiles in one format), specifications, semantic conventions, and libraries in many languages, plus the Collector. And what it is not: proprietary, a backend, a query language, or finished. “I actually never expect OpenTelemetry to be really finished”, Michele said; AI is making us build software in new ways, so we may observe it in new ways too.
The status slide, as of October 2026: traces, metrics and logs are stable; profiles reached public alpha in March 2026, “the one almost nobody has turned on”. Real-user monitoring and synthetic monitoring are not signals of their own: they produce spans, logs and metrics. Session replay is not a signal either; Michele is looking forward to AI watching every recorded session to find where things go wrong.
Instrumentation is a spectrum
From native (the library or framework already speaks OpenTelemetry; Next.js generates traces on its own), to manual (you, or increasingly your AI, code against the OpenTelemetry API, for example to put the customer on every span), to automatic (an agent bundled with the app), to zero-code, “where we are going”: no work per application, the platform configured once.
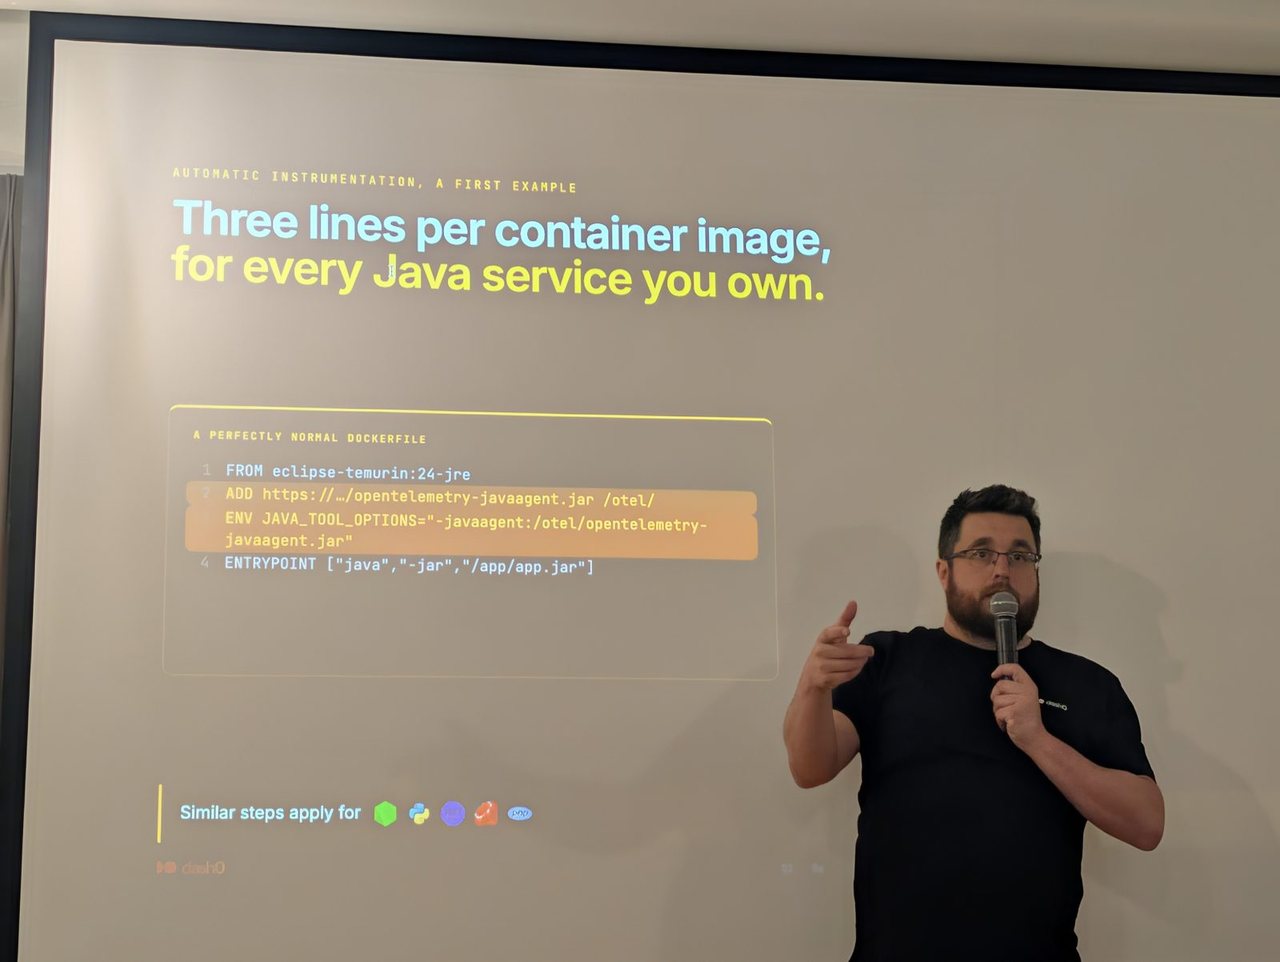
The first example was a perfectly normal Dockerfile, with two extra lines to add the Java agent and set JAVA_TOOL_OPTIONS. Michele asked the platform engineers in the room whether developers enjoy managing observability libraries. They don’t, and asking them to update container images is as hard as asking them to add a dependency. So the point of the talk was to do it with no developer involved: “This is not a democracy.” Observability, in Michele’s words, is like broccoli: good for them.
Zero code, three flavours
- Compile time, Go only. Go has no runtime to hook, so you hook the compiler:
go buildbecomesotelc go build, which rewrites your code, your dependencies and the standard library as they compile. Michele’s favourite part: trace context travels with the goroutine, so you no longer passcontext.Contextthrough every function. v1 landed in July 2026. - Automatic injection. The mental model is two steps: deliver the files (an init container, a shared volume, a host package, the image), then activate them by changing the process environment (
JAVA_TOOL_OPTIONS,NODE_OPTIONS,PYTHONPATH,CORECLR_*,LD_PRELOAD). On Kubernetes, the OpenTelemetry Operator does it with a mutating admission webhook, as pods are scheduled. The catch: you have to say, pod by pod, which language to inject, and the base image matters. On Alpine, which links against musl, a wrong annotation for .NET means zero spans; Python fails softer, with higher overhead. - Kernel level, with eBPF. More on that below.
For hosts without Kubernetes, there are now system packages: apt install opentelemetry or dnf install opentelemetry, one setup for every Java, .NET, Node.js and Python application on the host. It is Michele’s own project. The injector behind it is a shared library loaded with LD_PRELOAD before anything else: it looks at the process it lands in, finds which libc it uses, and sets the right variable for the runtime, so nobody has to know which language each application is written in. Java, Node.js, .NET and Python ship today; Ruby and PHP are coming. Statically linked binaries never load it, and the Operator does not use it yet.
From outside the process
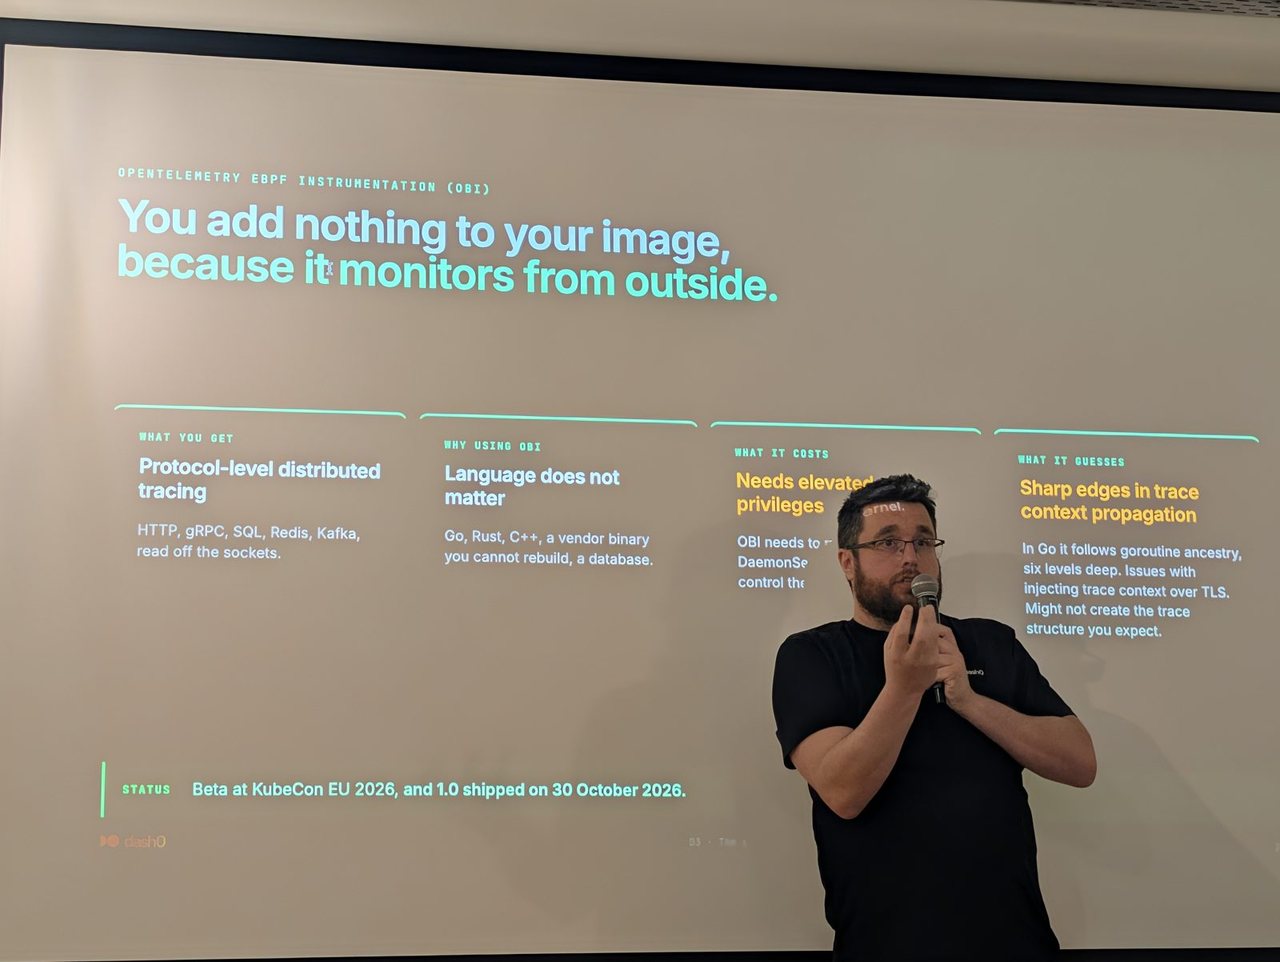
OBI, the OpenTelemetry eBPF Instrumentation, reads HTTP, gRPC, SQL, Redis and Kafka off the sockets and turns them into spans, whatever the language: Go, Rust, C++, a vendor binary you cannot rebuild, a database. The price is privileges. It runs as a privileged DaemonSet, and if you work in a regulated industry, Michele said, the security team may want to talk to you about it; the injector, by contrast, runs with the same privileges as your application. Trace context propagation has sharp edges, over TLS for example. OBI was beta at KubeCon EU 2026, and 1.0 shipped on 30 October 2026.
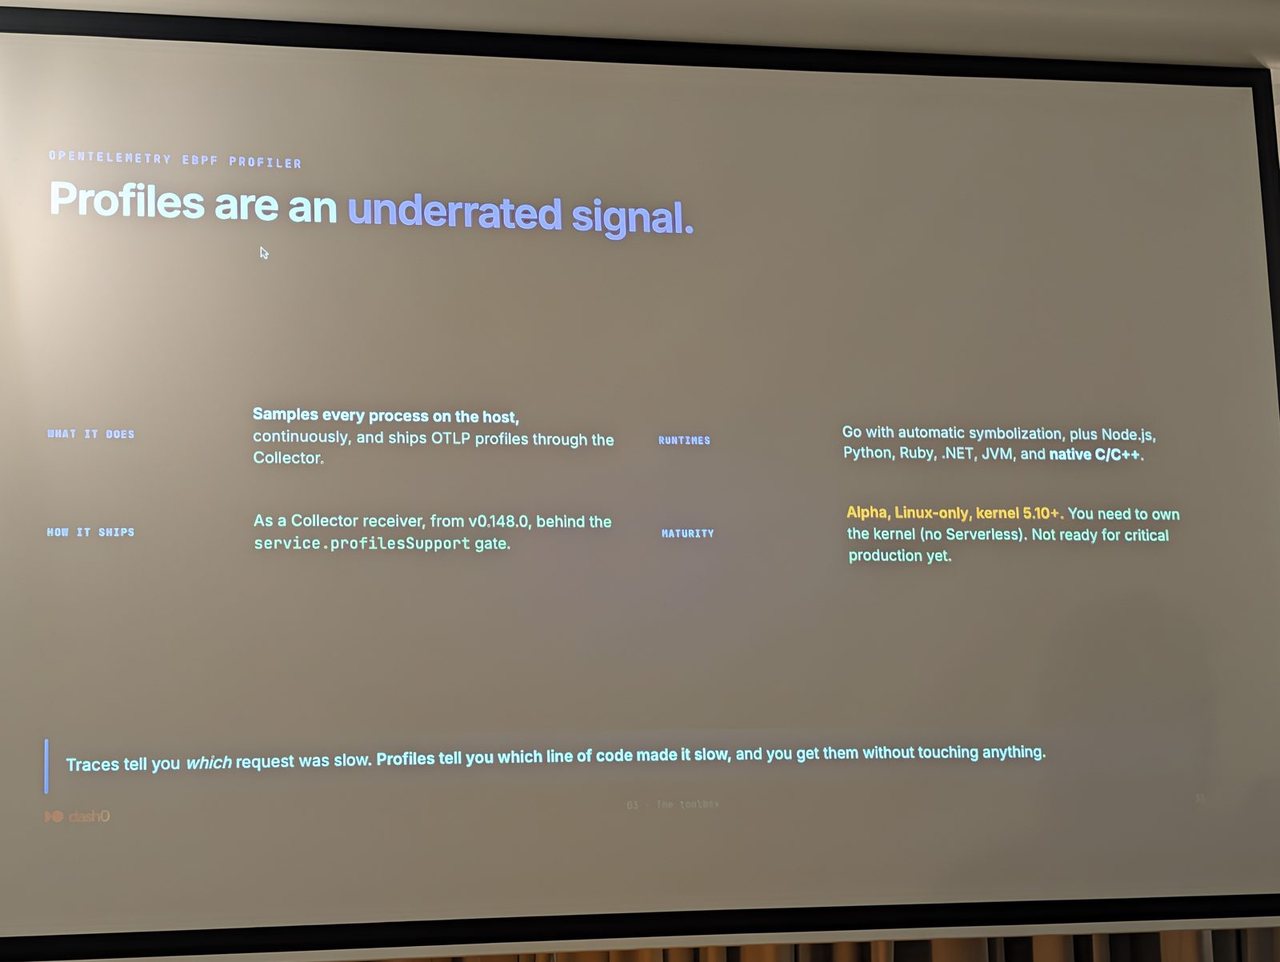
The eBPF profiler samples every process on the host and ships OTLP profiles through the Collector. It is alpha, Linux-only, kernel 5.10 or later, and not for critical production yet. Its slide had the line I took home: traces tell you which request was slow; profiles tell you which line of code made it slow. Michele’s advice to the juniors in the room was to collect a profile, give it to an AI, and come back with an application twice as fast. The overhead is small, and you don’t leave it on: turn it on, see what is burning, fix it, turn it off.
Which one, then?
The decision slide, with its warning that some people may disagree: a runtime the injector supports gets the injector (through the Operator on Kubernetes, through the packages on a host); your own Go code gets compile-time instrumentation; your own Rust or C++ gets no agent, so you write the instrumentation and let an agentic skill do the typing; anything else, a vendor binary or a service nobody owns any more, gets OBI. Dash0 publishes those skills, OpenTelemetry Skills for AI Coding Agents, vendor-neutral and under the Apache 2.0 licence. Without them, Michele said, the coding agents do a terrible job of adding OpenTelemetry; with them, a great one.
The AMA, with hot sauces
After the break came the hot-sauce AMA, in the style of a well-known YouTube show: each question came with a hotter sauce, for Michele and anyone brave enough to follow. A few of the answers:
- Observability or monitoring? Observability is a property of a system, a term from control theory: knowing what the system is doing. Collecting telemetry about it is monitoring.
- A vibe-coded app with five users? If it does something important, it is worth monitoring, whatever the number of users. Logs and metrics may be enough; add traces when the application gets complex, and website monitoring as soon as it has a UI, “because you want to know if the checkout button exists”.
- Too much data? First throw away the garbage: debug logs, and the readiness and liveness checks that are uninteresting 99.99% of the time. Then turn data into metrics, sample traces (head-based, deciding when the trace starts, or tail-based, deciding afterwards), and aggregate in time and in space. The classic mistake is the client IP as a metric dimension: as many series as customers.
- Our own semantic conventions? Ask first whether only your company needs them; most of the time, that is the answer. Weaver codifies them, and its live check compares a sample of the real telemetry with the model, to find the services still on an older version.
- Upgrades that break dashboards. When an instrumentation moves to a newer version of the semantic conventions, attribute names change, and so can units: an alert on a duration can stop firing because the numbers are now a thousand times smaller. OTTL, the OpenTelemetry Transformation Language, can bridge the transition, and Michele was surprised that almost nobody tests the shape of their telemetry; it should be a basic unit test.
- How does OpenTelemetry decide? By consensus. Neither of its two committees has much power to enforce anything, so it runs on good arguments, good communication and reputation.
Dash0 closed the AMA with a gift: backpacks, ordered to your home with a QR code. Then came the pub quiz, to “find out how much of this knowledge rubbed off”. Thanks to the SRE NL organisers and to Dash0 for the evening.