On Tuesday 28 October 2025 I spent the whole day at ClickHouse Open House Amsterdam, held in a chandeliered ballroom at ARTIS (you could read the ARTIS lettering through the windows). The ClickHouse timeline in the keynote listed “OPEN HOUSE Amsterdam” as its October 2025 milestone, right after Open House SF in May. The day had two halves: a technical workshop in the morning, then a keynote and four deep-dive sessions, each with a customer.
The agenda slide, “Day at a glance”, listed:
- 1:30 PM: Welcome & Keynote
- 2:45 PM: Deep-Dive: Real-Time Analytics (ft. Picnic)
- 3:15 PM: Deep Dive: Observability (ft. Lovable)
- 4:00 PM: Deep Dive: Data Warehousing (ft. Silverflow)
- 4:30 PM: Deep Dive: Infrastructure for AI and ML (ft. Langfuse)
- Networking, drinks & bites
I’ve written up a later ClickHouse evening, the ClickHouse Amsterdam Meetup at Adyen, and a hands-on guide to ClickHouse full-text search with the text index. This post covers the 2025 Open House from the slides I photographed and the short video clips I recorded from my seat during the talks. I only name speakers whose names were on a slide.
The morning: MergeTree from the ground up
The morning was a cut-down version of ClickHouse’s own training. The trainer said the full course has ten modules and takes about twelve hours, so the plan was to get through the first three and take questions on anything else. The session had recently been renamed “Real-time Analytics”, after one of the ClickHouse use cases.
The introduction started with where the name comes from. ClickHouse’s first use case was a clickstream data warehouse (“think Google Analytics”) that Alexey Milovidov started building at Yandex in 2009. It went into production in 2012 and became open source in 2016, which matches the timeline slide. The point the trainer stressed most was that ClickHouse is an OLAP database, not an OLTP one like Postgres, Oracle or SQL Server: you don’t use it to track bank balances, you use it to answer questions over very large amounts of data. The comparison: moving between transactional databases is like driving a different car, but “ClickHouse is not a car, it’s like flying an airplane”. That’s why the course explains the architecture before it shows a single CREATE TABLE.
The use-case tour covered real-time analytics, observability (“at the end of the day, real-time analytics”), data warehousing and AI/ML. ClickHouse uses its own product as its internal data warehouse, with Salesforce and other company data loaded into one cluster and an AI client on top for questions. For scale, the trainer told the Tesla story: a test that inserted about a billion rows per second until the table reached a quadrillion rows, which took roughly eleven and a half days.
Then came LogHouse, the platform ClickHouse uses for its own Cloud logs, with 128 PB raw data, 8.16 PB compressed (16x) and 574 T events on the slide. According to the trainer, ClickHouse first monitored its Cloud with Datadog, found it too expensive, and took almost two years to move off it onto LogHouse. The trainer added that you should expect 90 to 95% compression out of the box. ClickHouse describes that platform in Scaling our observability platform beyond 100 petabytes.
The demos were in ClickHouse Cloud, starting with a new service created live: choose AWS, GCP or Azure and a region, then the number of replicas (compute nodes) and a minimum and maximum size for autoscaling. You choose CPU and memory, never storage. The Connect button gives code snippets for the native client and several languages. Next came Parquet files on S3, queried without loading them: the s3 table function works out the file format and compression from the extension. The dataset was the public PyPI downloads, the same one behind ClickHouse’s live ClickPy dashboard, which was close to two trillion rows. A GROUP BY project over the 2023 files with s3Cluster(...) read 513,519,979 rows (44.96 GB) in about 6.1 seconds, with boto3 at the top of the list. Later, the trainer opened the SharedMergeTree docs page, the cloud-native replacement for ReplicatedMergeTree that ClickHouse Cloud runs on shared object storage.
The rest of the morning was the core of how MergeTree works:
- Row-oriented versus column-oriented storage. In ClickHouse each column of a part is its own file on disk (
id.bin,price.binand so on), so an average over billions of prices only reads one file. The trainer would expect an average over four billion rows to take a second or two. Then parts, and how merges remove the old parts. - Partitions: “small inserts are not great”, and with a high-cardinality partition key there are too many partitions, even after merges.
- PRIMARY KEY vs ORDER BY: “they can be used interchangeably”, unless you want a sort order that extends the primary key.
- Primary key best practices: the choice “has a huge impact on performance”; use columns that are frequently queried, in ascending order of cardinality (lower-cardinality columns first).
- Options for a second access path: a second table, a projection (ClickHouse keeps a hidden, differently sorted copy), a materialized view, or a skipping index.
- An AggregatingMergeTree example on UK property prices, with
AggregateFunction(quantiles(...)),AggregateFunction(avg, UInt32)andSimpleAggregateFunction(max, UInt32)columns, filled by an incremental materialized view that keeps the average, the maximum and the 90th-percentile price for every district in the UK.
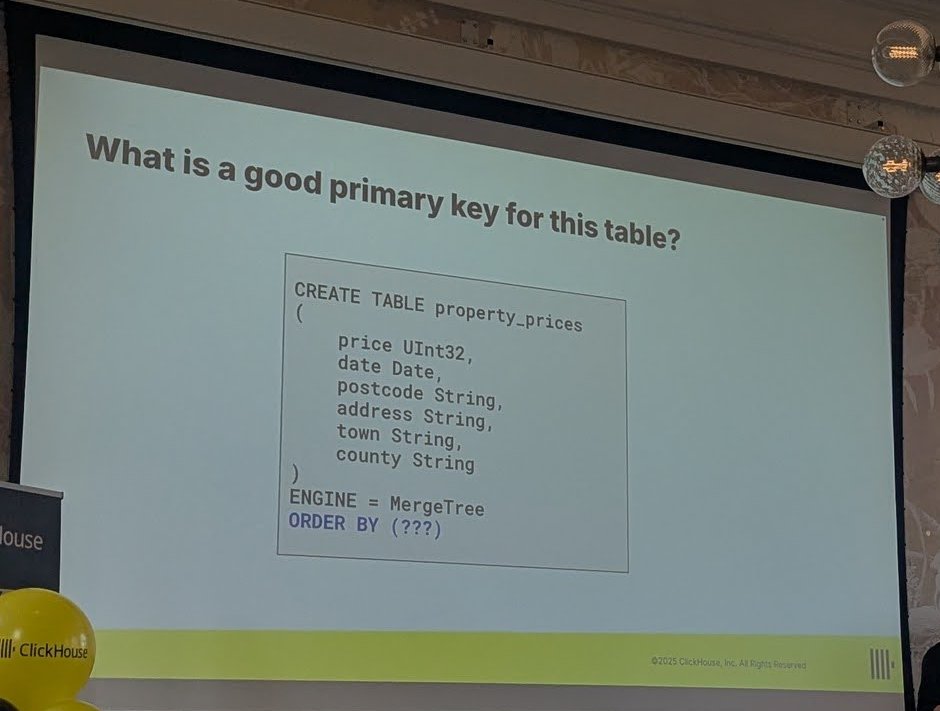
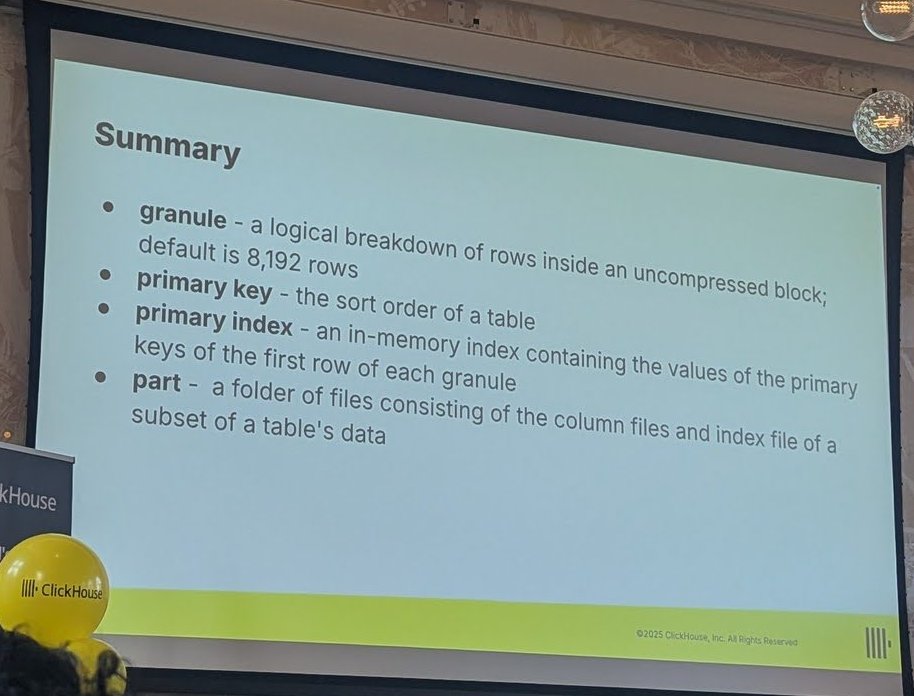
The primary-key exercise, and the summary slide: granule, primary key, primary index, part.
The way the trainer explained granules made the summary click for me. ClickHouse never touches one row at a time: it reads data in chunks of 8,192 rows, and a granule is “the smallest amount of data” it will bother reading. The primary index only stores the key of the first row of each granule, so when a query filters on the leading primary-key columns, ClickHouse can skip every granule whose range can’t match.
The summary slide is worth keeping. A granule is a logical block of rows (8,192 by default), the primary key is the sort order, the primary index is an in-memory index with the key values of the first row of each granule, and a part is a folder of column files plus the index for a subset of the table. ClickHouse’s own guide to sparse primary indexes goes through this in detail. It’s also the same model the text index builds on.
Keynote: 0 to 30 PB, and a lot of launches
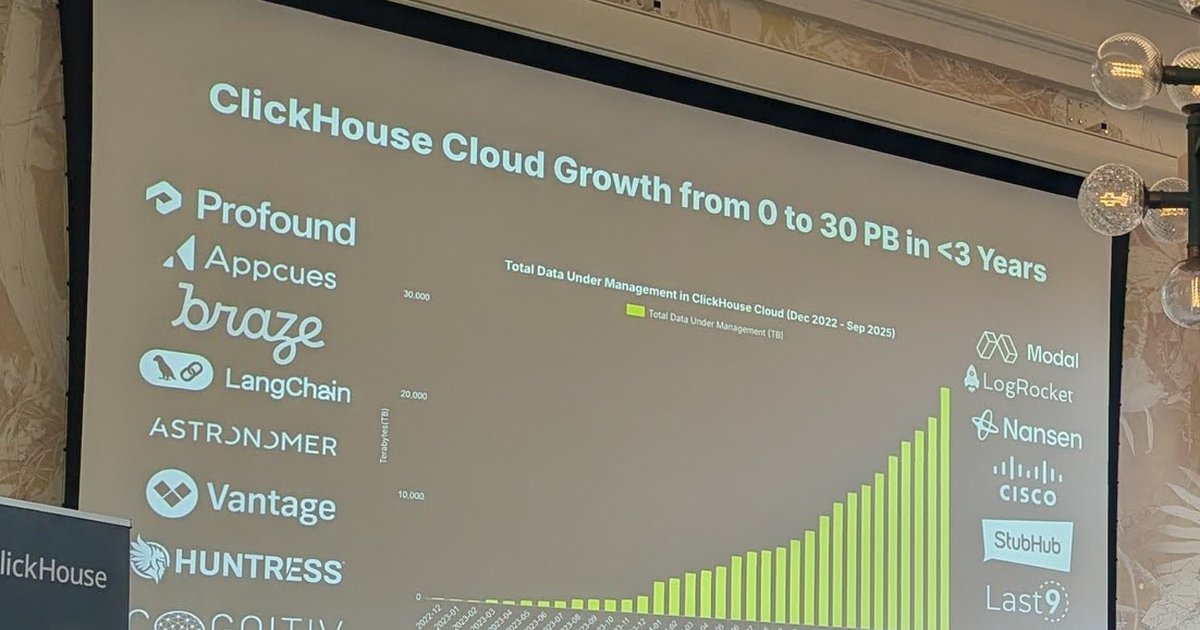
The keynote opened with the company: ClickHouse Inc., “350 employees across 20 countries” (40% AMER, 45% EMEA, 15% APAC), with Aaron Katz (CEO), Alexey Milovidov (CTO) and Yury Izrailevsky (President of Product & Engineering) on the leadership slide. The “ClickHouse Journey” timeline ran from the first prototype in 2009 and the Apache 2.0 open-source release in June 2016, through ClickHouse Cloud on AWS, GCP and Azure, to BYOC GA on AWS in February 2025 and a $350M Series C in May 2025.
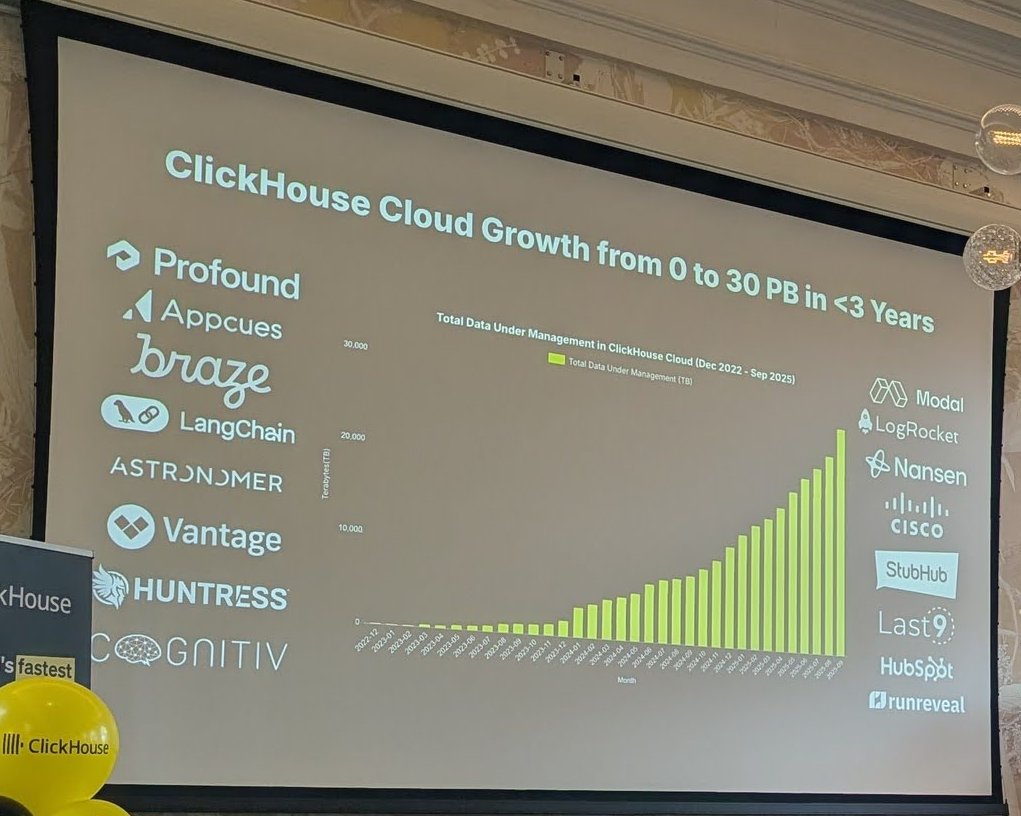
“ClickHouse Cloud Growth from 0 to 30 PB in <3 Years”: total data under management, December 2022 to September 2025.
The part of the keynote I recorded explained what ClickHouse Cloud adds to open-source ClickHouse. When the company was founded in 2021, the speaker said, the goal was to build the best service for the best analytical database. The main architectural difference is the separation of storage and compute, which lets ClickHouse create services quickly and scale them without moving data. It also allows what the speaker called the “separation of compute and compute”: independent warehouses over the same data, one for ad hoc queries, one for inserts, one for real-time selects. Each can be resized on its own, without copying the data, pre-provisioning or pre-sharding.
Then came the use cases. A slide titled Postgres + ClickHouse = “the default data stack” set the theme for the day: keep the transactional database, and move analytics to ClickHouse. The observability section introduced ClickStack, “The ClickHouse Observability Stack”: HyperDX on top of ClickHouse on top of OpenTelemetry, open source across the whole stack, with first-class OpenTelemetry and JSON support. The ClickStack docs describe the same three parts: ClickHouse, the HyperDX UI and a preconfigured OpenTelemetry collector.
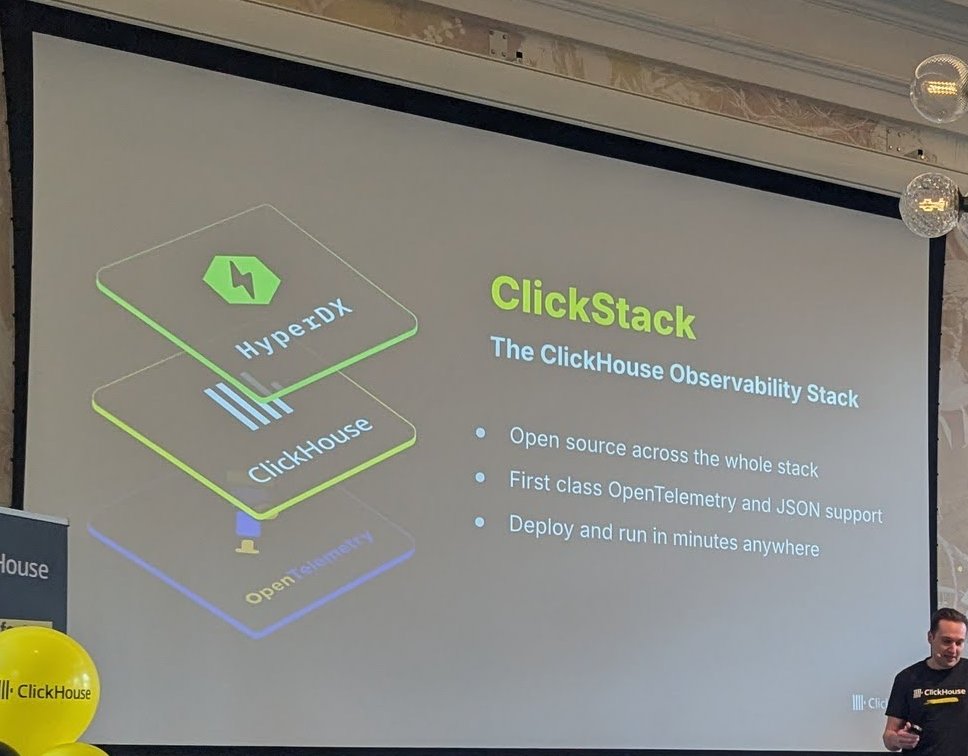
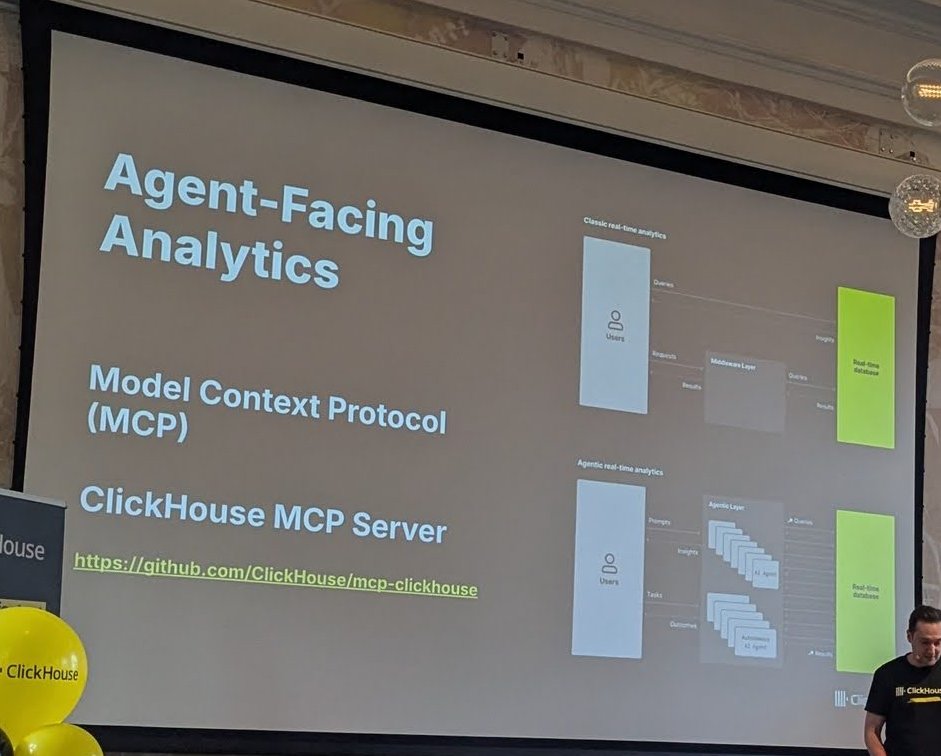
ClickStack for observability, and agent-facing analytics through MCP.
The data warehousing section drew a line from the traditional DWH (30 years ago) to the cloud DWH (10 years ago) to today: analytical databases for interactive apps and dashboards, with open data lake formats as the long-term batch layer. A “Data Lakes Support” slide showed ClickHouse connecting to data lakes (Iceberg among them) through multiple catalogs: Databricks, Snowflake and Glue. For data engineering teams, two numbers: 10x faster Iceberg queries between versions 24.10 and 25.5, and 20x faster JOINs by default between 24.12 and 25.5.
The AI and ML slide grouped customer examples around a feature store, model inference, vector store, data preparation and observability. It also introduced agent-facing analytics: the same real-time database, but with AI agents asking the questions, through the open-source ClickHouse MCP server.
Real-time analytics deep dive: from hit counters to lightweight updates
After a short break, the Real-Time Analytics deep dive opened with a ClickHouse speaker before handing over to Picnic. The speaker started with the 1990s website hit counter, which you refreshed to watch the number go up. Today you want to know who visited, what they did, where they came from and how they behaved, and you want it as the events happen, not “in eight hours” when the batch job finishes. Data volumes grow, queries become multidimensional, and stakeholders expect everything faster, so teams end up trading questions for speed and speed for cost. The message: real-time analytics is not a new problem, but making it work at scale with complex queries is.
The ClickHouse part of the session then covered the core database and Cloud:
- ClickPipes, “turn-key integration engine optimized for scale and performance”: database CDC, streaming and object storage, with “Data Lake CDC soon!”. See the ClickPipes docs.
- Lightweight updates, “immediate updates without compromising query speed”: “Up to 1000x faster updates” and a “15% SELECT latency” impact compared with heavy updates. The diagram showed small patch parts applied to the data parts while the query runs. ClickHouse’s blog series on SQL-style UPDATEs explains the design, and Part 3 has the benchmarks.
- Distributed cache, marked Private Preview: “Building a truly serverless, elastic architecture”. Compute nodes share a distributed cache service in front of object storage, and the slide’s claim was that ClickHouse Cloud “can now hit both SSD-speed and memory-speed latency with zero local storage”. The benchmark on the slide compared a self-managed server with gp3 SSD with a Cloud node on an S3 bucket. The design is described in Building a distributed cache for S3.
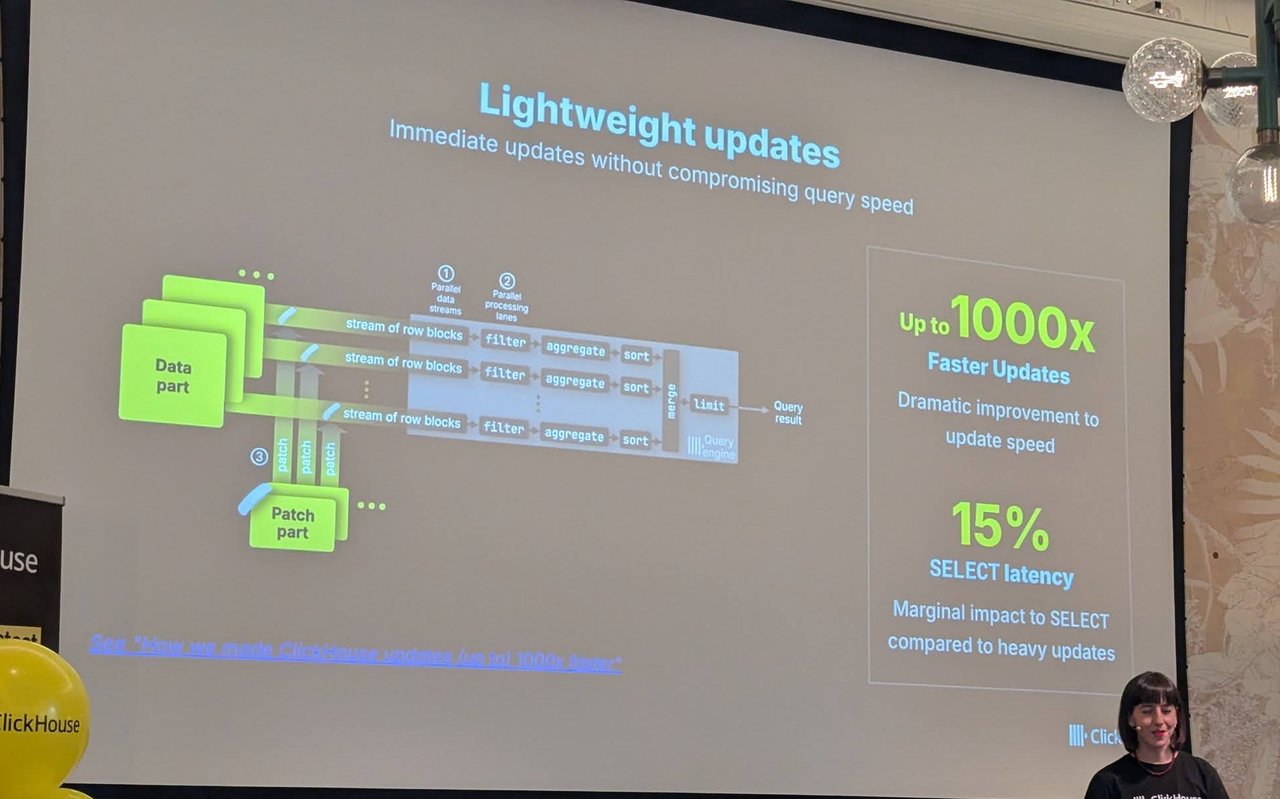
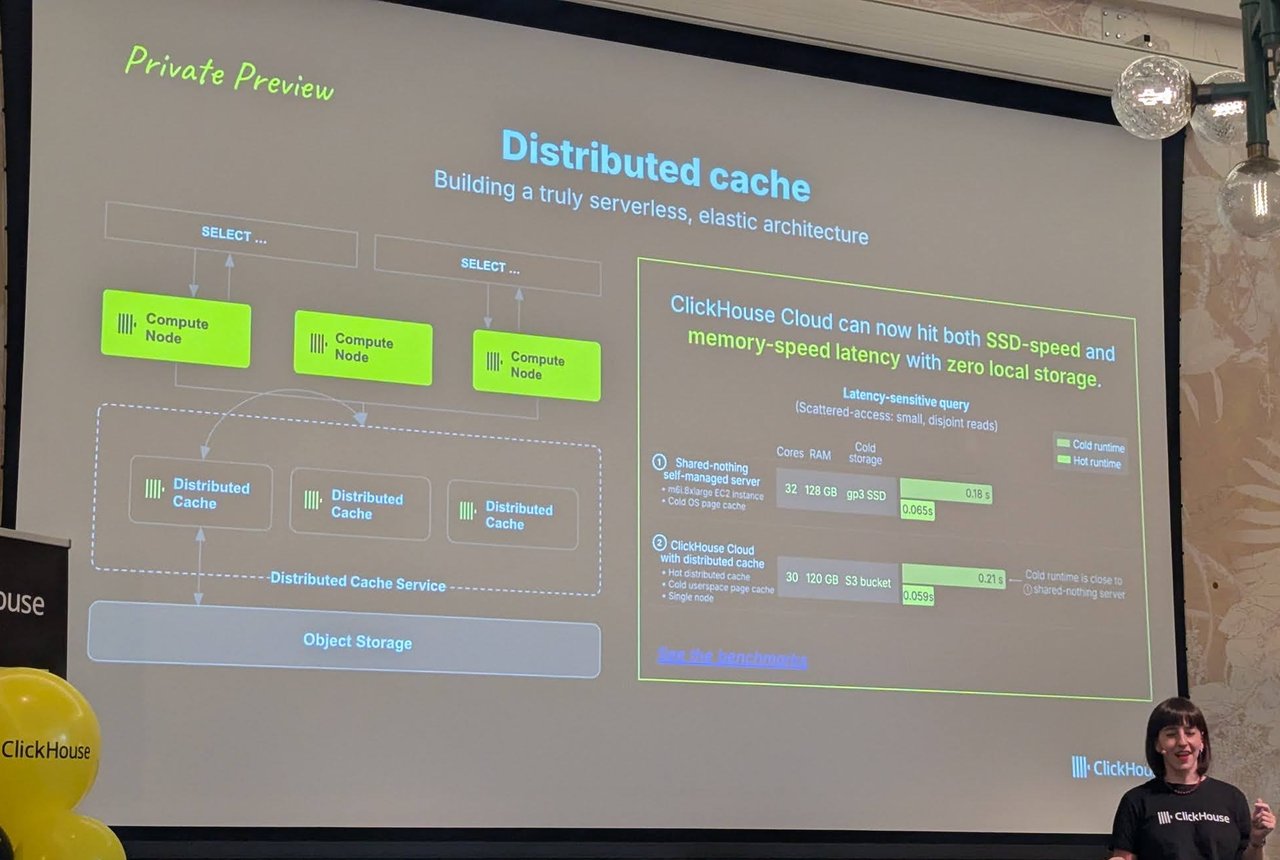
Lightweight updates with patch parts, and the distributed cache for ClickHouse Cloud.
Picnic: real-time supply chain dashboards with per-user security
The customer half of Real-Time Analytics (ft. Picnic) was my favourite talk of the day. It showed how Picnic runs live supply chain dashboards on ClickHouse, and, more interesting to me, how it controls who sees which rows.
The first screens were Grafana dashboards: “Real time observability into supply chain operations”, with panels per temperature zone (AMBIENT and CHILLED), progress against target, picking shoppers, and how much was done in the last 30 minutes. The “Visualization layer” slide showed the pipeline: a system of record in an event-sourcing layer, a transport layer with RabbitMQ, Kafka and HTTP, a Java ingestion process, ClickHouse materialized views for event processing, ClickHouse as the serving layer, and Grafana renders visualizations from ClickHouse data at the end.
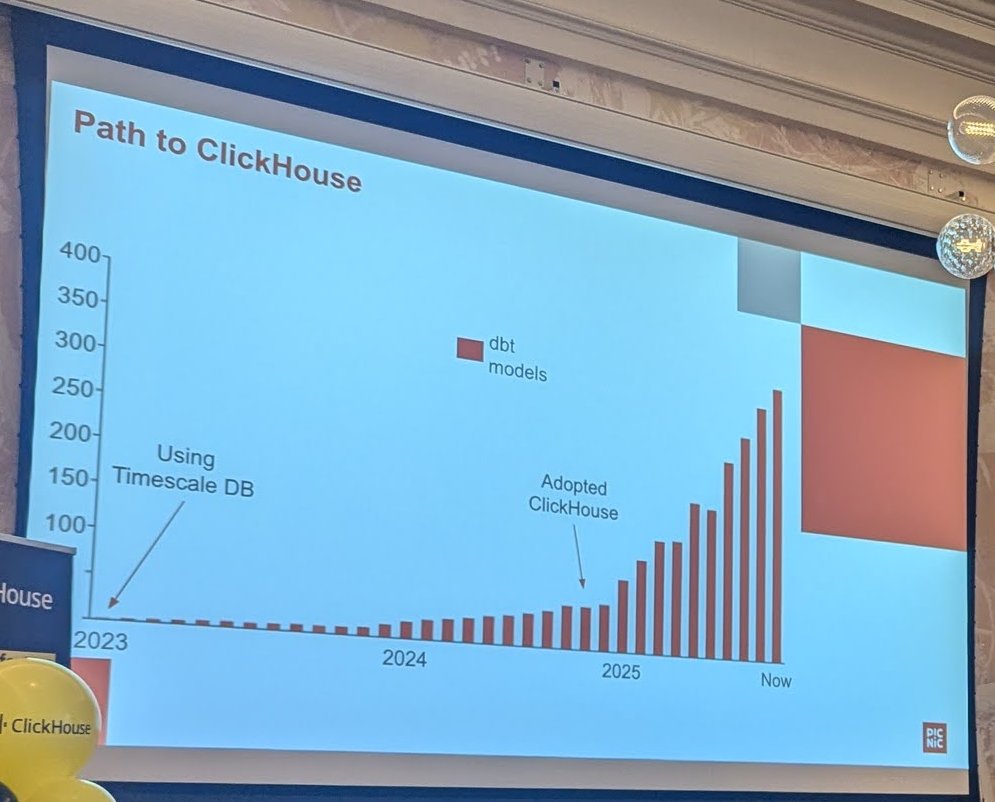
“Path to ClickHouse”: dbt models over time, from Timescale DB in 2023 to roughly 250 after adopting ClickHouse.
The “Path to ClickHouse” chart counted dbt models. It started in 2023 with the label “Using Timescale DB”, stayed flat through 2024, and climbed steeply after the “Adopted ClickHouse” marker in 2025, reaching about 250 at “Now”.
Authentication: the Grafana user header
The security part was simple and clever. Grafana sits in front of ClickHouse with a shared service user, so how does ClickHouse know which person is looking at the dashboard? The “Authentication” slide answered in two steps:
- ClickHouse function:
SELECT getClientHTTPHeader('X-Grafana-User') - Grafana forwards the header with the authenticated user. Picnic uses Keycloak for Grafana access.
The getClientHTTPHeader function returns the value of an HTTP header from the current request. The ClickHouse docs note that it only works when the allow_get_client_http_header setting is enabled, and that this setting is off by default because headers such as Cookie can hold sensitive data.
Authorization: row policies generated by dbt
The “Authorization” slide had two bullets: replicate user permissions as a ClickHouse dictionary, and use a dbt script to automatically create a row policy tailored for each table. The diagram showed user records (email, roles, locations) flowing from Keycloak through an event-sourcing Java app into ClickHouse, into a MergeTree table and a dictionary.
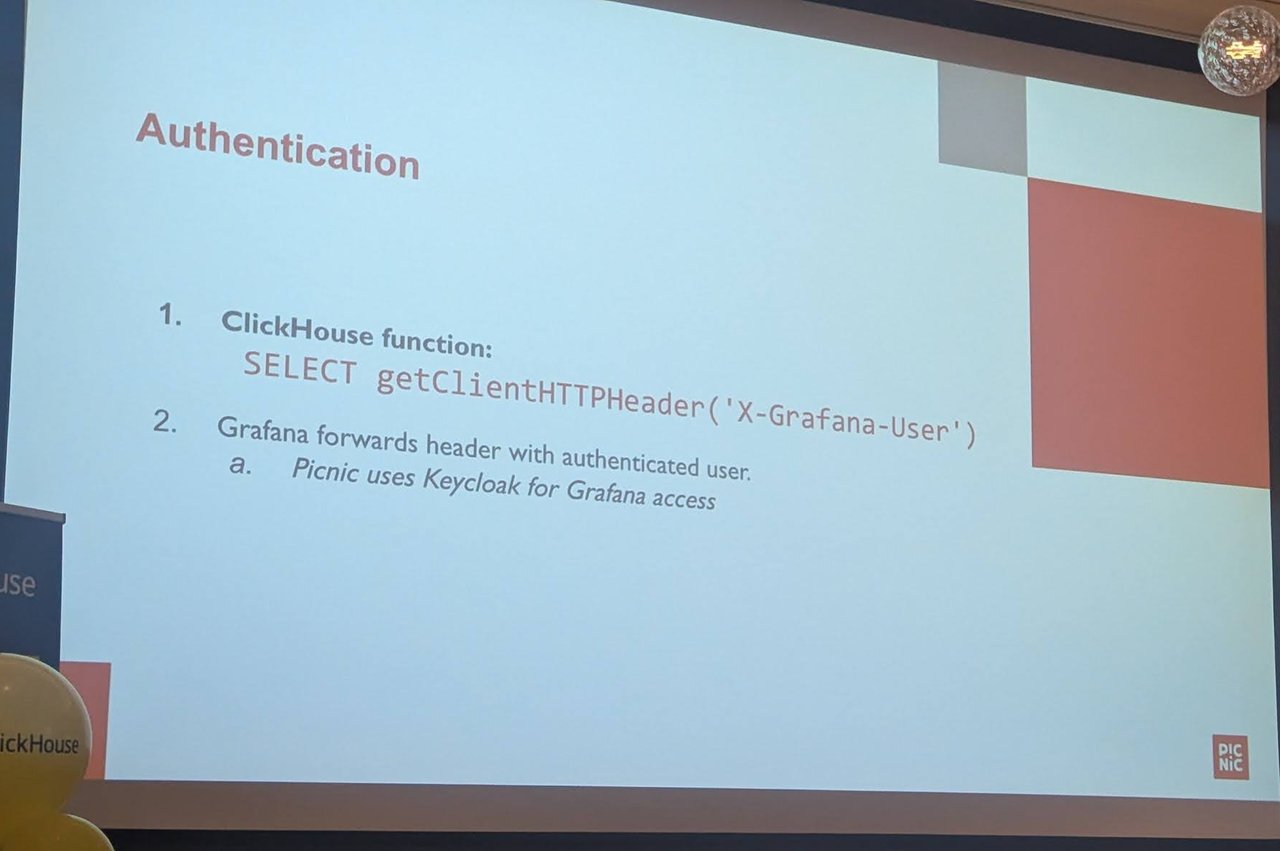
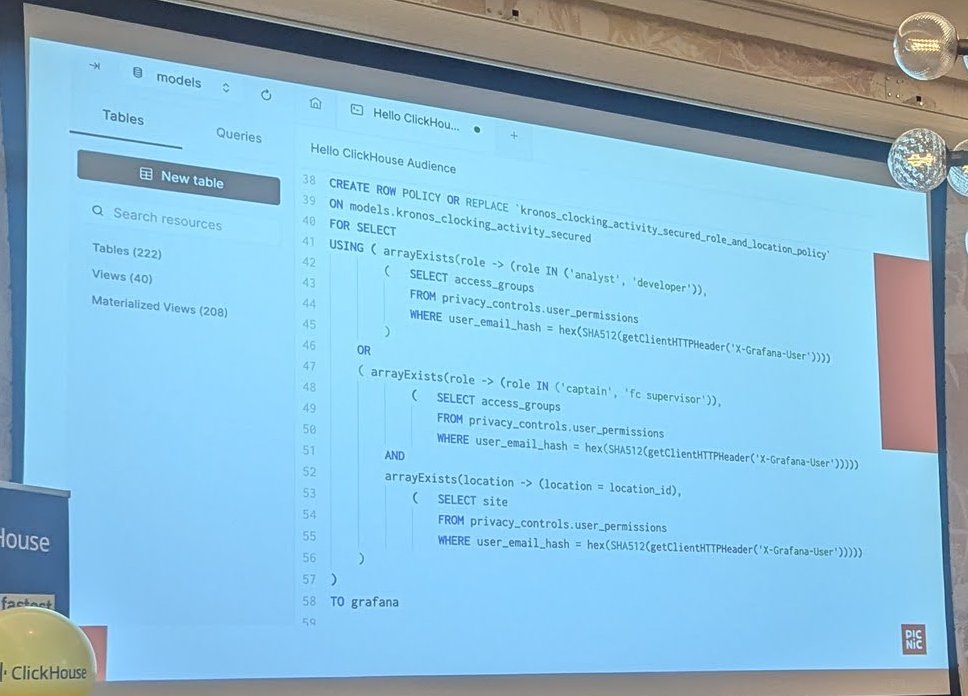
The header that identifies the user, and one of the generated row policies.
The generated policy on screen was a CREATE ROW POLICY OR REPLACE ... FOR SELECT ... TO grafana on one of Picnic’s models. Its USING clause had two branches:
- If the user’s access groups contain
analystordeveloper, they see every row. - If they contain
captainorfc supervisor, they see a row only when itslocation_idis one of the user’s sites.
Both branches look the user up in a privacy_controls.user_permissions table, matching on hex(SHA512(getClientHTTPHeader('X-Grafana-User'))), so the permissions table stores a hash of the email address, not the address itself. The console sidebar in that demo listed 222 tables, 40 views and 208 materialized views. With that many objects, generating the policies from dbt rather than writing them by hand makes sense. ClickHouse’s row policy docs cover the syntax.
My take: I like this pattern a lot, because the dashboard tool doesn’t need to know anything about data access, and the rules live next to the data. One thing I’d add when copying it: the header is only as trustworthy as the path it comes from. Grafana adds X-Grafana-User to data source requests when send_user_header is enabled. Anyone else who can reach ClickHouse over HTTP with the grafana user’s credentials can send the same header. So keep that ClickHouse user’s password only in Grafana, restrict where it can connect from, and check that your Grafana data source plugin actually forwards the header before you rely on it. This is the same trust-boundary question I raise when I set up Keycloak in front of Kubernetes services.
Observability: ClickStack, Lovable, and ClickHouse for AI/ML
The Observability (ft. Lovable) deep dive started with “A brief history of observability” and a slide summarising ClickHouse for observability: SQL, < 500 ms on 50 PB+, 4x more telemetry with the same hardware, JSON schema-less storage, 10x to 100x compression ratios, OpenTelemetry, compute-storage separation, compute-compute isolation and open formats (Parquet, Iceberg, Delta). A customer slide quoted character.ai: “With ClickHouse Cloud, we ingest 10x more data – over 450 TB every month – while spending 50% less than before.”
The ClickStack demo
Then came a live demo of ClickStack. Besides a Helm chart and separate images per component, there is an all-in-one image with HyperDX, ClickHouse and the OpenTelemetry collector, started with one command: you create a user, export the ingestion key and send OpenTelemetry data to the collector endpoint. The speaker pushed a public sample OpenTelemetry dataset with a small bash script, and it showed up in HyperDX straight away as log, trace and metric sources.
The more interesting part ran on ClickHouse’s public demo instance, with the OpenTelemetry demo shop as the workload:
- Filter to a spike of errors, then press Event patterns, which clusters the log lines and shows how each cluster changes over time, instead of reading the errors one by one.
- Open one error from the payment service and jump to its trace, its spans and the Kubernetes CPU, memory and disk metrics of the infrastructure it runs on, because logs, traces and metrics all live in the same database.
- Out-of-the-box APM views (services, error rates, latencies), a Kubernetes view of nodes, namespaces and events, and an analysis that samples spans to find which columns explain the slow ones.
- Text-to-chart, released the week before according to the speaker: type “show me the average duration of all services over time”, an LLM writes the SQL, and HyperDX renders the chart. You can also search with Lucene syntax, or drop down to full SQL.
The speaker also said customers such as Anthropic are testing it at very large scale, which helps make the queries as efficient as possible. The demo ended in ClickHouse Cloud, where a ClickStack entry in the service sidebar (private preview at the time) launched HyperDX already connected and authenticated to that service, and created the sources when it found OpenTelemetry data.
Lovable: observability for a non-deterministic system
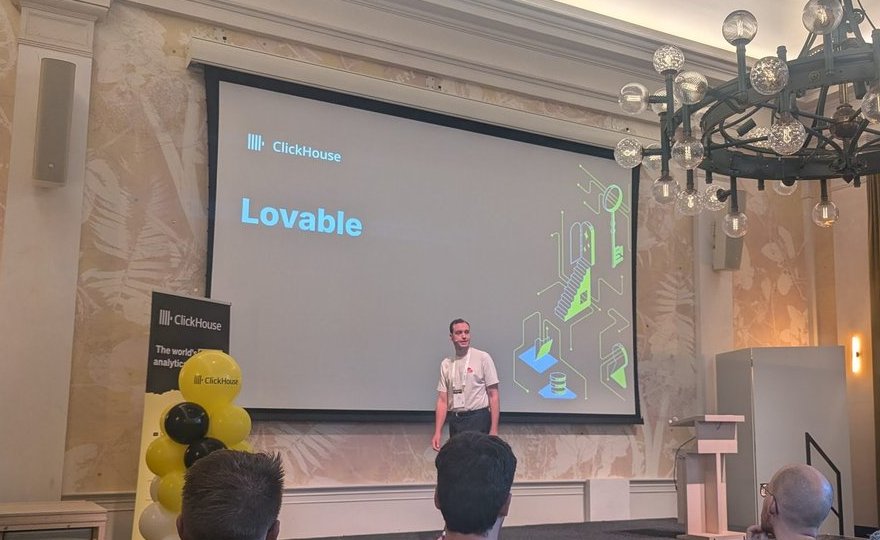
The customer half of the observability deep dive: Lovable.
The Lovable speaker described the product as an AI-powered platform that builds web apps from prompts, all the way to deployed production apps. Users can prompt for anything, so it’s “quite a stochastic system”, and that’s why they need better observability. They use ClickHouse in two ways: observability, the main one, and web analytics for their users’ apps.
For observability, logs from their microservices and Kubernetes clusters go into ClickHouse, with Grafana dashboards on top. The hard part is in between: LLM calls to and from external APIs, with users trying things the team didn’t expect. Here the speaker said the ClickHouse MCP server had been the biggest help. Engineers who aren’t SQL experts ask an AI assistant what’s going on; it takes the latest git commits and the schema of the logs table as context and queries the logs for them. The example was working out that a user’s app was trying to integrate Stripe with a particular product ID.
The second use case was web analytics for the apps Lovable’s users deploy. Events from those apps go straight into ClickHouse, into a service with only a handful of tables, materialized views and aggregating tables. Visitors, sessions, bounce rates, referrers and devices come back in around 50 ms, the speaker said, and one engineer built it in one week, with no pain points so far.
The third was security scanning. Acknowledging that vibe-coded apps have a reputation for being insecure, Lovable runs an agent that scans published apps for exposed secrets and RLS issues, writes the findings to ClickHouse as log events, and uses a refreshable materialized view every hour to decide which app owners should get an email about an issue. The closing idea was that you shouldn’t need to be a database expert, as long as an AI can handle the database for you.
My take: letting an assistant query production logs through MCP is the most practical agent use case I saw that day, and it’s the same pattern I’d build for a platform team. Do it with a dedicated read-only ClickHouse user, a settings profile that caps execution time and memory, and access to the log tables only. The LLM writes the SQL, but ClickHouse decides what it’s allowed to run. The hourly refreshable materialized view for the security findings is a nice touch too: a scheduled job inside the database, with no extra orchestrator.
I have no photos or recordings from the Silverflow data warehousing deep dive, so I’ll leave it out.
ClickHouse for AI / ML
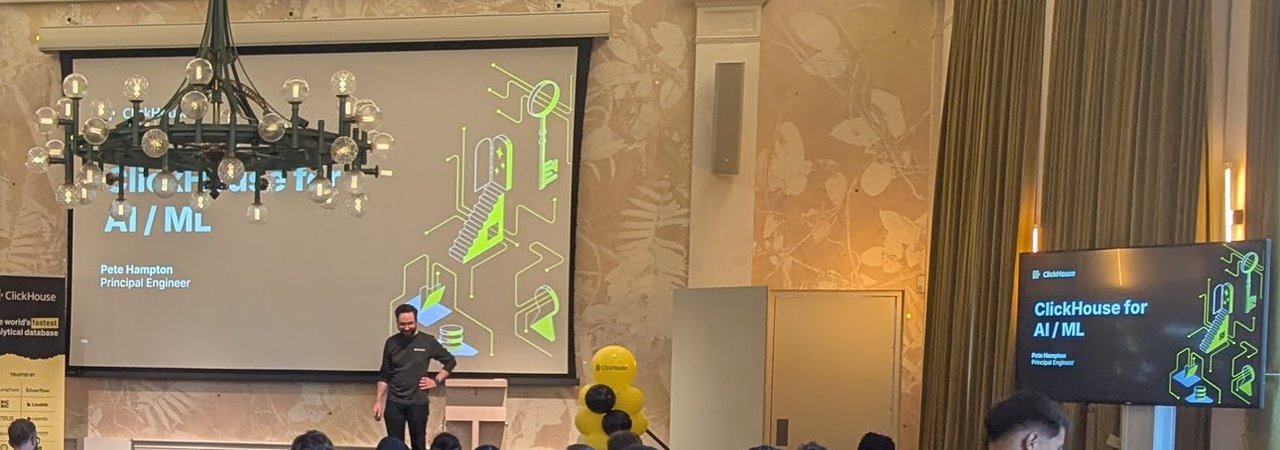
“ClickHouse for AI / ML”, Pete Hampton, Principal Engineer, opening the last deep dive.
The last block, Infrastructure for AI and ML, opened with Pete Hampton (Principal Engineer, ClickHouse) on ClickHouse for AI / ML. The slides I caught:
- “Real-time analytics needs… always fresh data, with blazing fast queries, and scalability to thousands of users.”
- “Vector similarity index now generally available”: a
vector_similarity('hnsw', 'L2Distance')index on a MergeTree table, which “also supports BFloat16 (default) and int8 quantization”. The vector search docs list it as available from version 25.8. - A fully managed remote MCP server: no infrastructure to set up, built into ClickHouse Cloud, secured with OAuth, and usable from your own MCP-compatible client (Claude, Cursor, Windsurf and others). The remote MCP docs describe the same service.
Langfuse: scaling LLM observability from Postgres to ClickHouse
Then Max Deichmann, co-founder & CTO of Langfuse, gave the last talk of the day: “Scaling an LLM Observability platform from Postgres to Clickhouse”. The next slide introduced Langfuse as the “Open Source LLM Engineering Platform”: traces, evals, prompt management and metrics to debug and improve your LLM application.
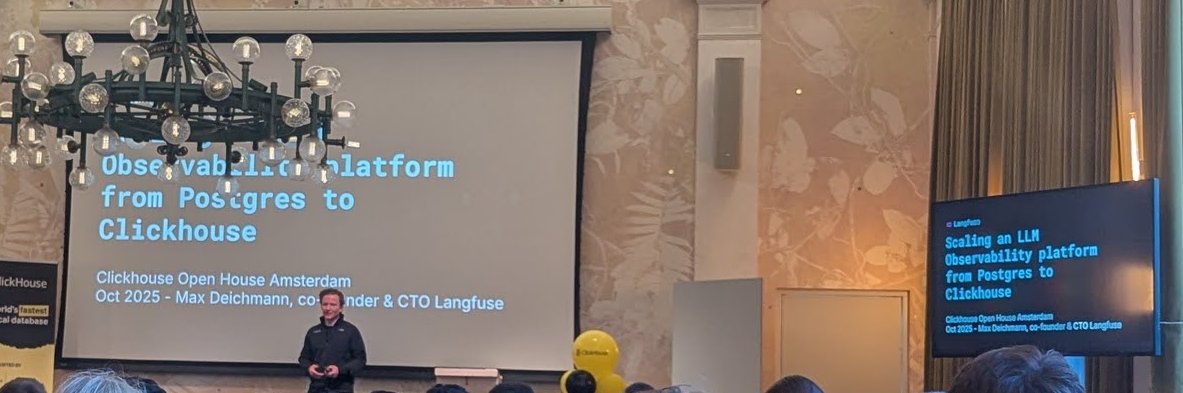
“Scaling an LLM Observability platform from Postgres to Clickhouse”, Max Deichmann, co-founder & CTO, Langfuse.
I only have the title slides from this talk, so here’s the background from Langfuse’s own documentation rather than from the stage. According to the Langfuse v2 to v3 upgrade guide, Langfuse v3 was released on 6 December 2024 and moved traces, observations and scores from PostgreSQL to ClickHouse. It also added a worker container for asynchronous processing, an S3/blob store for raw events, and Redis/Valkey for queues and caching. The architecture page still keeps users, projects, API keys, prompts and datasets in Postgres, so Langfuse itself runs the “Postgres + ClickHouse” stack from the keynote. In January 2026, a few months after this talk, Langfuse announced it was joining ClickHouse, and said it stays open source and self-hostable with no planned licence changes.
My take: LLM traces fit an OLAP database well: append-heavy, wide, semi-structured, and queried by aggregating over model, cost, latency and score. That’s why I’d rather send them to a columnar store than keep them next to the application’s transactional data. For more on what to measure, see my guide to LLM observability in production. The Postgres + ClickHouse split from the keynote is the same advice I give clients for product analytics: don’t make your transactional database do analytics.
Looking back
Looking at these slides a year later, three things stand out:
- The core database work mattered more than the AI branding. Lightweight updates, the distributed cache and faster JOINs change how you design tables and pipelines. Agent-facing analytics only works if the queries underneath are fast.
- Picnic’s talk was the most reusable. Header-based identity, a permissions dictionary and generated row policies are things you can copy into your own ClickHouse in an afternoon, as long as you secure the header path.
- The Langfuse talk foreshadowed the acquisition. A customer explaining why it moved its core data store to ClickHouse ended up, less than three months later, as part of the company.
Related
- ClickHouse Amsterdam Meetup @ Adyen: AI Agents Meets Real-Time Analytics
- ClickHouse Full-Text Search: Text Index and Tokenizers
- Model Observability: Monitoring LLM Performance in Production
- What ‘Agent Engineering Platform’ Actually Means for Production AI
- Keycloak: Identity & Access Management on Kubernetes