ClickHouse full-text search used to mean a bloom filter index and some luck. Since the text index became generally available, ClickHouse has a real inverted index: a dictionary of tokens and a posting list of matching rows for each one. This guide covers how it fits into ClickHouse’s granule-based storage, how to choose a tokenizer, which functions use the index, how to prove with EXPLAIN that it’s being used, and where it stops being a replacement for a search engine.
What got me looking at this was the ClickHouse talk in the Databases devroom at FOSDEM 2026, which I wrote up in my FOSDEM 2026 devroom talks recap. The talk explained granules (“the smallest indivisible data unit processed by the scan and index lookup operators”) and showed one log line split by four different tokenizers. Everything below comes from my own test runs, not from the talk.
Versions. I checked everything against the current clickhouse.com/docs pages (text indexes, skipping indexes, MergeTree, string search functions, EXPLAIN) and the changelog, where the latest release is 26.9. The docs say text indexes are GA from 26.2. I ran every example on clickhouse/clickhouse-server:latest in Docker, which reported version 26.9.8.3, on a laptop. Take the timings as relative numbers, not as benchmarks.
Granules and skipping indexes in ClickHouse
A MergeTree table is stored as parts, and each part is cut into granules. With the default index_granularity = 8192, a granule is 8,192 rows. The primary index keeps one entry per granule, so ClickHouse never finds a single row directly. It finds the granules that might contain the row, reads them and filters them.
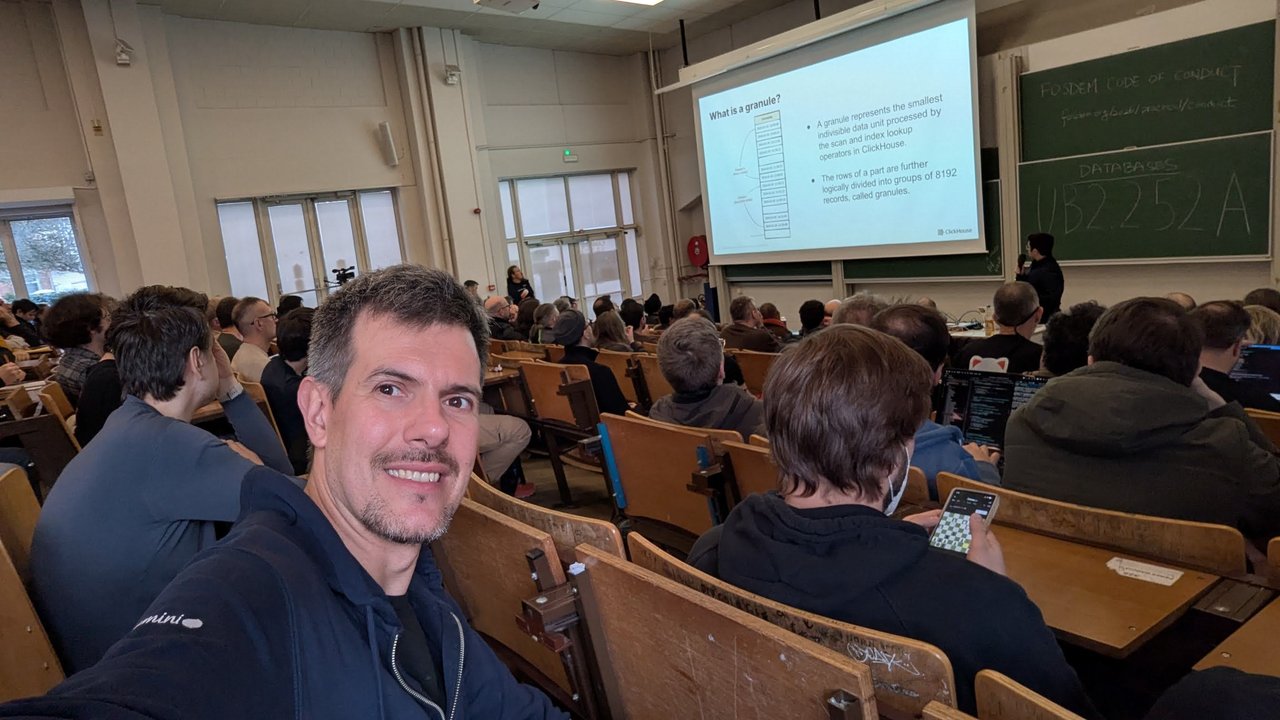
A slide from the ClickHouse talk in the Databases devroom at FOSDEM 2026: “What is a granule?”, with the rows of a part divided into groups of 8192 records. That’s me in the foreground.
A data skipping index works at the same level. You declare it as INDEX name expr TYPE type(...) [GRANULARITY n], where GRANULARITY (default 1) is the number of granules per index block. For each block the index stores a summary, such as a min/max, a set or a bloom filter. At query time, ClickHouse skips any block whose summary proves the WHERE clause can’t match. The skipping indexes docs give the arithmetic: with 8192-row granules and GRANULARITY 4, each indexed block is 32,768 rows.
The search problem is easy to see. A filter on a token in a free-text column doesn’t line up with the sort key, so without an index ClickHouse has to read every granule of the message column.
The text index: syntax and how it’s stored
The text index is an inverted index. You define it like any other skipping index:
CREATE TABLE logs
(
    ts      DateTime64(3),
    service LowCardinality(String),
    level   LowCardinality(String),
    message String,
    INDEX idx_msg message TYPE text(tokenizer = splitByNonAlpha)
)
ENGINE = MergeTree
ORDER BY (service, ts);
tokenizer is the only required argument. The optional arguments include preprocessor (an expression applied to the string before tokenizing, for example lower(message)), postprocessor, dictionary_block_size, posting_list_block_size, posting_list_codec and support_phrase_search. The last one is experimental and needs the allow_experimental_text_index_phrase_search MergeTree setting.
There are two differences from the older skipping indexes:
- It’s per part, not per granule. The docs say text indexes “use an infinite granularity (100 million)”. In my test,
system.data_skipping_indicesshowedgranularity: 100000000. - It stores rows, not hints. Each part gets a dictionary of sorted tokens (
.dct), a sparse header over the dictionary blocks (.idx) and posting lists stored as roaring bitmaps (.pst). A lookup returns exact row numbers, which ClickHouse turns into the granules it has to read.
On 26.2 and later you don’t need any setting to use it. Before that it was experimental, and the 25.11 and 25.12 releases moved it to beta. If you find old examples that use searchAny and searchAll, those functions were renamed to hasAnyTokens and hasAllTokens in 25.10 (ClickHouse PR #88109).
Choosing a tokenizer
The tokenizer decides what a “word” is, so it decides which searches the index can answer. You can test any tokenizer without building an index by using the tokens() function. Here’s a synthetic log line on my 26.9 server:
SELECT tokens('2026.01.31 12:57:01 {8f2c1a90-3b4d-4e5f-9a6b-7c8d9e0f1a2b} <Debug> query finished', 'splitByNonAlpha');
-- ['2026','01','31','12','57','01','8f2c1a90','3b4d','4e5f','9a6b','7c8d9e0f1a2b','Debug','query','finished']

SELECT tokens('2026.01.31 12:57:01 {8f2c1a90-3b4d-4e5f-9a6b-7c8d9e0f1a2b} <Debug> query finished', 'splitByString', [' ']);
-- ['2026.01.31','12:57:01','{8f2c1a90-3b4d-4e5f-9a6b-7c8d9e0f1a2b}','<Debug>','query','finished']

SELECT tokens('<Debug>', 'ngrams', 3);
-- ['<De','Deb','ebu','bug','ug>']

SELECT tokens('2026.01.31 12:57:01 <Debug>', 'array');
-- ['2026.01.31 12:57:01 <Debug>']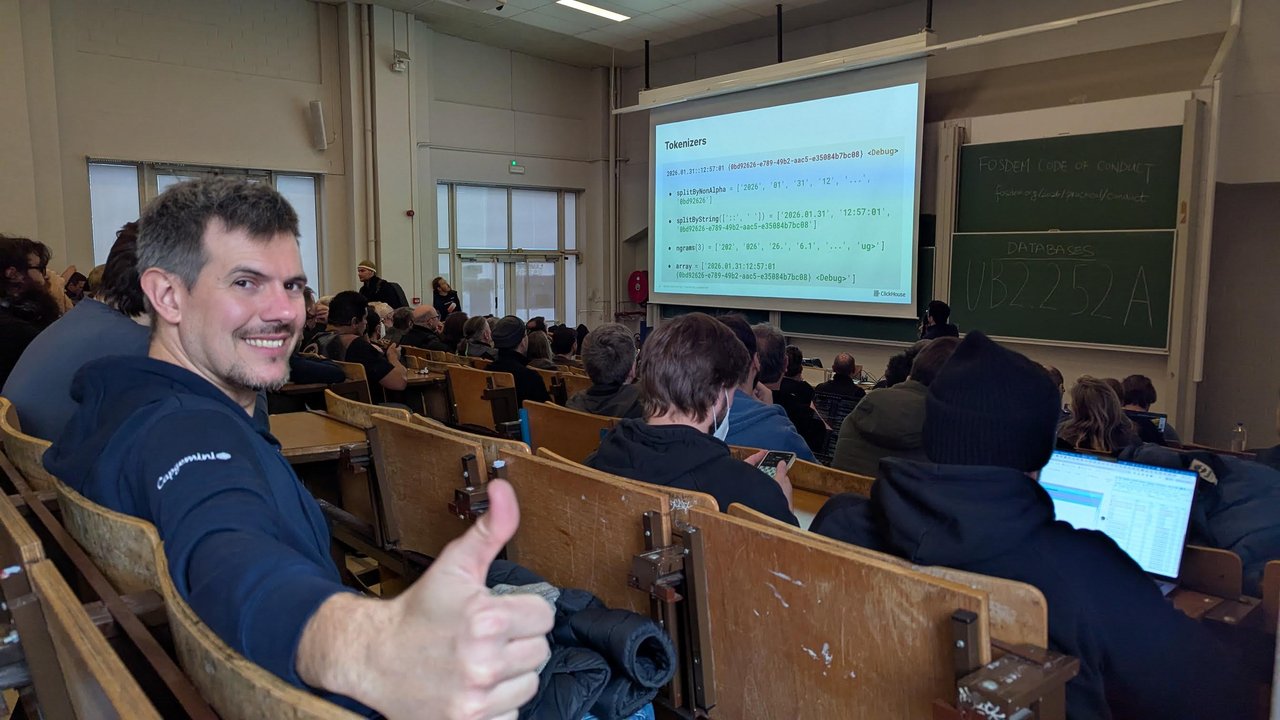
A slide from the ClickHouse talk in the Databases devroom at FOSDEM 2026: the same log line with a timestamp, a UUID and a <Debug> level, tokenized by splitByNonAlpha, splitByString, ngrams(3) and array.
How to pick one:
splitByNonAlphasplits on spaces and punctuation. It’s the default forhasTokenand the right starting point for logs, but it breaks a UUID into five tokens.splitByString(S)splits on the separators you list (default[' ']). It keeps2026.01.31and the whole UUID as single tokens.ngrams(N)(N from 1 to 8, default 3) indexes every N-character substring. It helps with infix searches but creates far more postings.array(aliaskeyword) doesn’t tokenize at all. The whole value is one token, which suits exact matches andArray(String)columns.
SELECT name FROM system.tokenizers lists the rest, including splitByRegexp, sparseGrams, asciiCJK, icu, chinese, japanese and keyValuePairs for Map columns.
Hands-on: 20 million synthetic log lines
I created the logs table without the index, filled it with 20 million generated lines and added the index afterwards. That’s the realistic path for an existing table:
INSERT INTO logs
SELECT
    toDateTime64('2026-01-31 00:00:00', 3) + number / 1000,
    ['api', 'auth', 'billing', 'search', 'worker'][number % 5 + 1],
    ['Debug', 'Information', 'Warning', 'Error'][if(number % 97 = 0, 4, number % 3 + 1)],
    concat(
        ['GET', 'POST', 'PUT', 'DELETE'][number % 4 + 1], ' /v1/',
        ['orders', 'users', 'invoices', 'carts', 'sessions'][(number * 7) % 5 + 1],
        ' status=', toString([200, 201, 204, 400, 404, 500][(number * 13) % 6 + 1]),
        ' duration_ms=', toString((number * 31) % 2000),
        ' request_id=', toString(generateUUIDv4(number)),
        if(number % 1000003 = 0, ' container OOMKilled restarting', ' ok'))
FROM numbers(20000000);

ALTER TABLE logs ADD INDEX idx_msg message
    TYPE text(tokenizer = splitByNonAlpha, preprocessor = lower(message));
ALTER TABLE logs MATERIALIZE INDEX idx_msg;
Twenty lines contain the rare token OOMKilled, and every line has a unique request_id. After OPTIMIZE TABLE logs FINAL there was one part with 2,442 granules. The MATERIALIZE INDEX mutation took 1,013 seconds with a peak memory of 2.48 GiB (from system.part_log). The index came out at 634 MiB compressed, bigger than the 505 MiB of table data, because every UUID adds five tokens that are close to unique. You can check the size with:
SELECT name, type_full, granularity,
       formatReadableSize(data_compressed_bytes) AS size
FROM system.data_skipping_indices
WHERE table = 'logs';
Querying: hasToken, hasAnyTokens, hasAllTokens
The functions that read the index directly are hasToken(col, 'token'), hasAnyTokens(col, needles) and hasAllTokens(col, needles). If needles is a string, it’s tokenized with the index’s tokenizer. If it’s an Array(String), each element is used as a token as it is. With direct read (query_plan_direct_read_from_text_index, on by default), ClickHouse can answer the condition from the posting lists without reading the message column. LIKE, match, startsWith, endsWith, = and IN use the index in hint mode: it narrows the granules and the original condition is still checked.
My measurements, with use_query_condition_cache = 0 set for every query (more on that below). I took read_rows and the duration from system.query_log:
| Query | Index | Duration | Rows read |
|---|---|---|---|
count() where hasToken(message, 'OOMKilled') | text | 1–5 ms | 1 |
| same | use_skip_indexes = 0 | 284–898 ms | 20,000,000 |
3 matching rows, ORDER BY ts LIMIT 3 | text | 5–10 ms | 188,416 |
| same | use_skip_indexes = 0 | 308 ms | 20,024,576 |
hasAllTokens(message, '<one request_id>') | text | 20 ms | 8,192 |
| same | use_skip_indexes = 0 | 1,433 ms | 20,000,000 |
max(ts) where hasToken(message, 'post') (25% of rows) | text | 46 ms | 20,000,000 (172 MiB) |
| same | use_skip_indexes = 0 | 333 ms | 20,000,000 (1.80 GiB) |
Rare tokens are where the index pays off. For a token in a quarter of all rows, every granule still has to be read, but direct read means ClickHouse reads ts instead of message: 172 MiB instead of 1.80 GiB.
Checking index usage with EXPLAIN indexes = 1
Don’t trust a timing until EXPLAIN agrees with it. The EXPLAIN docs say that from 25.9 you need to turn off two caching features for the output to be meaningful:
EXPLAIN indexes = 1
SELECT ts, service, message FROM logs WHERE hasToken(message, 'oomkilled')
SETTINGS use_query_condition_cache = 0, use_skip_indexes_on_data_read = 0;
ReadFromMergeTree (default.logs)
Read type: Default
Parts: 1 | Granules: 20
Output: ts, service, message
Prewhere filter
Prewhere filter column: __text_index_idx_msg_hasToken_6b35ca923fdbf144bf832b00714112e0
Indexes:
PrimaryKey
Condition: true
Parts: 1/1
Granules: 2442/2442
Skip
Name: idx_msg
Description: text GRANULARITY 100000000
Condition: (mode: All; tokens: ["oomkilled"])
Parts: 1/1
Granules: 20/2442There are three things to look for. The Skip block for your index shows Granules: 20/2442. The tokens list shows what the index actually looked up, and here the preprocessor has lowercased it. The __text_index_... virtual column means direct read is on. For a plain count(), the plan is even shorter: ReadFromTextIndexCount (Trivial count from text index ...), which is why that query read one row.
If tokens: [] shows up, or the Skip block is missing, the index isn’t helping that predicate.
The older alternatives: tokenbf_v1 and ngrambf_v1
Before the text index, ClickHouse used bloom filter indexes, one filter per index block:
INDEX idx_tokenbf message TYPE tokenbf_v1(32768, 3, 0) GRANULARITY 1,
INDEX idx_ngram   message TYPE ngrambf_v1(3, 32768, 3, 0) GRANULARITY 1
The parameters are the filter size in bytes, the number of hash functions and the seed, and ngrambf_v1 takes the n-gram size first. The MergeTree docs now say that with the GA of the text index in 26.2, neither is “recommended for full text search”. The skipping indexes page calls them deprecated.
I built all three on a 2-million-row copy (245 granules) and forced each one in turn with ignore_data_skipping_indices. For hasToken(message, 'OOMKilled'), the text index kept 2/245 granules and tokenbf_v1 kept 8/245. The extra granules are bloom filter false positives. For LIKE '%OOMKilled%', both ngrambf_v1 and the text index kept 2/245. A bloom filter can only tell you that a token might be in a block. The text index knows which rows contain it.
Pitfalls I hit
- The query condition cache hides the real cost. My second run of an unindexed
hasTokenquery took 24 ms instead of 915 ms and read 163,840 rows. That was the query condition cache remembering which granules matched, not an index. Setuse_query_condition_cache = 0when you benchmark. - A preprocessor changes the results. With
preprocessor = lower(message),hasToken(message, 'post')returned 5,000,000 rows through the index and 0 rows withuse_skip_indexes = 0. The docs warn that results “may differ between queries that use the text index and queries that do not”. WritinghasToken(lower(message), 'post')gave the right count, but the index didn’t serve it. - LIKE didn’t use the preprocessed index. On the
lower()index,LIKE '%OOMKilled%'showedtokens: []and kept all 2442 granules. On the 2M-row index without a preprocessor, the sameLIKEwas served from the index. - Unique tokens are expensive. Trace IDs and UUIDs made the index bigger than the data and made the backfill slow. If you only look up IDs by exact value, consider a separate column with an
arraytokenizer instead of indexing them as part of the message. mutations_sync = 2can time out the client. Myclickhouse-clientgave up after 300 seconds while the mutation kept running. Watchsystem.mutationsinstead.
ClickHouse text index vs a dedicated search engine
The text index answers “which rows contain these tokens?” hasToken, hasAnyTokens and hasAllTokens return a UInt8, 1 or 0. There’s no relevance score in the string search functions. Elasticsearch, by comparison, scores matches with BM25 by default. So the text index fits log search, observability and analytics workloads, where you filter by tokens and then aggregate with count(), GROUP BY service and time buckets on the same engine. It isn’t built for ranked, typo-tolerant product search.
My take: if you already keep logs in ClickHouse, a text index on the message column will probably replace a separate search cluster for “find the lines with this error or ID”. If users type a query into a search box and expect the best match first, keep a search engine. For the log side of that choice, see my Loki vs Elasticsearch comparison.
Related
- FOSDEM 2026: The Devroom Talks I Saw
- ClickHouse Amsterdam Meetup @ Adyen: AI Agents Meets Real-Time Analytics
- ClickHouse Open House Amsterdam 2025: Picnic and Langfuse
- Fix a Slow PostgreSQL Query Without Changing the SQL
- Loki vs Elasticsearch 2026: Log Aggregation Comparison
- Grafana Loki: Cost-Effective Log Aggregation for Kubernetes