Claude Code OpenTelemetry support is the quickest way to answer the questions every engineering manager asks once coding agents spread through a team: what are we spending, per developer and per repository, and what are we getting for it? Claude Code can export metrics and events over OTLP. Point it at an OpenTelemetry Collector, add the labels your org cares about, and the rest is ordinary Prometheus and Grafana work. This post walks through the whole path, including the delta-temporality details that silently break the numbers if you get them wrong.
During KubeCon Europe 2026 week, Andi Grabner’s Signal Overflow talk, The AI Delivery Lifecycle: Observability for and with AI, had a coding-agent slide built on the standard OTEL_EXPORTER_OTLP_* variables, with delta temporality and http/protobuf. It’s in my co-located day recap. That slide got me to wire it up end to end.
Versions: the Claude Code Monitoring docs as of 2 October 2026, tested with Claude Code 2.1.274 and otelcol-contrib 0.161.0.
This is not LLM tracing for your own application. For that, see tracing LLM calls with OpenTelemetry. Here the agent is the thing being observed.

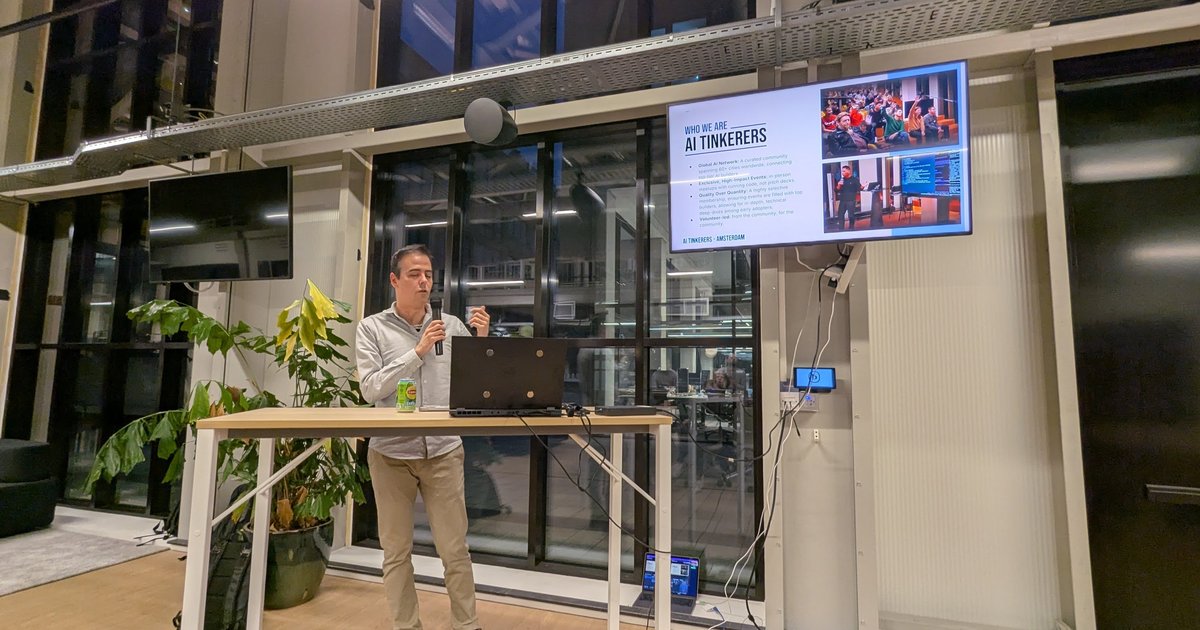
The title slide of The AI Delivery Lifecycle: Observability for and with AI at Signal Overflow, the SRE NL meetup at Booking.com.
Claude Code OpenTelemetry metrics and events
Metrics (all prefixed claude_code.):
| Metric | What it answers | Useful attributes |
|---|---|---|
cost.usage (USD) | Spend per developer, team, repo, model | model, query_source, skill.name |
token.usage (tokens) | Token mix | type: input, output, cacheRead, cacheCreation |
session.count | Adoption | start_type |
lines_of_code.count | Lines added and removed | type, model |
commit.count, pull_request.count | Workflow impact | standard only |
code_edit_tool.decision | How often edits are accepted | tool_name, decision, source, language |
active_time.total (s) | Active time, excluding idle | type: user or cli |
Events go out through the logs signal. The most useful ones for dashboards are claude_code.user_prompt, claude_code.tool_result (with tool_name, success, duration_ms, error_type), claude_code.tool_decision, claude_code.api_request (with cost_usd and token counts), claude_code.api_error and claude_code.mcp_server_connection. Events produced while handling a prompt share a prompt.id, so you can group all API calls and tool runs behind one prompt.
Every metric and event also carries session.id and user.id and, when signed in with a Claude account, organization.id, user.account_uuid and user.email. The resource has service.name set to claude-code (or claude-code-desktop for the Desktop app’s Code tab).
The docs are explicit that cost metrics are approximations. Use your provider’s billing for invoices and this telemetry for attribution and trends.
Configure a developer machine
export CLAUDE_CODE_ENABLE_TELEMETRY=1
export OTEL_METRICS_EXPORTER=otlp
export OTEL_LOGS_EXPORTER=otlp
export OTEL_EXPORTER_OTLP_PROTOCOL=http/protobuf
export OTEL_EXPORTER_OTLP_ENDPOINT=https://otel-gateway.example.com:4318
export OTEL_EXPORTER_OTLP_HEADERS="Authorization=Bearer ${OTEL_TOKEN}"
export OTEL_EXPORTER_OTLP_METRICS_TEMPORALITY_PREFERENCE=delta
export OTEL_RESOURCE_ATTRIBUTES="team.id=platform,cost_center=eng-123"
export OTEL_METRICS_INCLUDE_REPOSITORY=true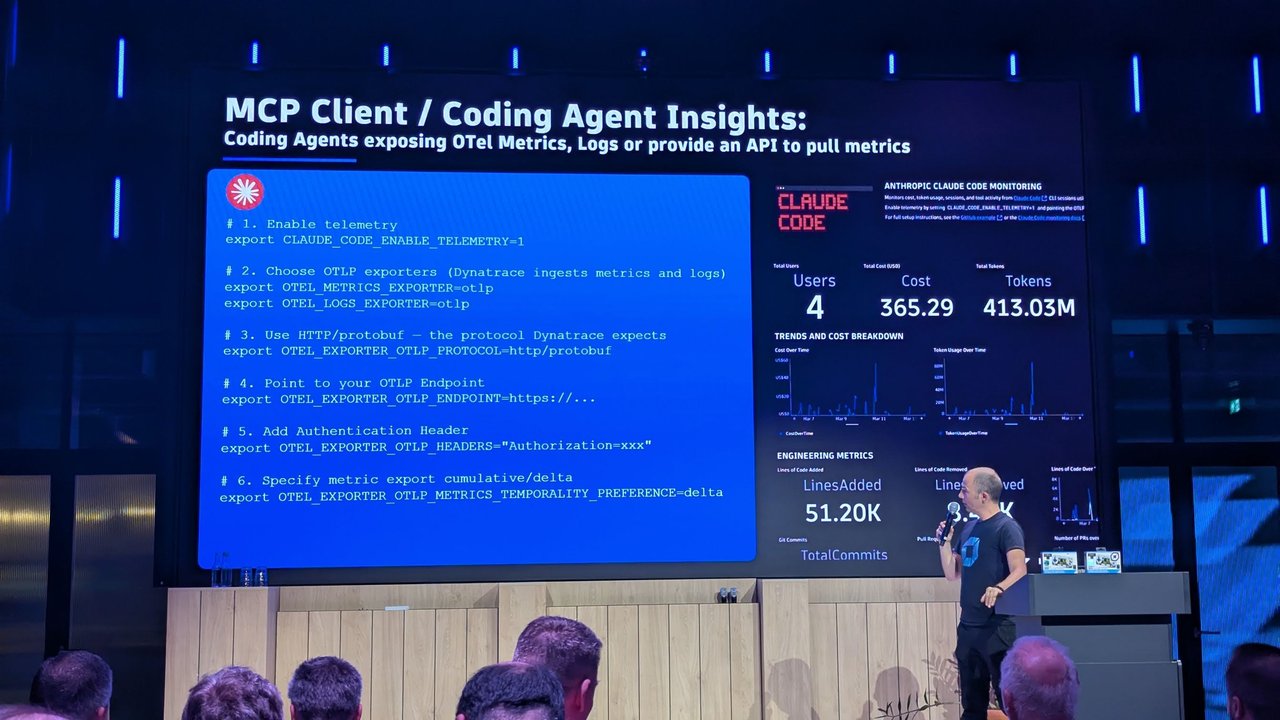
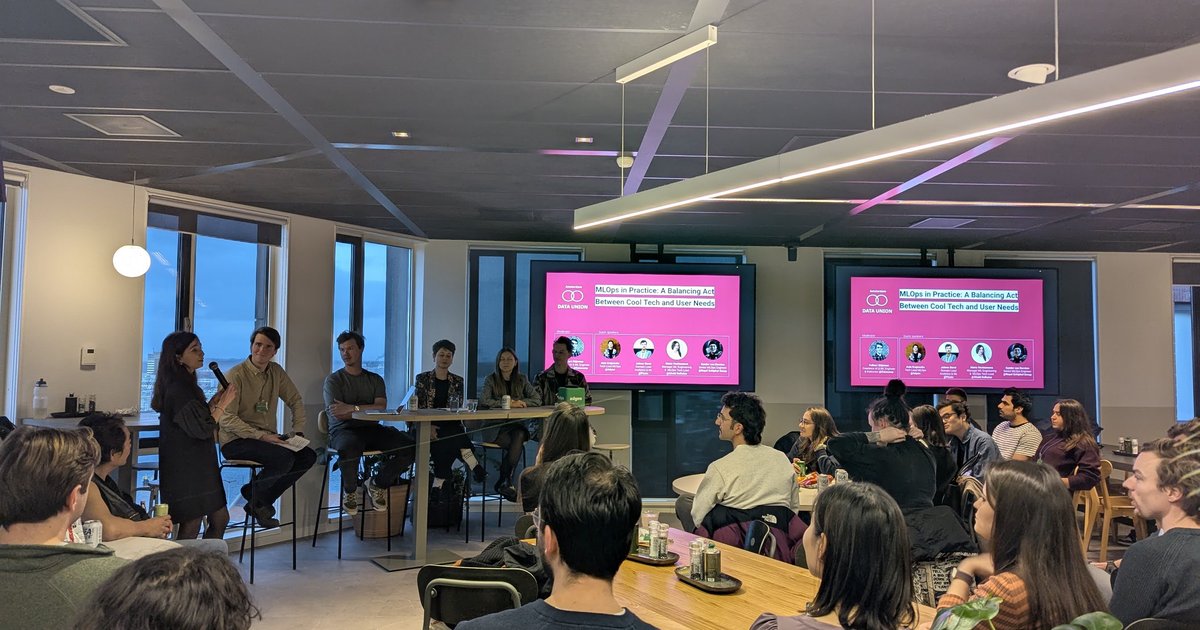
A slide from The AI Delivery Lifecycle at Signal Overflow at Booking.com: the coding-agent telemetry settings (OTLP exporters, http/protobuf, endpoint, auth header, delta temporality) beside a Claude Code cost and token dashboard.
Line by line:
CLAUDE_CODE_ENABLE_TELEMETRY=1is the master switch. Nothing is exported without it.OTEL_METRICS_EXPORTERacceptsotlp,prometheus,consoleornone.OTEL_LOGS_EXPORTERacceptsotlp,consoleornone. Leave the logs exporter unset and you get metrics only, with no events.OTEL_EXPORTER_OTLP_PROTOCOLisgrpc,http/jsonorhttp/protobuf. With HTTP, the SDK appends/v1/metricsand/v1/logsto the endpoint.OTEL_EXPORTER_OTLP_METRICS_TEMPORALITY_PREFERENCEalready defaults todelta. I set it so nobody wonders. Usecumulativeonly if your backend can’t take delta.OTEL_RESOURCE_ATTRIBUTESadds your own labels. Commas separate pairs, and values can’t contain spaces. By default these keys are copied onto every metric datapoint (OTEL_METRICS_INCLUDE_RESOURCE_ATTRIBUTES=true).OTEL_METRICS_INCLUDE_REPOSITORY=true(v2.1.269+) addsvcs.repository.name,vcs.owner.name,vcs.provider.nameandvcs.repository.url.full, read from theoriginremote. That gives you per-repo cost without asking anyone to tag anything.
Exports run every 60 seconds for metrics and every 5 seconds for logs (OTEL_METRIC_EXPORT_INTERVAL, OTEL_LOGS_EXPORT_INTERVAL, in milliseconds). Lower them only while testing.
Roll it out with managed settings
Asking every developer to edit their shell profile doesn’t scale. Put the same keys in the env block of the managed settings file: /Library/Application Support/ClaudeCode/managed-settings.json on macOS, /etc/claude-code/managed-settings.json on Linux and WSL, C:\Program Files\ClaudeCode\managed-settings.json on Windows. Server-managed settings work too.
{
  "env": {
    "CLAUDE_CODE_ENABLE_TELEMETRY": "1",
    "OTEL_METRICS_EXPORTER": "otlp",
    "OTEL_LOGS_EXPORTER": "otlp",
    "OTEL_EXPORTER_OTLP_PROTOCOL": "http/protobuf",
    "OTEL_EXPORTER_OTLP_ENDPOINT": "https://otel-gateway.example.com:4318",
    "OTEL_METRICS_INCLUDE_REPOSITORY": "true"
  },
  "otelHeadersHelper": "/usr/local/bin/otel-token.sh"
}
Three behaviours worth knowing:
- When managed settings set
OTEL_EXPORTER_OTLP_ENDPOINT, Claude Code removes developer-set per-signal endpoints at startup, so nobody can quietly point one signal elsewhere. The exporter selectors don’t get that lock: a developer can still set one tononeorconsole, unless managed settings set it too. - A repository’s
.claude/settings.jsoncan’t turn telemetry on, change the destination or enable content capture. It can only switch a signal off. otelHeadersHelperruns a script that prints JSON headers, refreshed every 29 minutes by default. That beats a static token in a file every developer can read.
The Collector pipeline
The gateway receives OTLP, adds an environment label, maps repositories to owning teams, strips user.email, converts delta to cumulative and exposes a Prometheus endpoint. Events go to Loki over its native OTLP endpoint.
receivers:
  otlp:
    protocols:
      grpc:
        endpoint: 0.0.0.0:4317
      http:
        endpoint: 0.0.0.0:4318

processors:
  memory_limiter:
    check_interval: 1s
    limit_percentage: 80
    spike_limit_percentage: 20

  resource:
    attributes:
      - key: deployment.environment.name
        value: dev-laptops
        action: upsert

  transform:
    error_mode: ignore
    metric_statements:
      - context: datapoint
        statements:
          - set(datapoint.attributes["team"], "payments") where datapoint.attributes["vcs.repository.name"] == "checkout-api"
          - set(datapoint.attributes["team"], "platform") where datapoint.attributes["vcs.repository.name"] == "infra-modules"
          - delete_key(datapoint.attributes, "user.email")
    log_statements:
      - context: log
        statements:
          - set(log.attributes["team"], "payments") where log.attributes["vcs.repository.name"] == "checkout-api"
          - set(log.attributes["team"], "platform") where log.attributes["vcs.repository.name"] == "infra-modules"
          - delete_key(log.attributes, "user.email")

  delta_to_cumulative:
    max_stale: 1h

  batch: {}

exporters:
  prometheus:
    endpoint: 0.0.0.0:8889
    metric_expiration: 1h
    resource_constant_labels:
      included: ["deployment.environment.name"]
  otlp_http/logs:
    endpoint: http://loki.monitoring.svc:3100/otlp
  debug: # add to a pipeline's exporters while testing
    verbosity: detailed

service:
  pipelines:
    metrics:
      receivers: [otlp]
      processors: [memory_limiter, resource, transform, delta_to_cumulative, batch]
      exporters: [prometheus]
    logs:
      receivers: [otlp]
      processors: [memory_limiter, resource, transform, batch]
      exporters: [otlp_http/logs]
What matters here:
transform: Claude Code putsuser.emailon datapoints and event attributes, not on the resource. Aresourceprocessor won’t remove it, so thedelete_keystatements go in the datapoint and log contexts. Theteammapping only works withOTEL_METRICS_INCLUDE_REPOSITORY=trueon the client.delta_to_cumulative: Prometheus counters are cumulative, so convert the delta stream before the Prometheus exporter. The processor keeps state in memory. If you run several gateway replicas, put aload_balancingexporter withrouting_key: streamIDin front, so every sample of a stream lands on the same replica.max_staleandmetric_expiration: both default to 5 minutes. A developer who goes for lunch would otherwise get their series dropped and restarted. I set both to one hour.- Component names: 0.161.0 uses
delta_to_cumulativeandotlp_http. Older releases call themdeltatocumulativeandotlphttp. The old names still validated in 0.161.0.
Validate before deploying:
docker run --rm -v "$PWD/gateway.yaml:/c.yaml" \
  otel/opentelemetry-collector-contrib:0.161.0 validate --config=/c.yaml
Verify it with the debug exporter
I ran the gateway in Docker with debug added to both pipelines, plus a second pipeline that sent the raw input to debug before any processing. Then I ran two short prompts with claude -p, inside a scratch repository whose origin was https://github.com/example-org/checkout-api.git. What came through:
- Metrics:
claude_code.session.count,cost.usage,token.usage,active_time.totaland, after a prompt that wrote one file,lines_of_code.countandcode_edit_tool.decision. Instrumentation scope:com.anthropic.claude_code. - Raw input had
AggregationTemporality: Delta; after the processor it readCumulative. - Events:
user_prompt,api_request,assistant_response,tool_decision,tool_result,mcp_server_connection,plugin_loaded,permission_mode_changedandmanaged_settings_resolved. Thepromptattribute read<REDACTED>. team.id,cost_centerand thevcs.*keys arrived on every datapoint, the transform addedteam="payments", anduser.emailwas present in the raw stream but gone after processing.
The Prometheus exporter translated the names to claude_code_cost_usage_USD_total, claude_code_token_usage_tokens_total, claude_code_session_count_total, claude_code_active_time_seconds_total, claude_code_lines_of_code_count_total and claude_code_code_edit_tool_decision_total, with job="claude-code" taken from service.name.
If nothing arrives, start Claude Code with claude --debug-file /tmp/claude-otel.log and look for [3P telemetry] lines. Mine showed the resolved exporter, protocol, interval and endpoint.
Dashboard queries
Each series is one session’s running total that starts at zero, because session.id is a label. That’s why I use max_over_time for totals instead of increase: increase undercounts what a short-lived series added before its first scrape. In Grafana, replace [7d] with [$__range] so the window follows the time picker.
# Spend per team over the last 7 days
sum by (team_id) (max_over_time(claude_code_cost_usage_USD_total[7d]))

# Token mix by model, as a rate
sum by (model, type) (rate(claude_code_token_usage_tokens_total[5m]))

# Sessions per team per day, excluding the agents dashboard process
sum by (team_id) (max_over_time(claude_code_session_count_total{start_type!="agents_view"}[1d]))

# Lines added and removed per repository
sum by (vcs_repository_name, type) (max_over_time(claude_code_lines_of_code_count_total[7d]))

# Edit acceptance rate by language
sum by (language) (max_over_time(claude_code_code_edit_tool_decision_total{decision="accept"}[7d]))
  / sum by (language) (max_over_time(claude_code_code_edit_tool_decision_total[7d]))
A session that crosses the window edge is counted in full, which is fine for chargeback trends. Tool failure rates come from events: count claude_code.tool_result where success is "false", grouped by tool_name and error_type, in your log backend. For terminal API failures, claude_code.api_error fires once, after retries are exhausted.
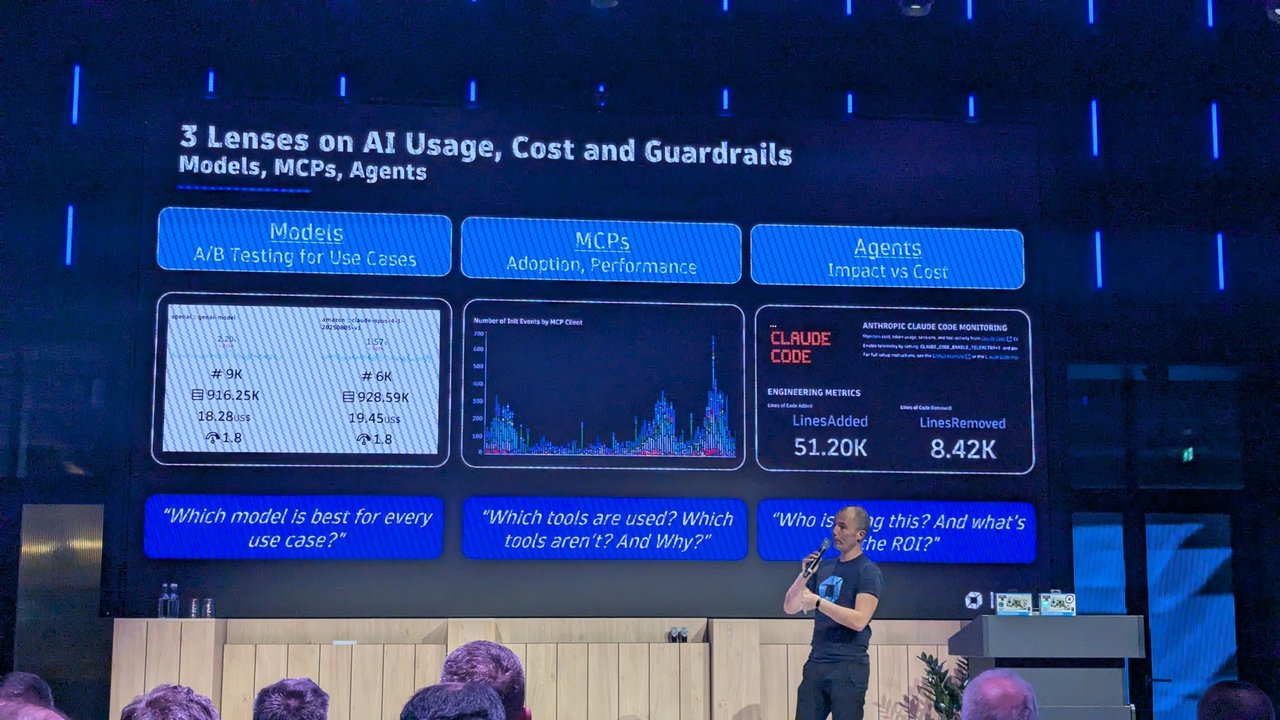
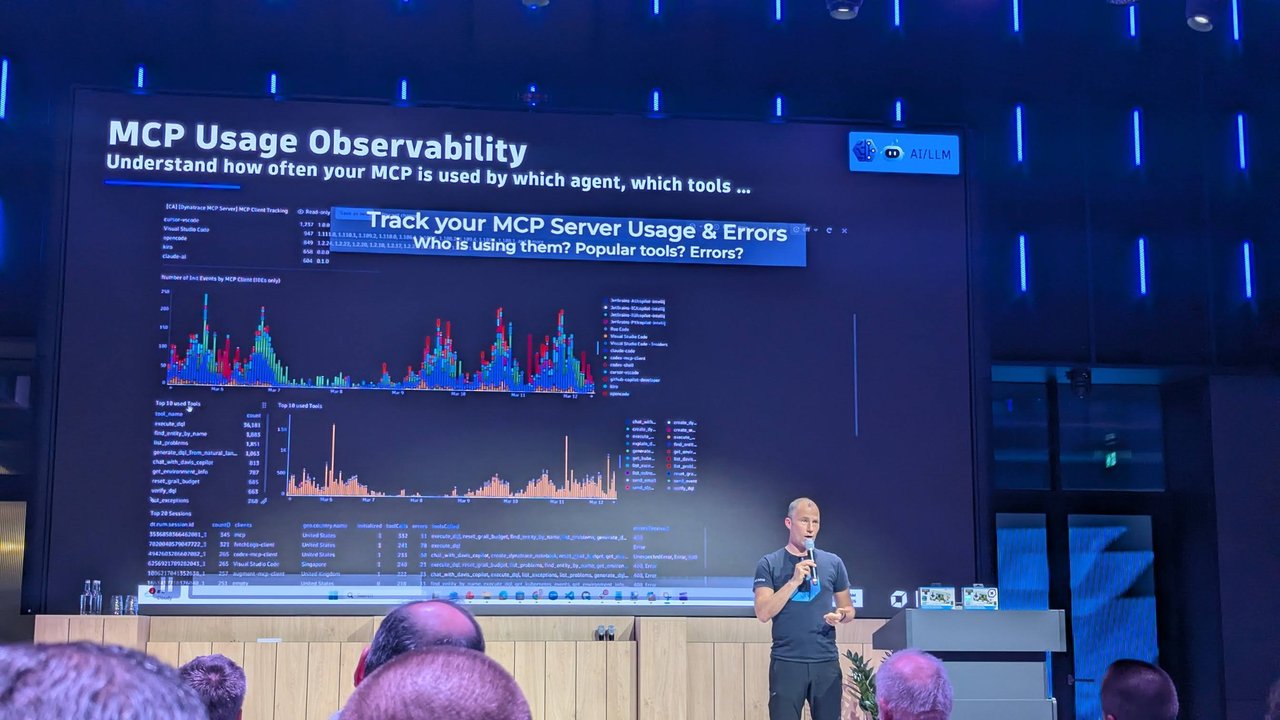
A slide from The AI Delivery Lifecycle at Signal Overflow at Booking.com: three lenses on AI usage, covering models (A/B testing), MCPs (adoption and performance) and agents (impact vs cost).
Privacy controls
The defaults are conservative, and I’d keep them:
- Prompt text is redacted. Only
prompt_lengthis sent unlessOTEL_LOG_USER_PROMPTS=1. - Assistant response text is redacted unless
OTEL_LOG_ASSISTANT_RESPONSES=1. If that’s unset, it followsOTEL_LOG_USER_PROMPTS, so set it to0explicitly when you enable prompts but not responses. - Bash commands, file paths, MCP server and tool names, and tool arguments need
OTEL_LOG_TOOL_DETAILS=1. Without it, user-configured MCP server names are replaced with placeholders such ascustomormcp_tool. OTEL_LOG_RAW_API_BODIESexports full API request and response bodies, conversation history included. It’s off by default, and repository settings can’t turn it on.- Raw file contents and code snippets are never in metrics or events.
user.emailis sent when signed in with OAuth, only to your endpoint. Drop it in the Collector as above if you don’t need it.
My take: turn on OTEL_LOG_TOOL_DETAILS only for a security audit stream that goes to your SIEM, with its own retention, not for the cost dashboard.
Other coding agents
- Gemini CLI supports OpenTelemetry through
telemetry.*in.gemini/settings.json, or the matchingGEMINI_TELEMETRY_*variables. It’s off by default, andotlpEndpointdefaults tohttp://localhost:4317. Watch out:logPromptsdefaults totrue, the opposite of Claude Code. Its metrics are prefixedgemini_cli., such asgemini_cli.token.usage,gemini_cli.tool.call.countandgemini_cli.lines.changed(docs). - OpenAI Codex configures it in the
[otel]table of~/.codex/config.toml. The exporter defaults to"none",log_user_prompt = falsekeeps prompts redacted, and it emits events such ascodex.tool_resultand metrics such ascodex.tool.call(docs).
The same gateway takes all three. Key dashboards on service.name.
Common pitfalls
- Turning off
session.idwith delta.OTEL_METRICS_INCLUDE_SESSION_ID=falsemakes two concurrent sessions on one machine send the exact same stream.delta_to_cumulativethen drops one of them as out of order, and its own error message says to check for multiple processes sending the same series. - Remote write with delta. The Prometheus remote write exporter drops non-cumulative monotonic metrics. Convert first.
- Exporter variables in the repo. They’re ignored in
.claude/settings.json. Use managed settings or user settings. - Spaces in
OTEL_RESOURCE_ATTRIBUTES. Use underscores or percent-encoding. - Laptop-local
prometheusexporter. It serveslocalhost:9464/metricson each machine, which is fine for a demo but nothing you can scrape across a fleet. - Treating cost as an invoice. It’s an estimate. Reconcile with billing monthly.
Related
- KubeCon Europe 2026 co-located day: Platform Engineering Day, Observability Day, ArgoCon and Signal Overflow
- AI Observability: Tracing LLM Calls with OpenTelemetry
- OpenTelemetry Trace Quality: A Checklist for Large Systems
- Who’s Watching the Agents? AI Observability Meetup at Miro Amsterdam
- Dash0 at KubeCon EU 2026: Observability Without Lock-In