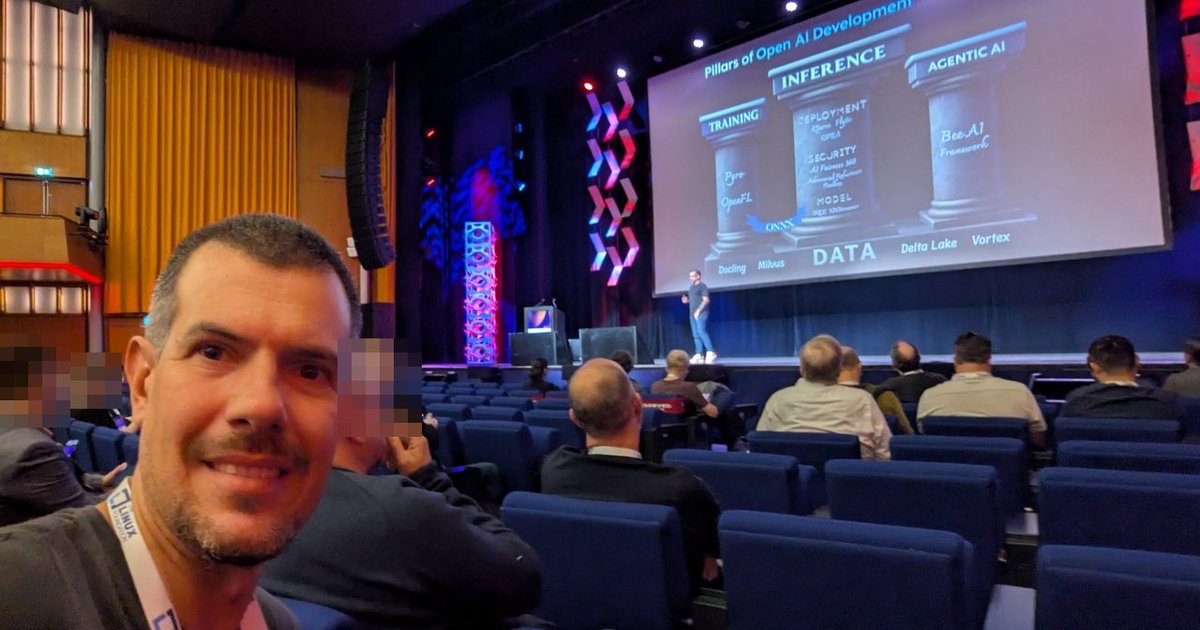
On 28 August 2025, the day after Open Source Summit Europe 2025 ended, I stayed at RAI Amsterdam for AI_dev: Open Source GenAI & ML Summit, the Linux Foundation’s co-located AI event. The programme shifted from open source in general to the AI stack: particle physics at CERN, a wafer-sized chip, a lakehouse file format and a team of agents that build knowledge graphs.
These notes come from my photos of the slides and from short clips I recorded in the room. I only name speakers whose names appeared on their slides.
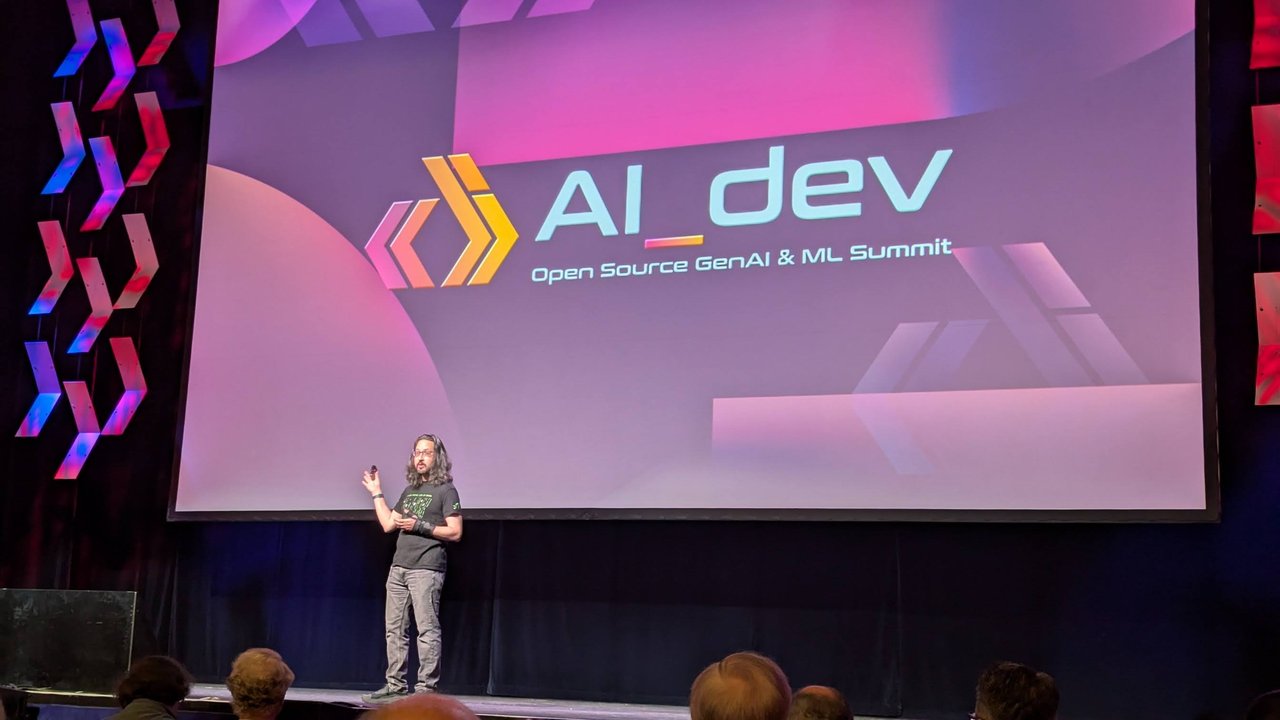
The AI_dev title slide on the main stage before the first keynote.
Opening: open source AI by the numbers
The welcome slides started with survey data. 63% of organisations already use open-source AI models, and 75% expect to increase their use of open-source AI in the next few years. The source given was McKinsey, the Mozilla Foundation and the Patrick J. McGovern Foundation, Open source technology in the age of AI (April 2025). The host said the programme committee came from the LF AI community and the Kubernetes Working Group on AI, and that they picked the day’s talks from more than 300 proposals.
Mark Collier: three pillars of open source AI
The first keynote was “3 Pillars of Open Source AI: Training, Inference, Agents” by Mark Collier. His slide introduced him as GM of AI & Infrastructure at the Linux Foundation and co-founder of OpenStack and the OpenInfra Foundation. He opened with the merger of the Linux Foundation and the OpenInfra Foundation, which puts Linux, OpenStack and Kubernetes under one roof, and with a slide that read “You can’t separate AI from infrastructure”.
His evidence came from Google: a slide quoting Sundar Pichai said Google now processes 980 trillion tokens a month, 100× more than a year earlier. A second slide cited Jeff Dean: from May 2024 to May 2025, the energy footprint of the median Gemini Apps text prompt dropped 33×. He argued that most of the problems people hit when adopting AI are infrastructure problems: GPU scarcity, energy, latency and data gravity.
Then the three pillars:
- Training is the most mature pillar. In the talk he put PyTorch’s share at about 80%.
- Inference has many competing open source servers (he named vLLM, SGLang and ByteDance’s AIBrix). The weak spot is that users struggle to know what to take off the shelf. He compared it to the early OpenStack days.
- Agents are mostly about protocols such as MCP, which need to settle so agents are secure and interoperable. One cartoon slide read “I guess we’re rebranding cron jobs into agents now”.
He also had slides titled “Closed source ‘moats’ are short lived”, quoting DeepSeek founder Liang Wenfeng, and “Open Source is the right side of history”, which noted that OpenAI released its first open-weight models since GPT-2 (gpt-oss-120b and gpt-oss-20b) on 5 August 2025. A “Coding agents: real or hype?” slide quoted AWS CEO Matt Garman, who has said that replacing junior developers with AI is “one of the dumbest things I’ve ever heard”.
LF AI & Data: pillars of open AI and the State of Sovereign AI
Next, the chair of the LF AI & Data Technical Advisory Committee presented the foundation’s projects on a slide called “Pillars of Open AI Development”. Training listed Pyro and OpenFL. Inference listed KServe, Flyte and OPEA for deployment, and AI Fairness 360 and the Adversarial Robustness Toolbox for security. Agentic AI listed the BeeAI Framework. ONNX connected the pillars, and Data ran underneath with Docling, Milvus, Delta Lake and Vortex. I tested Docling on PDFs, tables and OCR separately.
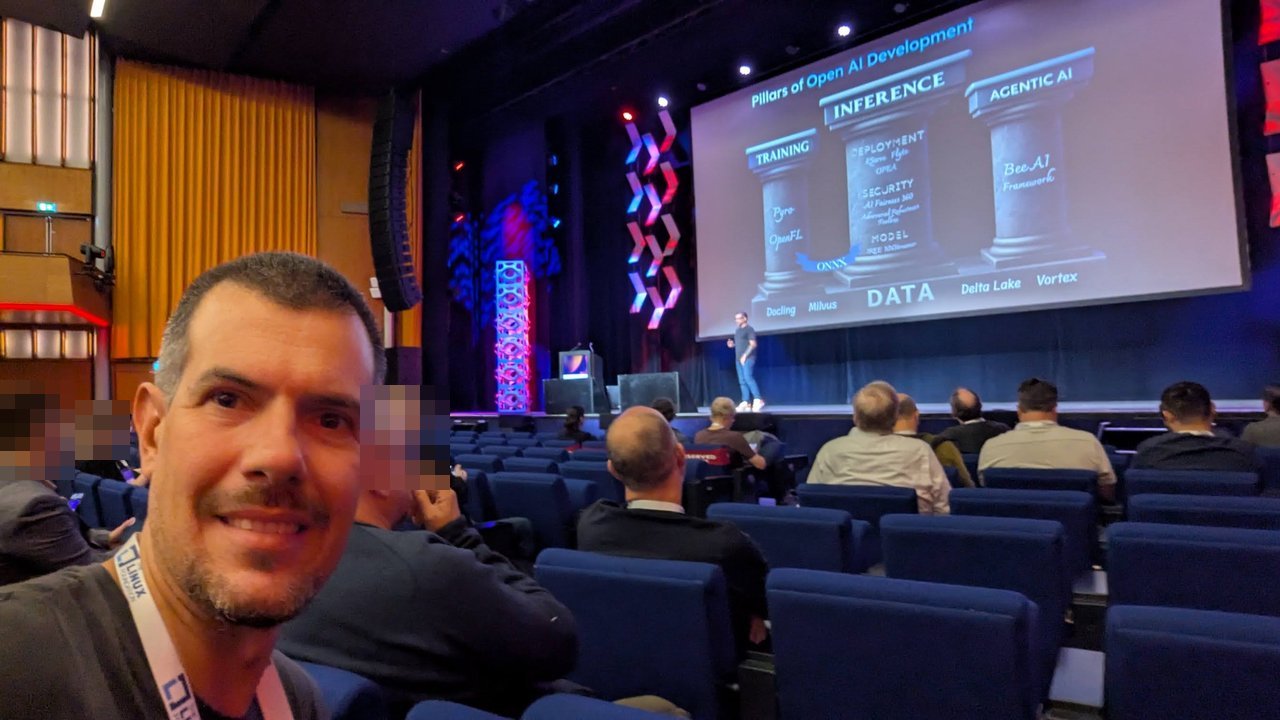
My seat for the LF AI & Data project overview: training, inference and agentic AI on top of a shared data layer.
The same session previewed The State of Sovereign AI, a Linux Foundation Research report. The slide headline was “Culture & Security Driving Sovereign AI Globally in Organizations”, with four numbers:
- 79% consider sovereign AI a global priority
- 81% use open source as a primary approach
- 82% build custom AI
- 44% say data quality is the top challenge
The report page shows it was formally released on 5 September 2025, a week after this preview, with a foreword by Mark Collier.
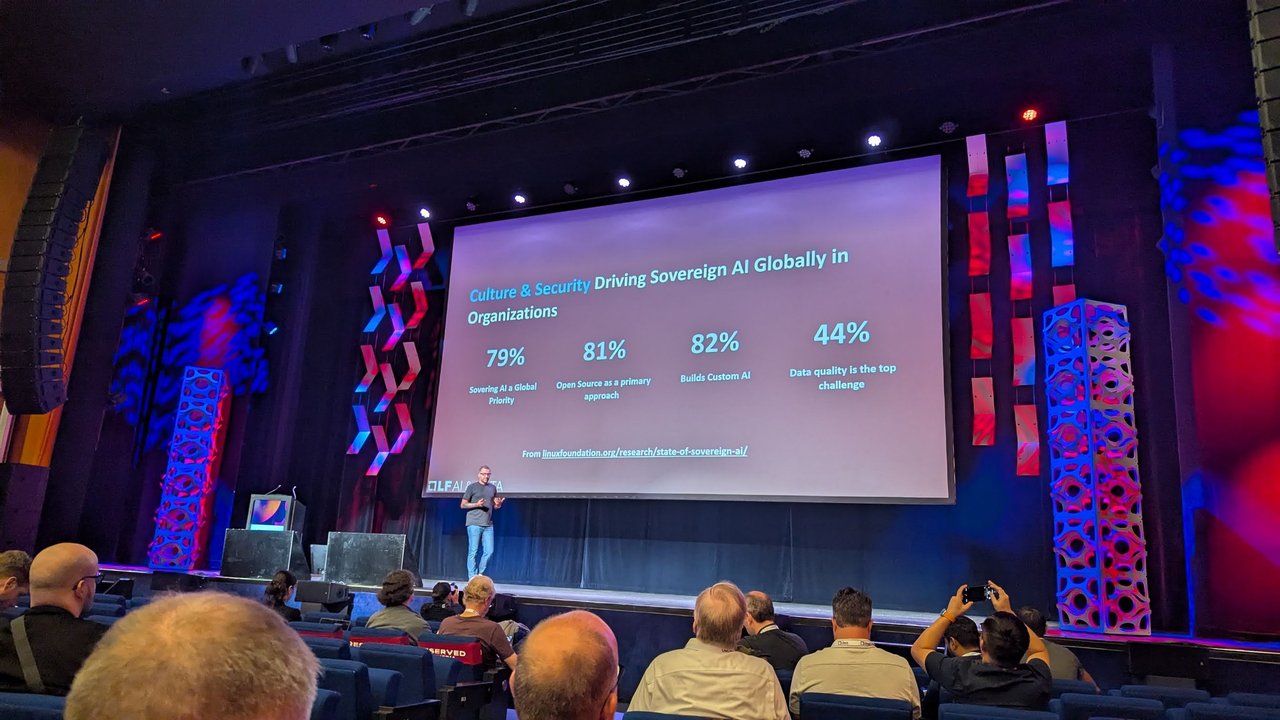
Four headline numbers from the State of Sovereign AI preview.
AI & MLOps @ CERN
Ricardo Rocha (Lead, Platforms Infrastructure, CERN) gave the talk I was most looking forward to. He started with the data problem, and the numbers are large. The slide showed the CMS detectors producing about 1 PB per second at a 40 MHz collision rate. A Level-1 trigger built from FPGAs and custom electronics cuts that to 100 kHz. Event readout and event building follow, then a high-level trigger running on a CPU computing farm brings it down to O(kHz). Less than 10 GB per second reaches the CERN Data Center. An ATLAS diagram on the same slide gave the detector as 44 m wide, 22 m in diameter and 7,000 tonnes.
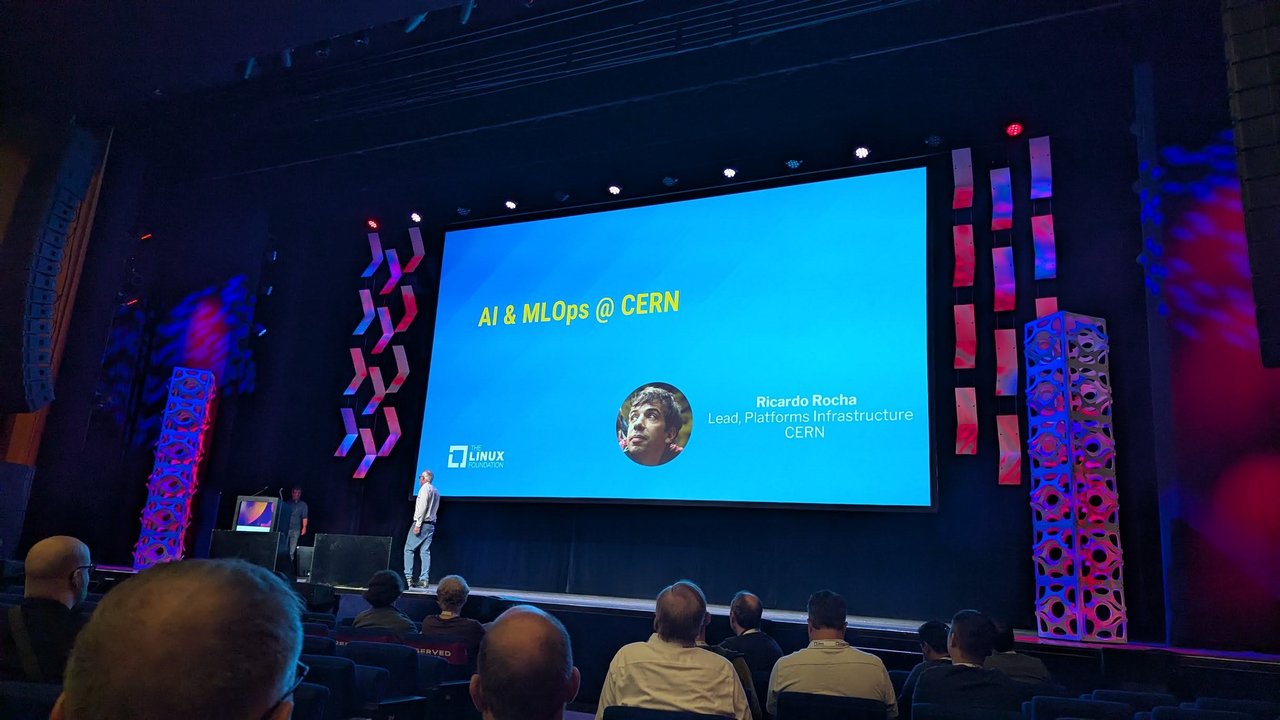
Ricardo Rocha’s title slide: AI & MLOps @ CERN.
Machine learning appears at both ends of that pipeline. One slide showed hls4ml and Vivado turning models into a firmware block. The hls4ml project describes itself as a package for machine learning inference in FPGAs that creates firmware implementations using high-level synthesis. The same slide described ultra-fast simulation using ML-based parameterisations, which speeds up detector simulation by two orders of magnitude. The example was the LHCb Lamarr tracking and particle-ID pipelines, built from GAN, GBDT and MLP models.
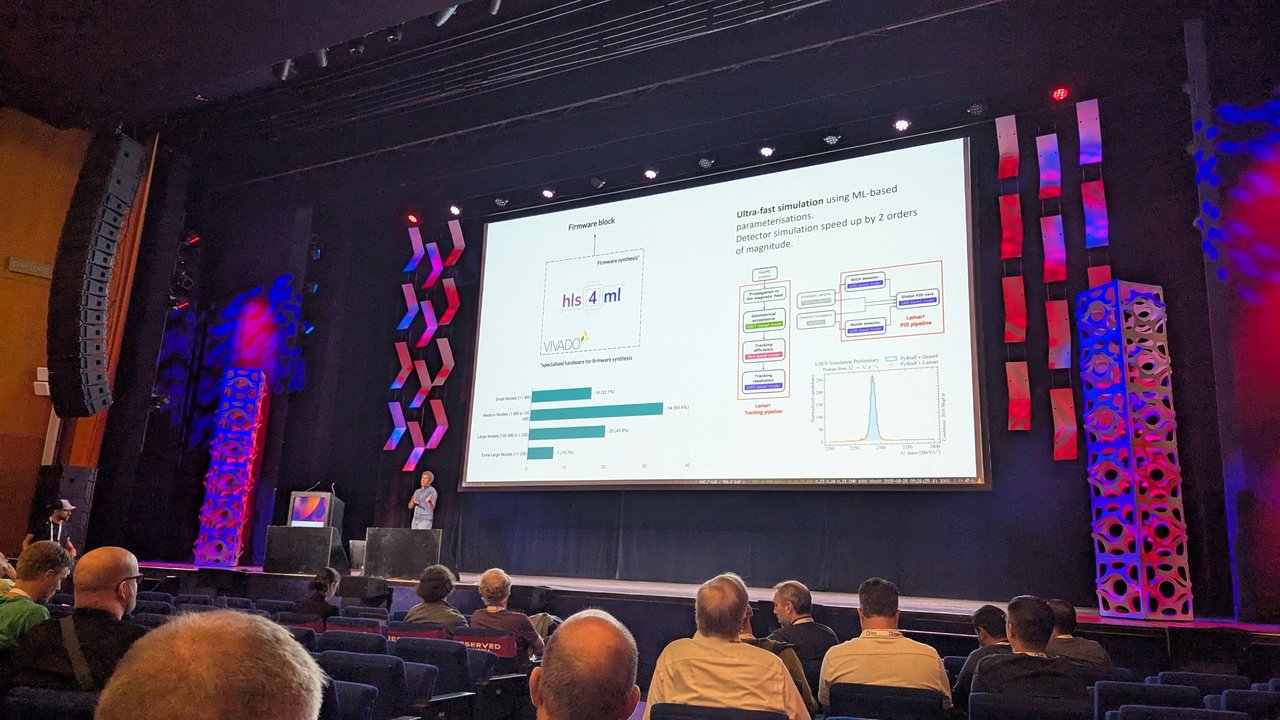
hls4ml for FPGA firmware, and ML-based simulation that is 100 times faster.
The session continued with a live demo of the platform CERN’s users work on. In a Kubeflow notebook, nvidia-smi showed a partitioned GPU, which is enough for iterative development. A training run reported its metrics in the Kubeflow UI. A model-serving endpoint for data-quality monitoring scaled from one predictor to several as traffic arrived, with GPU and CPU utilisation dashboards next to it. For people who prefer a terminal, the same sessions were available through Kubernetes or plain SSH. One session used an SXM GPU with InfiniBand for multi-node LLM training. The demo ended with CPU pinning and NUMA mapping: pinning a training job to the cores attached to its GPU gave, by the speaker’s account, about 30% more performance.
My take: I’ve seen many “ML platform on Kubernetes” diagrams. This was one of the few talks that showed the unglamorous parts working live: GPU partitioning, autoscaling, SSH for people who don’t want to learn Kubernetes, and NUMA pinning. That last one is the kind of 30% that never shows up in a model benchmark. If you’re building something similar, I wrote about the components in building an ML platform on Kubernetes.
An agentgateway demo between agents and MCP
The keynote block also had a live agentgateway demo. Its speaker wasn’t named on screen. Agentgateway ran in a Kubernetes cluster, programmed by kgateway through the Kubernetes Gateway API, in front of a GitHub MCP server. The speaker exposed only 7 of the server’s 20 to 30+ tools, because those were all the agent needed. When the demo app returned “no healthy endpoints”, an “AI reliability” agent built with kagent inspected the routes and services, traced the app back to its Git repository through the Argo CD application, found a port mismatch and opened a pull request. The speaker checked it by hand (“we do human in the loop”), merged it and let Argo CD sync the fix.
The second half put agentgateway in front of a local Ollama model, with a local rate-limit policy and OpenTelemetry tracing. The speaker also said agentgateway had just passed the conformance tests for the Kubernetes Gateway API Inference Extension. The agentgateway site now lists MCP, A2A, LLM and inference routing, and says the project has joined the Agentic AI Foundation.
deepset: The AI Cocktail and context engineering
Malte Pietsch (CTO & Co-founder, deepset) called his talk “The AI Cocktail”. His “Our Context” slide described deepset as “solving custom AI challenges since 2018”, headquartered in Berlin. Its products are the deepset AI Platform and Haystack, described as a leading open source framework plus commercial platforms for custom, enterprise-grade AI. Today the Haystack site describes it as “Open-Source AI Orchestration for Production-Grade Agents”.
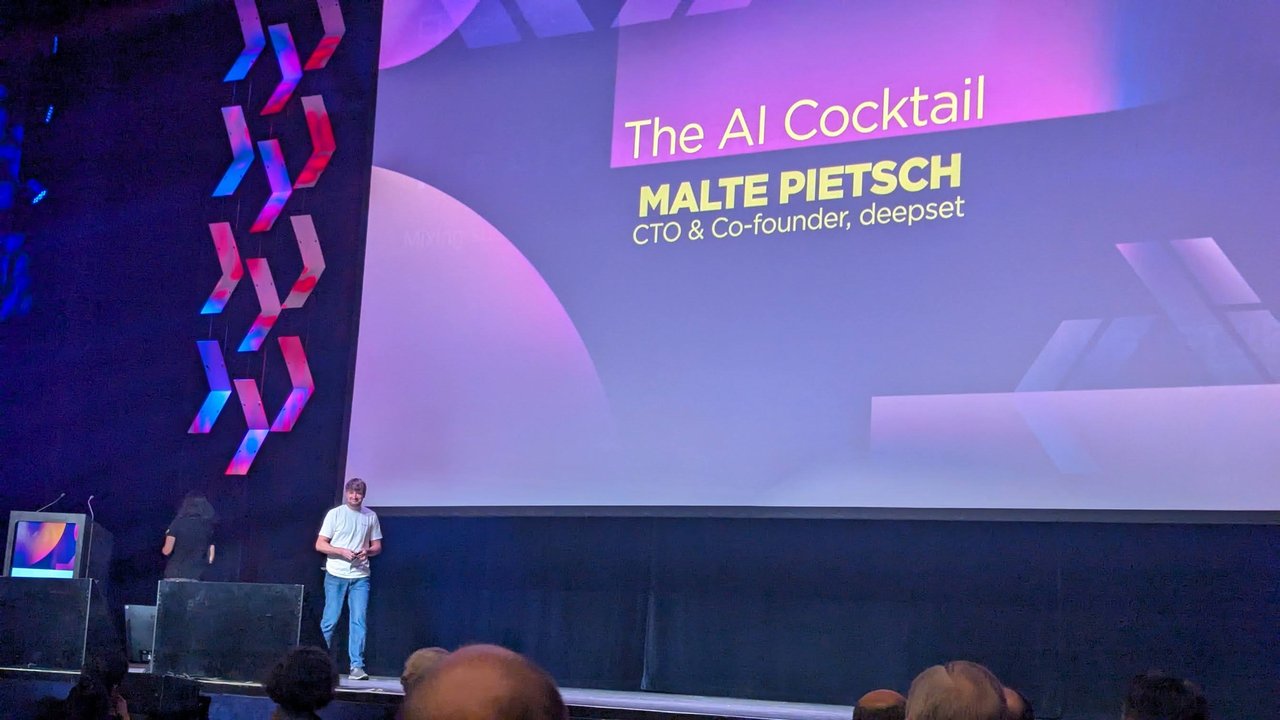
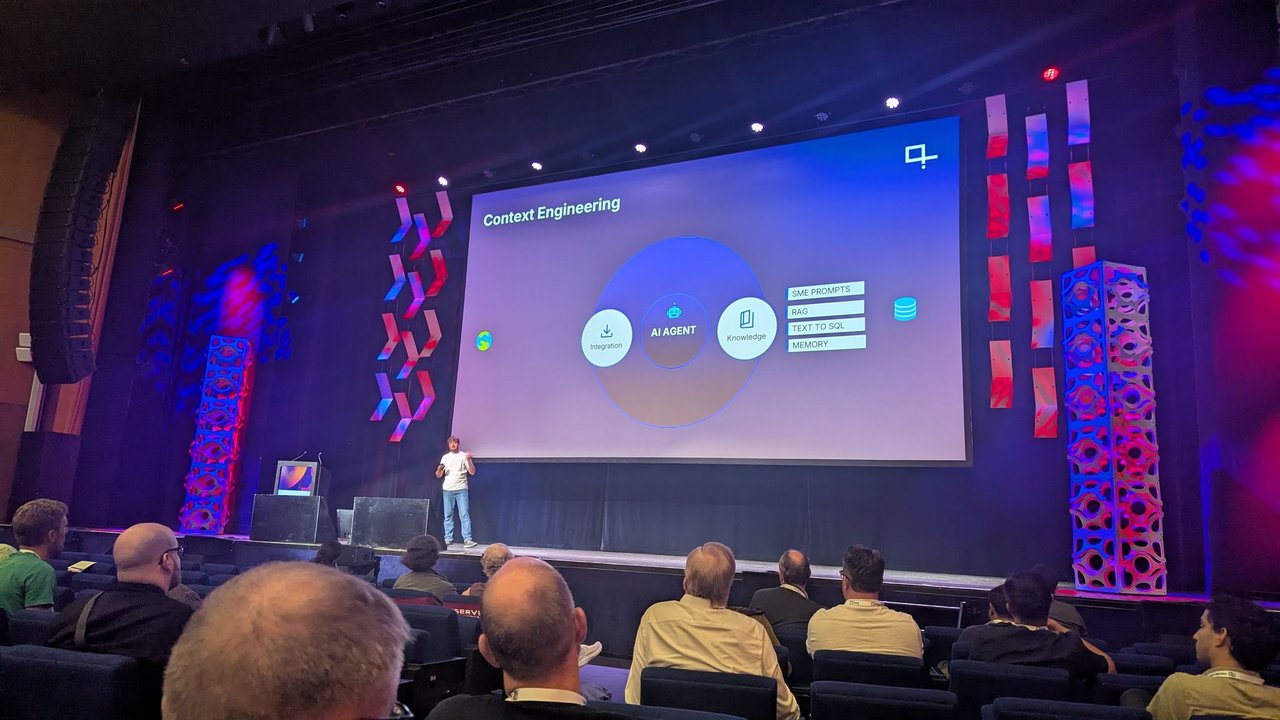
Malte Pietsch’s title slide, and the context engineering diagram: integrations and knowledge around the agent.
Two slides stood out:
- “Example: Cursor” used the AI code editor as a model for AI user experience. It blends AI with the classic IDE UI, uses diffs and step-wise acceptance so changes can be checked quickly, and offers an autonomy slider from chat and autocomplete, through generating code inside a selection, up to a full agent.
- “Prompt → Context Engineering” collected posts from Tobi Lütke, Andrej Karpathy, Amjad Masad and Aaron Levie arguing that “context engineering” describes the skill better than “prompt engineering”. The next slide drew the AI agent with integrations on one side and knowledge on the other. Knowledge was broken down into SME prompts, RAG, text-to-SQL and memory.
My take: the diagram matches what I see in client projects. Choosing the model is the easy part. Most of the work goes into deciding what goes into the context window, and which sources (retrieval, SQL, memory, expert prompts) put it there. I made the same argument in context engineering vs prompt engineering, and the retrieval side is covered in enterprise RAG architecture patterns.
Cerebras: zero to 50 ExaFLOPS in under a year
Hagay Lupesko (SVP Cloud & Inference, Cerebras) presented “Zero to 50 ExaFLOPS in Under a Year: Lessons from the Trenches”. He started with the hardware. The Wafer Scale Engine slide listed 4 trillion transistors, 46,225 mm² of silicon, 900,000 cores optimised for sparse linear algebra, a 5 nm TSMC process, 125 petaflops of AI compute, 44 GB of on-chip memory, 21 PB/s of memory bandwidth and 214 Pbit/s of fabric bandwidth. Cerebras’ chip page today describes a newer WSE-3 Turbo with the same 4 trillion transistors and 900,000 cores, rated at 250 petaflops.
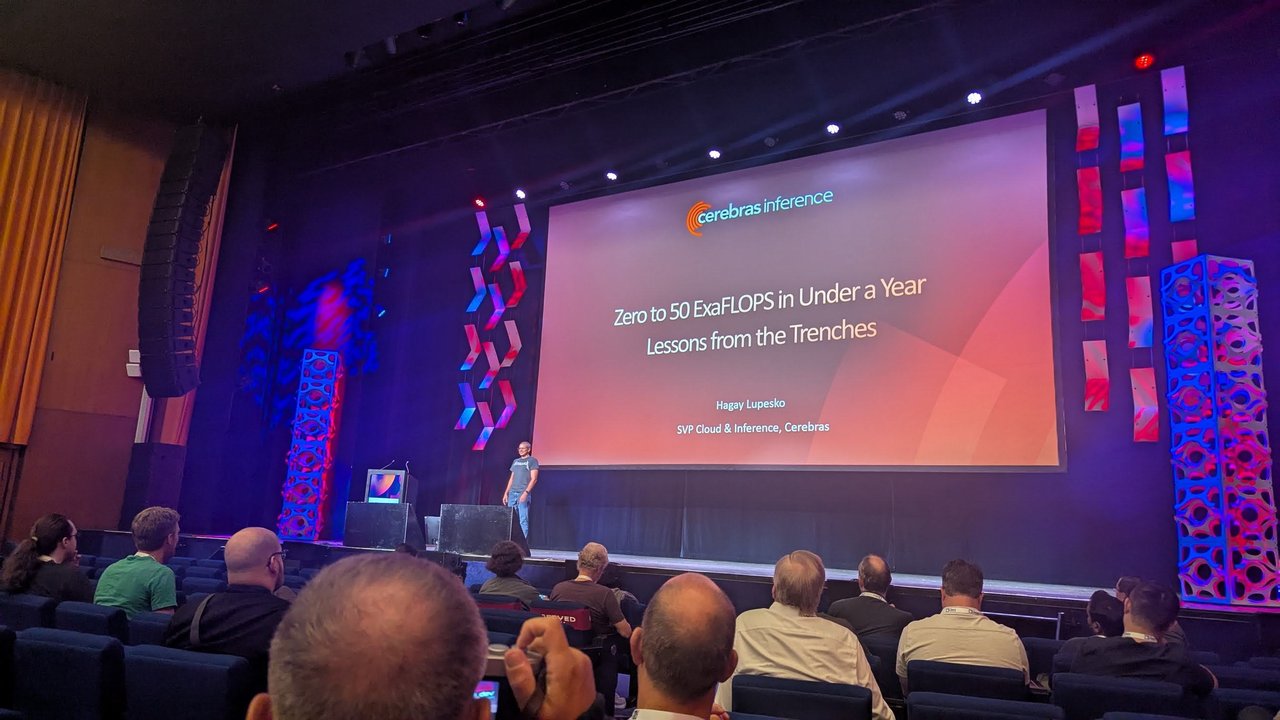
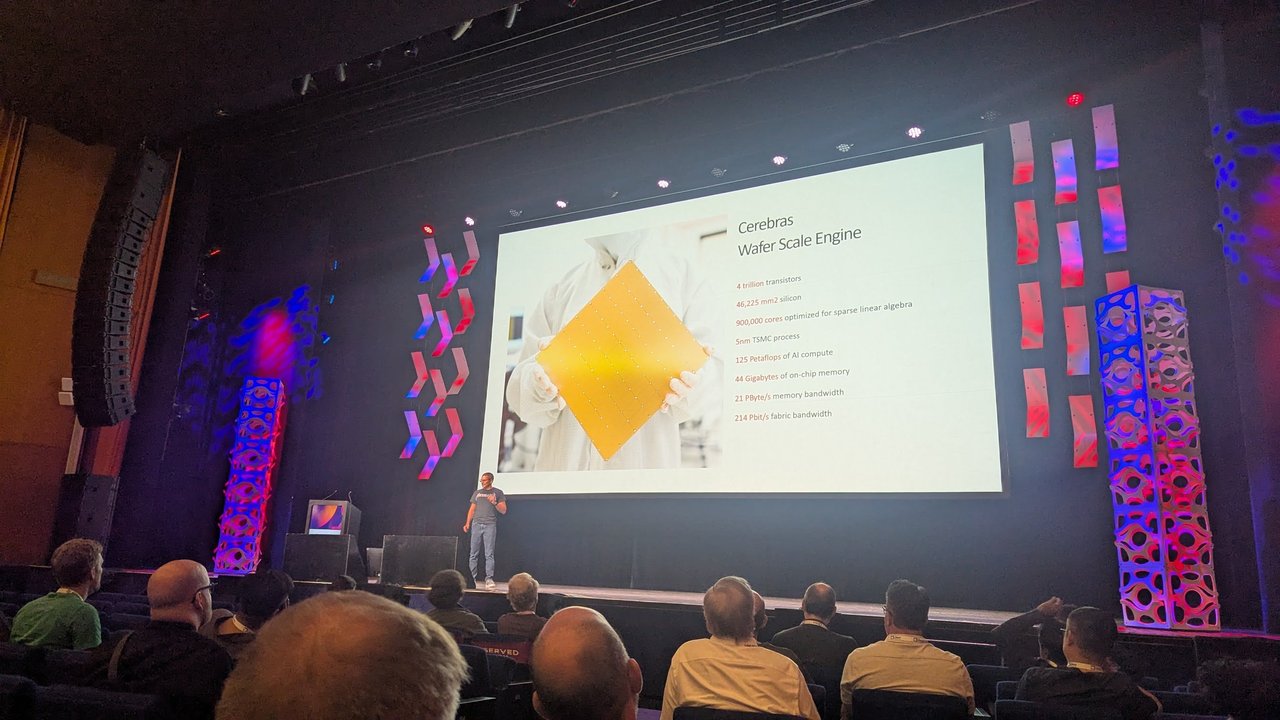
The Cerebras talk title, and the Wafer Scale Engine numbers as shown in August 2025.
Next came a slide titled “Fast inference means high speed and low latency”: an Artificial Analysis chart of latency against output speed for OpenAI’s gpt-oss-120b across providers, with Cerebras plotted on its own near 3,000 output tokens per second. The “Scaling Cerebras Inference since Launch” slide claimed over 50 ExaFLOPS deployed, 8 data centres, 100K developers and hundreds of enterprises. Its map showed sites in Stockton, Sunnyvale, Minneapolis, Montreal, Oklahoma City, Atlanta, Dallas and France. A customer slide that followed included Meta, Mistral AI, IBM, GSK, Perplexity and the Mayo Clinic.
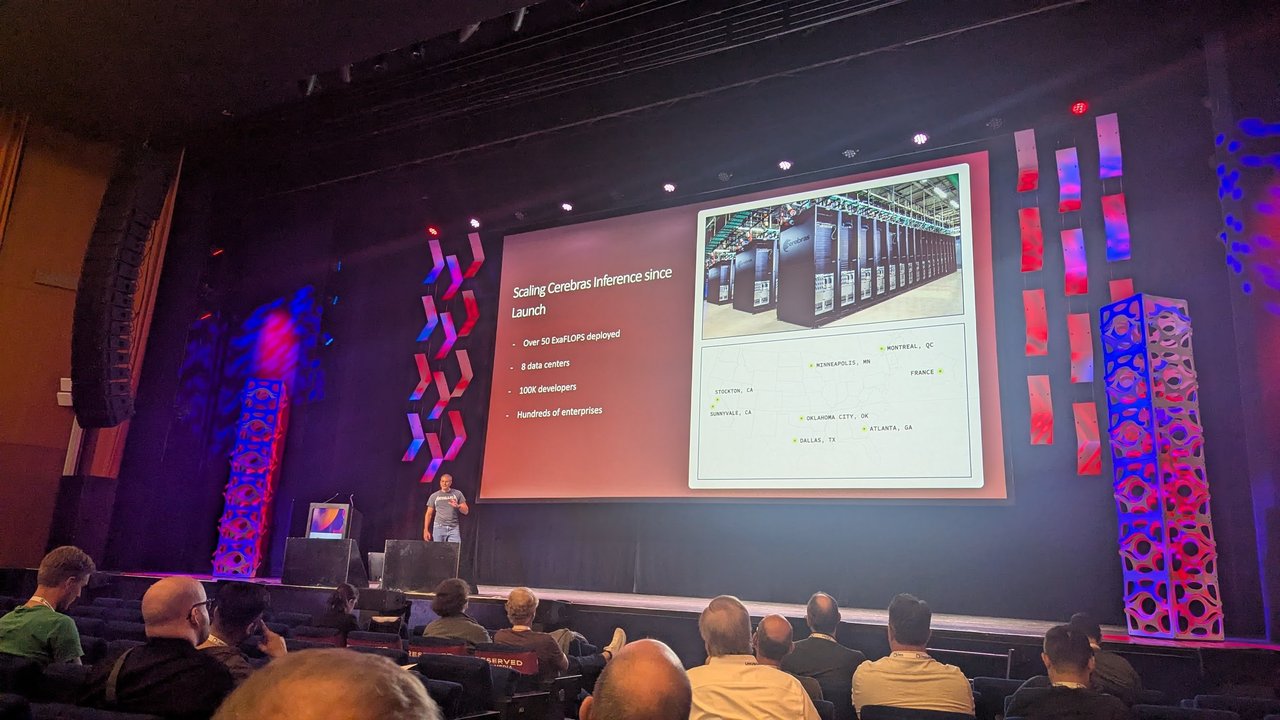
Cerebras’ scale numbers and data-centre map, as claimed on the slide.
The useful part was the five lessons, which apply to any inference service, not only one built on wafer-scale chips:
- “If something can fail, it will fail (Murphy’s law), and it will fail at the worst possible time (Lupesko’s law).” Every box in a typical inference architecture will fail eventually: CDN, control plane, databases, inference servers, storage and accelerators. His advice: find single points of failure, add redundancy, monitor everywhere, and keep model replicas in a separate region.
- System performance beats model performance. Optimising the forward pass barely moved end-to-end time to first token (TTFT). Most of the latency came from the network and the API. HTTP/2 on the origin servers, more distributed edge presence and less API-gateway overhead together cut TTFT roughly in half.
- “Your inference request pipeline will either evolve or break.” Scaling meant distributed authentication, rate limits and billing across regions, prompt-cache-aware sticky routing, priority queues for enterprise traffic that don’t starve everyone else, several rate limits on one account, and new rate-limiting algorithms for traffic spikes.
- Prepare for bot attacks. Free tiers on scarce, expensive compute attract abuse, and he said Cerebras had been hit several times. His three steps were prevention (country and IP blocks, a WAF, strong identity checks such as payment instruments or phone numbers, because email isn’t enough), detection (high-watermark and customer-experience alerts) and mitigation (on-call playbooks, feature flags, admin tooling and wildcard block lists).
- Observability is critical and never finished. Use per-minute resolution, define KPIs together with each feature, give teams self-serve metrics, dashboards and alerts, and run synthetic tests from outside your own infrastructure so you can still see what’s happening when it’s down. He said Cerebras runs dozens of dashboards with thousands of metrics, tracking generation speed, TTFT percentiles, throughput and per-model availability.
The Cerebras inference page highlights OpenAI API compatibility, which matches the “one API call away” code slide in the talk.
My take: lessons 2 and 3 are the ones I’d send to any team building on vLLM or a managed endpoint. TTFT is a system metric. Measure it end to end, under load, against an SLO, before you tune kernels. I described that workflow in benchmarking vLLM against SLOs with GuideLLM.
LanceDB: the AI-native multimodal lakehouse
Chang She, CEO and co-founder of LanceDB, introduced himself as a co-author of the pandas library who has spent two decades building data tooling for ML and AI, including RecSys and ML infrastructure at TubiTV. His thesis slide asked: “In a world where everyone has access to the same models and techniques, what differentiates your AI features?” The answer on the slide: “it’s the data; your data”.
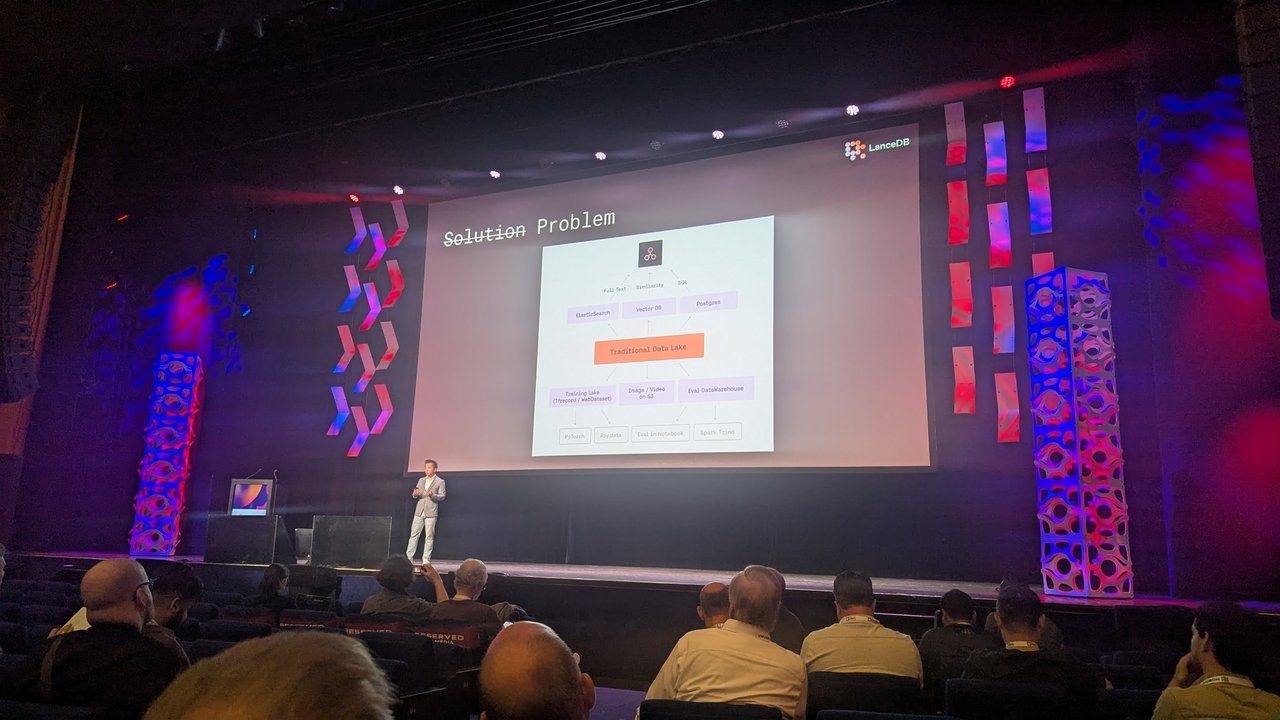
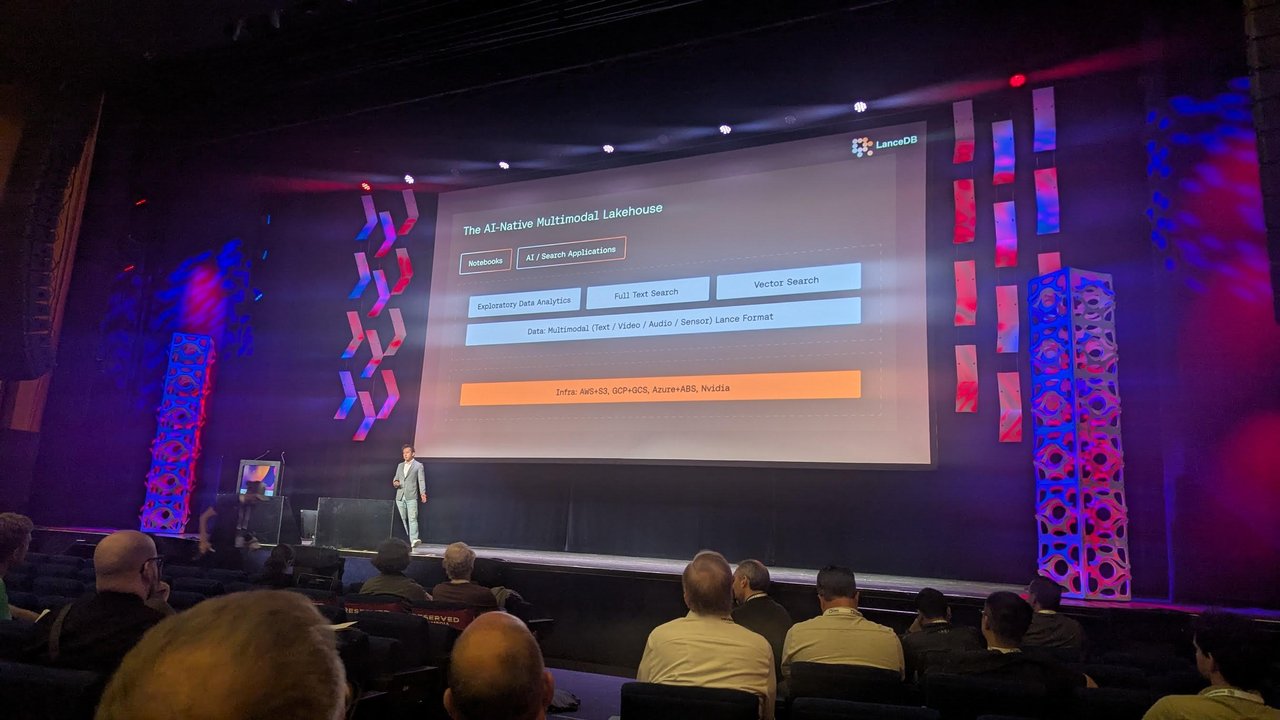
The problem (one data lake copied into many systems) and LanceDB’s proposed fix (one multimodal format underneath).
The problem slide drew a familiar sprawl. A traditional data lake fans out to Elasticsearch for full text, a vector database for similarity and Postgres for SQL. A training lake in TFRecord or WebDataset feeds PyTorch and Ray Data, images and video sit on S3, and an eval data warehouse is queried from notebooks or Spark and Trino. A Netflix “Media Data Lake” case study, credited to the Netflix tech blog, showed the same pressure at scale.
LanceDB’s answer is “The AI-Native Multimodal Lakehouse”. Exploratory analytics, full-text search and vector search all run on multimodal data (text, video, audio, sensor) stored in the Lance format, on AWS S3, Google Cloud Storage, Azure Blob Storage or NVIDIA infrastructure. The “Rebuilding the foundation” slide described Lance as file format + table format + secondary indexes, with fast scans for analytics and training, O(1) random access for search and shuffling, and scalable disk-based indices. A “Data Evolution” slide showed a lance.batch_udf adding a computed column to an existing dataset without rewriting it, under the subtitle “more than just old-school schema evolution”. The closing logo slide included Databricks, ByteDance, Netflix, Runway, Character.AI, UBS and Airtable.
The Lance repository (Apache-2.0) describes it as an “Open Lakehouse Format for Multimodal AI” and claims random access up to 100× faster than Parquet or Iceberg.
My take: the slide that showed one dataset copied into five systems is the one most teams will recognise. Whether Lance is the answer depends on your workloads. Still, a format with random access, vector indexes and cheap column additions handles the part of AI data work that Parquet was never designed for. And “it’s the data” is why curation pipelines like Datatrove matter as much as the storage format.
Neo4j: a team of agents that builds the knowledge graph
Later that morning I went back to the auditorium for a talk whose slides carried the Neo4j logo. It showed multi-agent knowledge graph construction. A top-level Knowledge Graph Agent delegates to three agents:
- Structured Data Agent: a workflow agent that imports data from CSV files and delegates to sub-agents
- Unstructured Data Agent: a workflow agent that imports data from Markdown and delegates to sub-agents
- GraphRAG Agent: a tool-use agent that chooses a retrieval strategy to answer questions
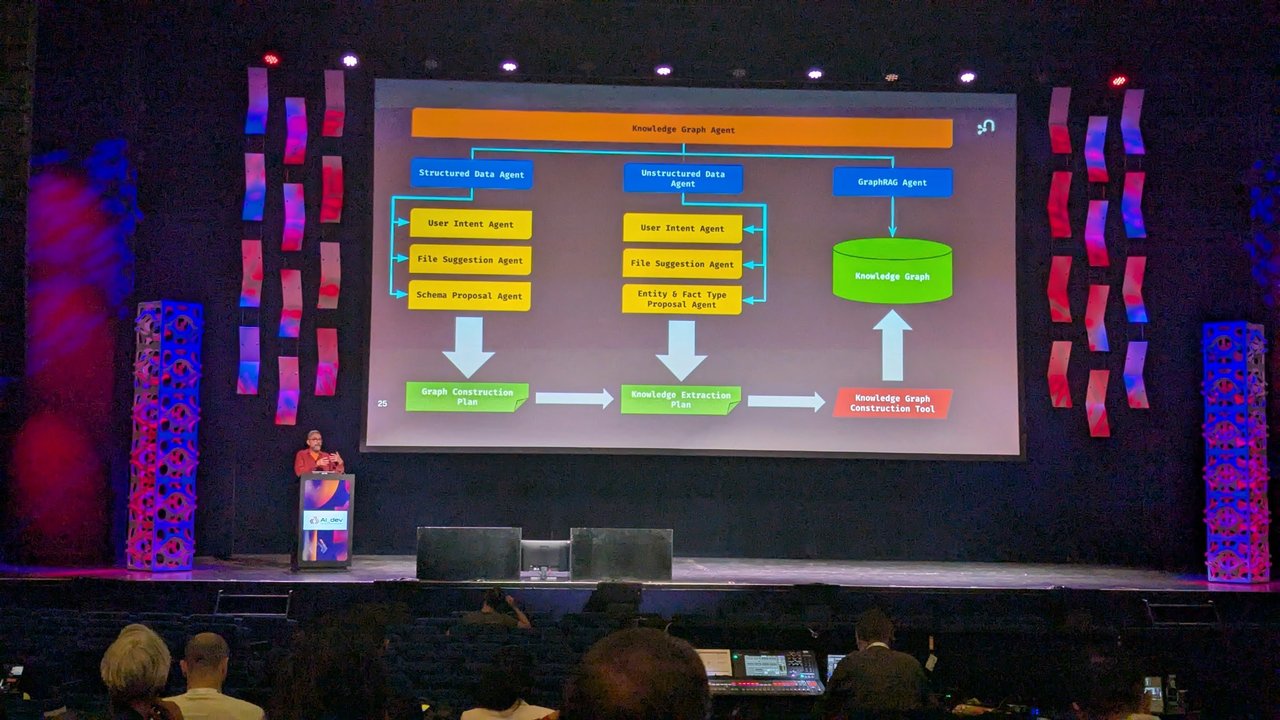
The full agent tree: two import workflows produce construction plans, a tool builds the graph, and a GraphRAG agent queries it.
The structured branch has three sub-agents. A conversational User Intent Agent works out the goal of the import with the user. A tool-use File Suggestion Agent analyses the available CSV files and suggests the relevant ones. A Schema Proposal Agent is a pair of agents in a “critic pattern” that iteratively refines the graph schema. The output is a Graph Construction Plan: the approved rules for turning CSVs into a graph. The unstructured branch mirrors it, with an Entity & Fact Type Proposal Agent instead of schema proposal, and produces a Knowledge Extraction Plan. Both plans feed a Knowledge Graph Construction Tool. The same breakdown is taught in the DeepLearning.AI short course Agentic Knowledge Graph Construction, built with Neo4j.
My take: having agents propose the schema while a person approves the plan is a sensible division of labour. Schema design is where GraphRAG projects usually go wrong, and the critic loop plus the approval step make that decision visible. The query side is covered in my hands-on post on the Neo4j vector index for GraphRAG. Neo4j’s own roadmap from earlier that year is in my GraphSummit Amsterdam 2025 recap.
Afternoon: Container Plumbing Days next door
After lunch I walked over to room D202, where Container Plumbing Days 2025 ran a half-day track in the same building that afternoon (schedule). I caught two of its talks: one about container images, and one about checkpointing GPU training jobs.
skiff: what is filling up your container image?
The first was a short talk on skiff. Its title slide called it an “OCI image analysis utility”, and the closing slide simply said “Give it a try!” with a QR code and github.com/dcermak/skiff. The skiff repository (Go, Apache-2.0) describes it as a simple tool to “uncover what consumes so much disk space in your container images”. The README shows two commands: skiff layers lists every layer of an image with its uncompressed size and diff ID, and skiff top lists the ten largest files and the layer each one lives in.
The skiff title slide: an OCI image analysis utility.
My take: AI images are where this kind of tool pays off. A CUDA base image plus a deep learning framework gets big fast, and you need to know which layer holds what before you can slim it down. The usual first fix is a multi-stage build.
Checkpointing distributed training with CRIU
Next, Radostin Stoyanov presented “Enabling Secure Container Checkpointing for Distributed Model Training”. His title slide introduced him as a PhD student in the Scientific Computing Group, working with Viktória Spišaková, Behouba Manassé and Adrian Reber, and supervised by Prof. Rodrigo Bruno and Prof. Wes Armour. It carried the logos of Masaryk University, Técnico Lisboa, the University of Oxford’s Department of Engineering Science and Red Hat.
The problem slide, “Challenges with Distributed Training”, started from one line: a single GPU failure may require restarting the entire training job. The evidence came from cited papers:
- 54 days of training, 466 job interruptions, with about 78% of the unexpected interruptions attributed to hardware issues (citing the Llama 3 paper)
- 3–23 hours mean time between failures on older GPUs
- an estimated monthly cost of up to a few million dollars, depending on job size
- inefficient checkpointing, because checkpointing larger models means longer GPU idle times
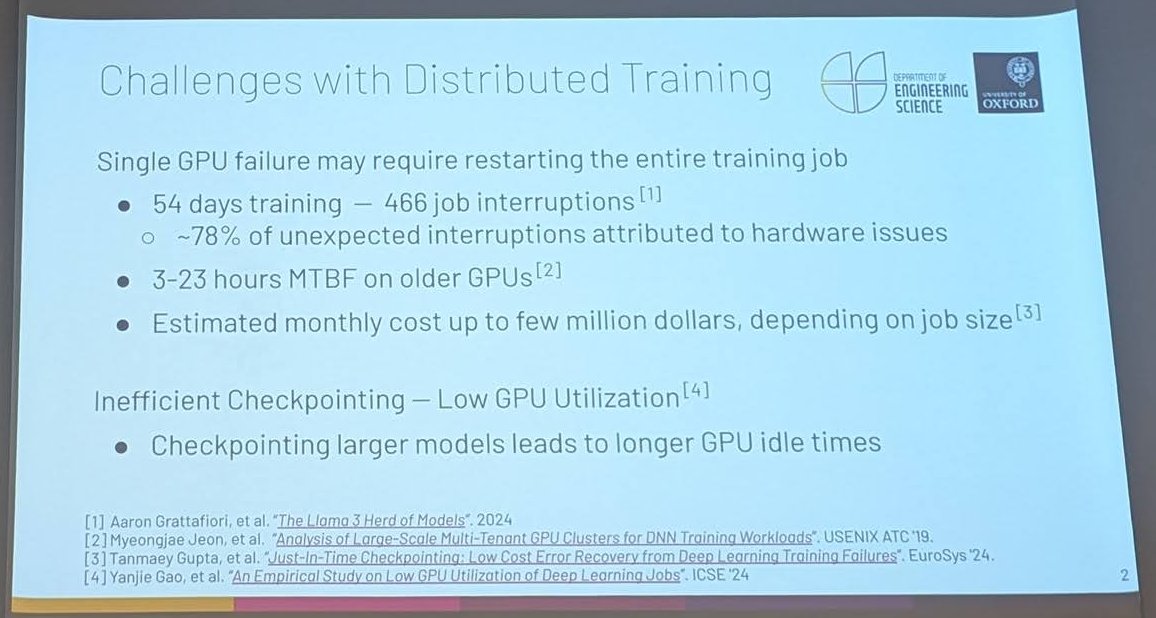
Why checkpointing matters: one GPU failure can restart the whole job.
An “Error Recovery Tradeoffs” slide then compared two approaches. Model checkpoints put error recovery in user code: you restart the training job, re-run the application code and pay potentially large job initialisation overheads. Infrastructure checkpoints recover transparently at system level: they enable checkpointing for every job without user code changes, and they support transparent job migration with existing cluster schedulers.
The how was CRIU with a CUDA plugin. The diagram showed the container (application, ML framework, mapped CUDA libraries and driver) next to CRIU and its CUDA plugin, which talks to cuda-checkpoint and the NVIDIA driver. The sequence was lock (pause the devices), checkpoint the devices, then take the usual CPU checkpoint. The slide cited the paper CRIUgpu: Transparent Checkpointing of GPU-Accelerated Workloads, whose abstract says the work was contributed upstream and released with CRIU 4.0. The CUDA plugin README explains that on newer drivers it calls the CUDA driver API directly, and on older ones (such as r565 and r570) it falls back to the cuda-checkpoint utility.
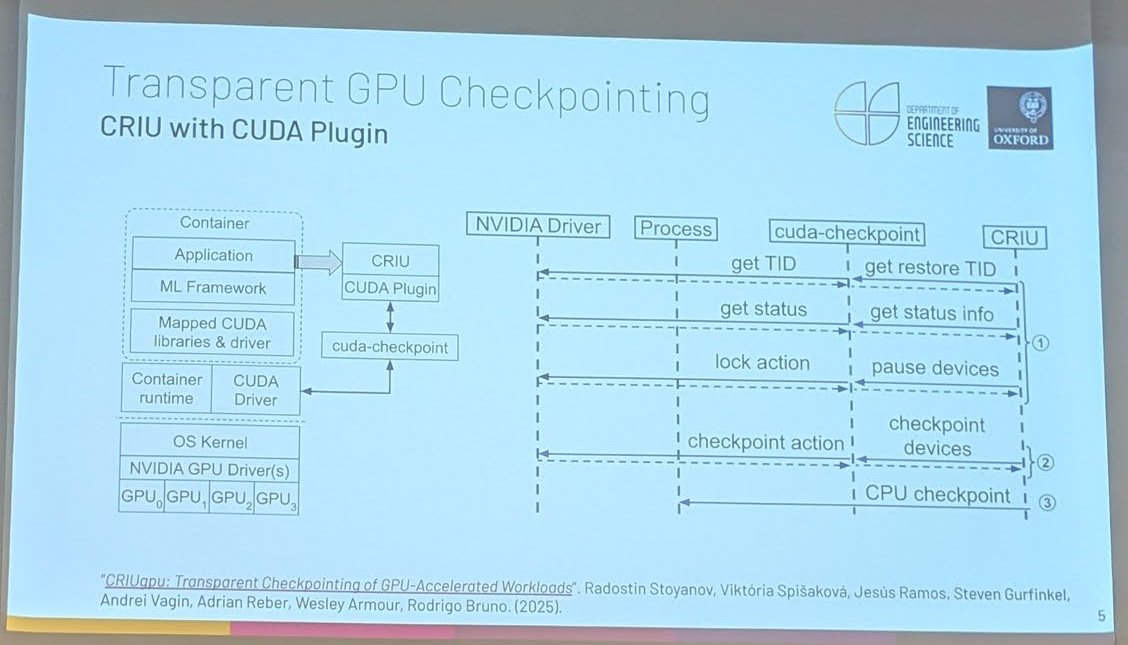
CRIU’s CUDA plugin: lock the GPUs, checkpoint the device state, then checkpoint the process.
Three more pieces filled the rest of the talk:
- Coordinated checkpointing. On a Kubernetes node, the container runtime calls CRIU, and an action script (the
criu-coordinatorclient) synchronises the pre-dump and post-dump steps with acriu-coordinatorserver. That way, several containers in one distributed job are checkpointed consistently. - Built-in encryption for CRIU images. At checkpoint time, CRIU generates a random key, encrypts the image data with ChaCha20-Poly1305 AEAD (256-bit key, 96-bit nonce, 128-bit authentication tag) and encrypts that key with the public key from an X.509 certificate. Restore needs the matching private key. Memory pages get AES-XTS (a 256-bit key plus a 256-bit tweak key, and a 128-bit IV).
- Evaluation with training workloads on an NVIDIA H100 (PCIe 5.0, 80 GB HBM3). The charts went from BERT-B (110M) to Llama 3.1 (8B), and every model on them checkpointed and restored in roughly 30 seconds or less.
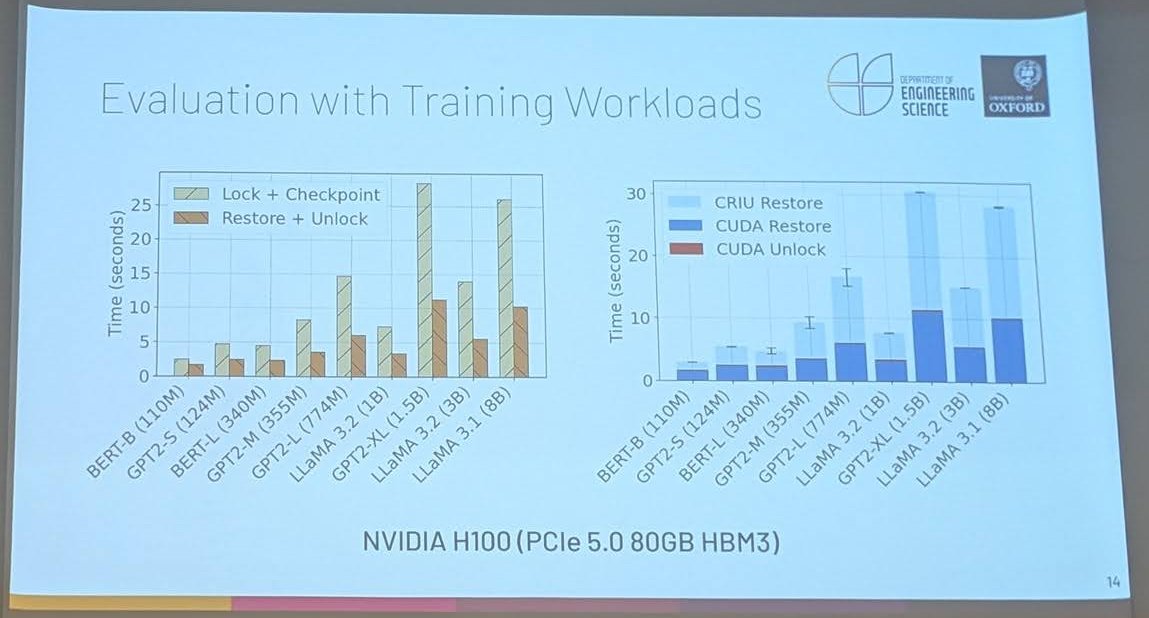
Checkpoint and restore times on an H100, from BERT-B (110M) to Llama 3.1 (8B).
My take: this is the infrastructure version of the CERN lesson from the morning. If the platform can checkpoint and move a training job without the data scientists writing recovery code, GPU failures and preemption become a scheduling problem rather than a lost week. Encryption isn’t optional either: a checkpoint is a full memory dump, with model weights, data and whatever credentials the process held.
Back at AI_dev: GPU kernel caches as OCI images
At 15:40 I was back in an AI_dev breakout room for a session the schedule lists as From Cold Start To Warp Speed: Triton Kernel Caching With OCI Container Images. I missed the title slide, so these notes start in the middle. The problem is JIT compilation: Triton and vLLM compile GPU kernels at runtime, and every new pod pays that cost again. The answer on the slides came in three parts:
- Model Cache Manager (MCM) – Warm.
mcm warm --model facebook/opt-125mprecompiles the kernels in a vLLM container and writes JSON metadata alongside them for portability. The resulting cache directory heldmetadata.jsonandtorch_compile_cache. - MCM – Track. A runtime tracker that monitors cache performance.
MCMTrackingCacheManagerdrops in as a replacement for Triton’sCacheManagerthroughtriton.knobs.cache.manager_class. A footnote said tracking works from torch 2.8.0 and Triton 3.4.0. - Model Cache Vault (MCV). It packages Triton and vLLM caches into OCI images and signs them with Sigstore Cosign. The slide’s bullets: pre-built kernel caches mean faster cold starts and reproducible builds, it works with Docker, Podman, Kubernetes and CI/CD pipelines, it’s “just another container image”, and a ~2× speedup was demonstrated in a Kubernetes deployment.
On Kubernetes, the GPU Kernel Manager (GKM) slide showed the flow. You create a GKMCache custom resource that points at a cache image. The GKM node controller verifies the image signature and pins the resolved digest. The node agent watches the CRDs, runs preflight checks and extracts the cache onto the node, and the workload pod mounts it through a CSI volume (csi.gkm.io). The two bullets underneath: simplify the deployment and management of model kernels in Kubernetes, and accelerate model startup time.
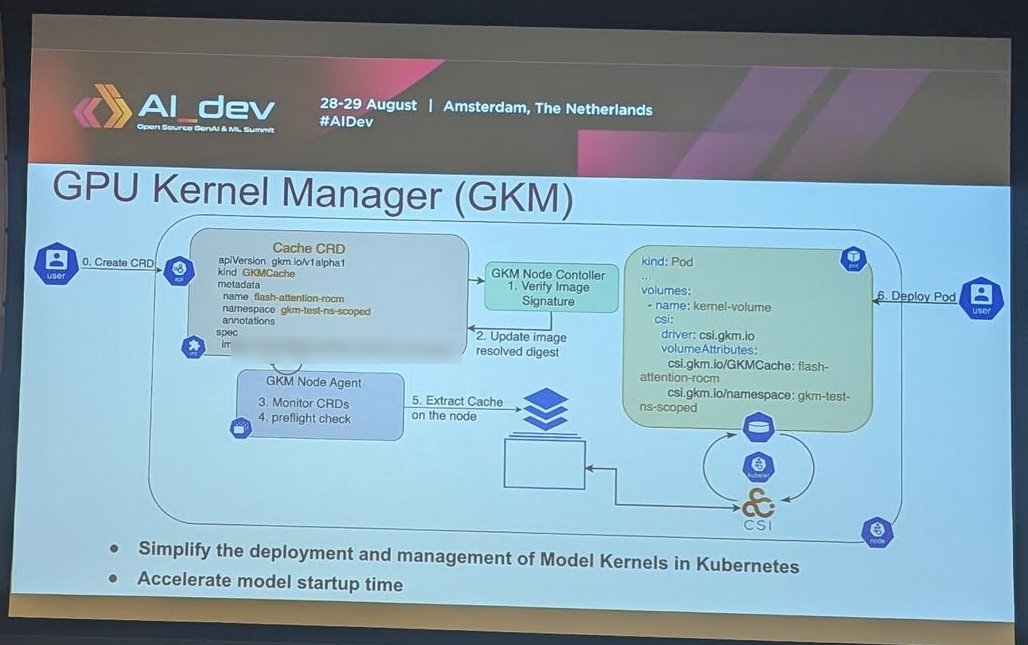
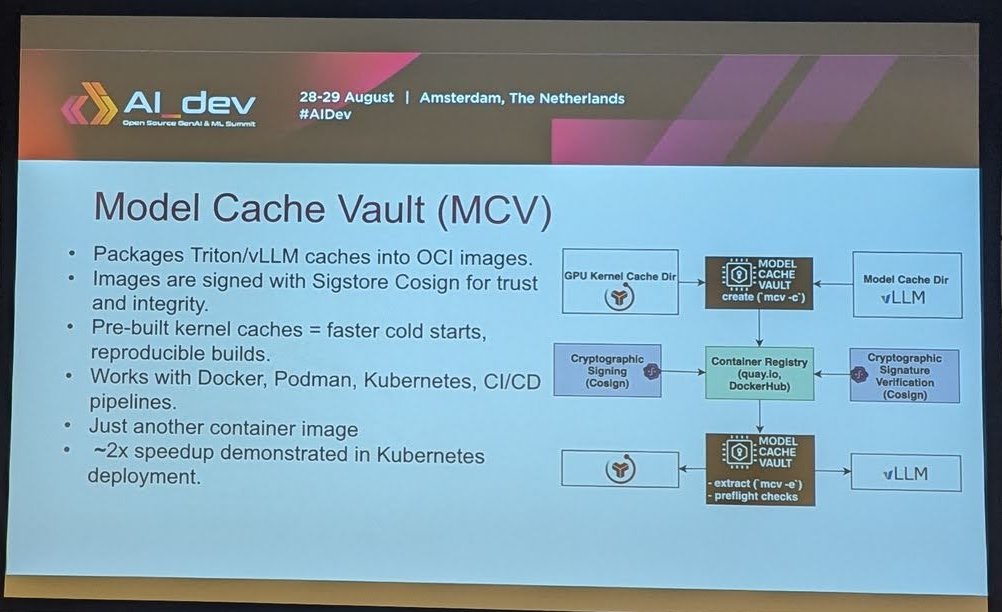
GKM distributes signed kernel-cache images across nodes. MCV builds and extracts them.
Both projects live in the GKM repository under Red Hat Emerging Technologies (Apache-2.0), with MCV in its mcv/ directory. The README describes GKM as “a Kubernetes Operator that propagates GPU Kernel Caches across Kubernetes Nodes”. It has moved on since this talk: GKM now extracts the cache into a PersistentVolumeClaim that the pod mounts, and the CSI approach is described as the original design. It also notes that the node needs the same GPU the cache was generated on, and it puts the gain at up to half of the pod start-up time.
My take: treating kernel caches as signed OCI artifacts is the right idea. Platform teams already know how to mirror, sign, scan and garbage-collect images, so a cache becomes one more artifact in the signing pipeline instead of a new kind of state on the node.
Elyra, KServe and vLLM: one pipeline from notebook to endpoint
The last session I attended was “Streamlining AI Pipelines with Elyra: From Development to Inference with KServe and vLLM” by Ritesh Shah (Senior Principal Architect, Red Hat), at 16:15 in the same room (session page).
His “High Level Architecture” slide put a data scientist on the left working in Elyra’s pipeline editor in Jupyter. The pipeline output went to a model registry, Tekton Triggers and Tekton handled CI/CD, KServe served the model with vLLM, and a monitoring box looped back to the data scientist, all on Kubernetes and OpenShift. Elyra is a set of AI-centric extensions for JupyterLab, with a visual pipeline editor that runs pipelines on Kubeflow Pipelines or Apache Airflow.
The “Elyra Visual Editor Example” was a binary image classifier on a cats-and-dogs dataset. The nodes downloaded and prepared the dataset, created a convolutional neural network, trained and evaluated it, then uploaded the pipeline artefacts to an S3 bucket and the model in OpenVINO format, before deleting the temporary artefacts.
For serving, a “Model Deployment with vLLM” screen deployed Granite-8b-code-instruct-128k with a vLLM serving runtime labelled “vLLM-RHOAI 2.16”. A side panel listed the runtime’s predefined arguments: --port=8080, --model=/mnt/models, --served-model-name={{.Name}}, --distributed-executor-backend=mp and --max-model-len=6144. It noted that you override one by specifying a new value in the “Additional serving runtime arguments” field.
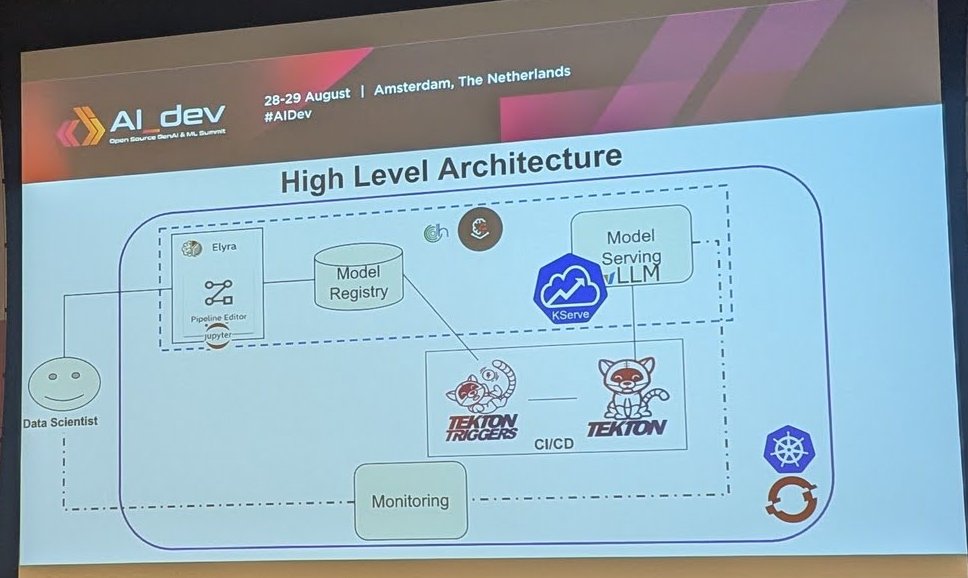
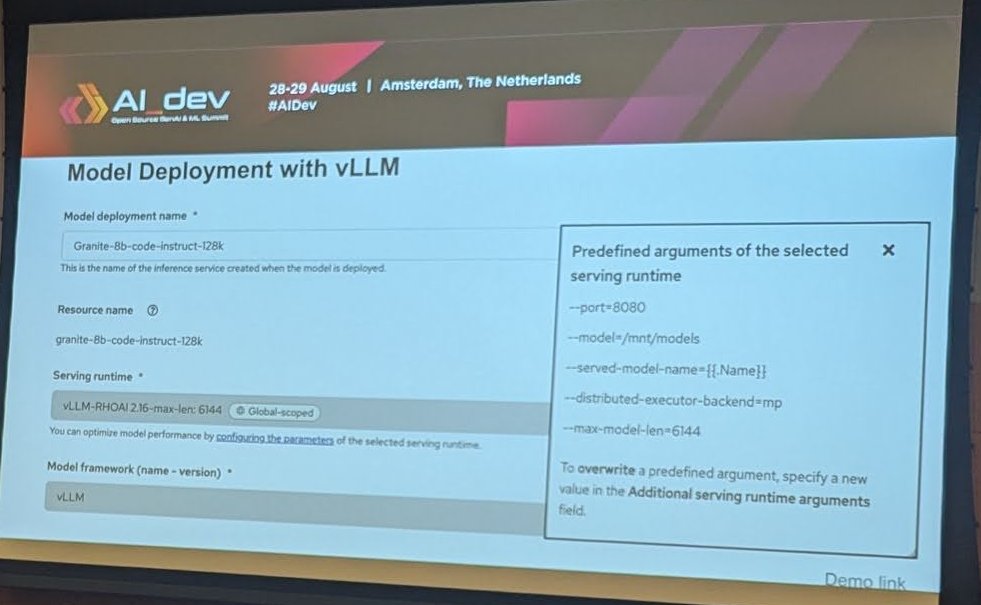
From the Elyra pipeline to a KServe and vLLM endpoint, with Tekton in between.
The closing “MLOps Best Practice and Advantages” slide summed it up:
- use data science pipelines (Elyra and Kubeflow) for experimentation and training, and Tekton for CI/CD deployment of models
- separate concerns: data scientists own experimentation, feature engineering and training logic, while DevOps and ML engineers manage deployment, scaling and runtime monitoring with KServe, Tekton and OpenShift or Kubernetes
- automate the whole process, from code commit to a monitored model deployment
- version every artefact (code, data and the trained model) to make runs reproducible
My take: the split between “data scientists own the pipeline” and “platform engineers own serving” is what makes this stack work in practice. The KServe and vLLM side is covered in my post on model serving with vLLM on OpenShift AI, and the trigger side in Tekton Triggers with a GitHub webhook.
Takeaways
AI_dev was short and dense. The talks I’ll remember shared a theme: the model was rarely the hard part. CERN’s wins were GPU partitioning and NUMA pinning. Cerebras’ were HTTP/2, routing and bot defence. deepset’s was deciding what goes into the context. LanceDB’s was getting rid of five copies of the same data, and Neo4j’s was agreeing on a schema before building the graph. The afternoon added three more: checkpointing GPU jobs without touching user code, shipping kernel caches as signed images, and handing a trained model from Elyra to KServe and vLLM through CI/CD. That’s a platform engineering agenda, and it fit well after the three Open Source Summit days that came before it.